Rain is in the forecast, which makes it a perfect time to debut our Rain Gauge Network. This new webpage will display rainfall data from the area surrounding Morro Bay and beyond.
Now, we need you to join the network and help us gather that data.
Why track rainfall?
All precipitation that falls within the Morro Bay watershed can eventually make its way into the estuary through creeks and storm drains.
This video shows runoff from roofs, streets, parking lots, etc. entering Morro Bay through a storm drain near the Estuary Program office. Runoff can contain sediment, bacteria, and chemical residue. Because of this, it’s best to stay out of the water for 72 hours after it rains.
Rain is very important to the Morro Bay estuary and the lands that surround it. We all know that rain helps plants grown on land, but rain is also important for plants and wildlife that live in the water. Adequate rainfall helps fish survive the dry season, and it can make the difference for steelhead trying to reach an upstream site to spawn. Rainfall and freshwater flow from creeks also help to balance out the salt content of the ocean water that enters the estuary from the harbor mouth.
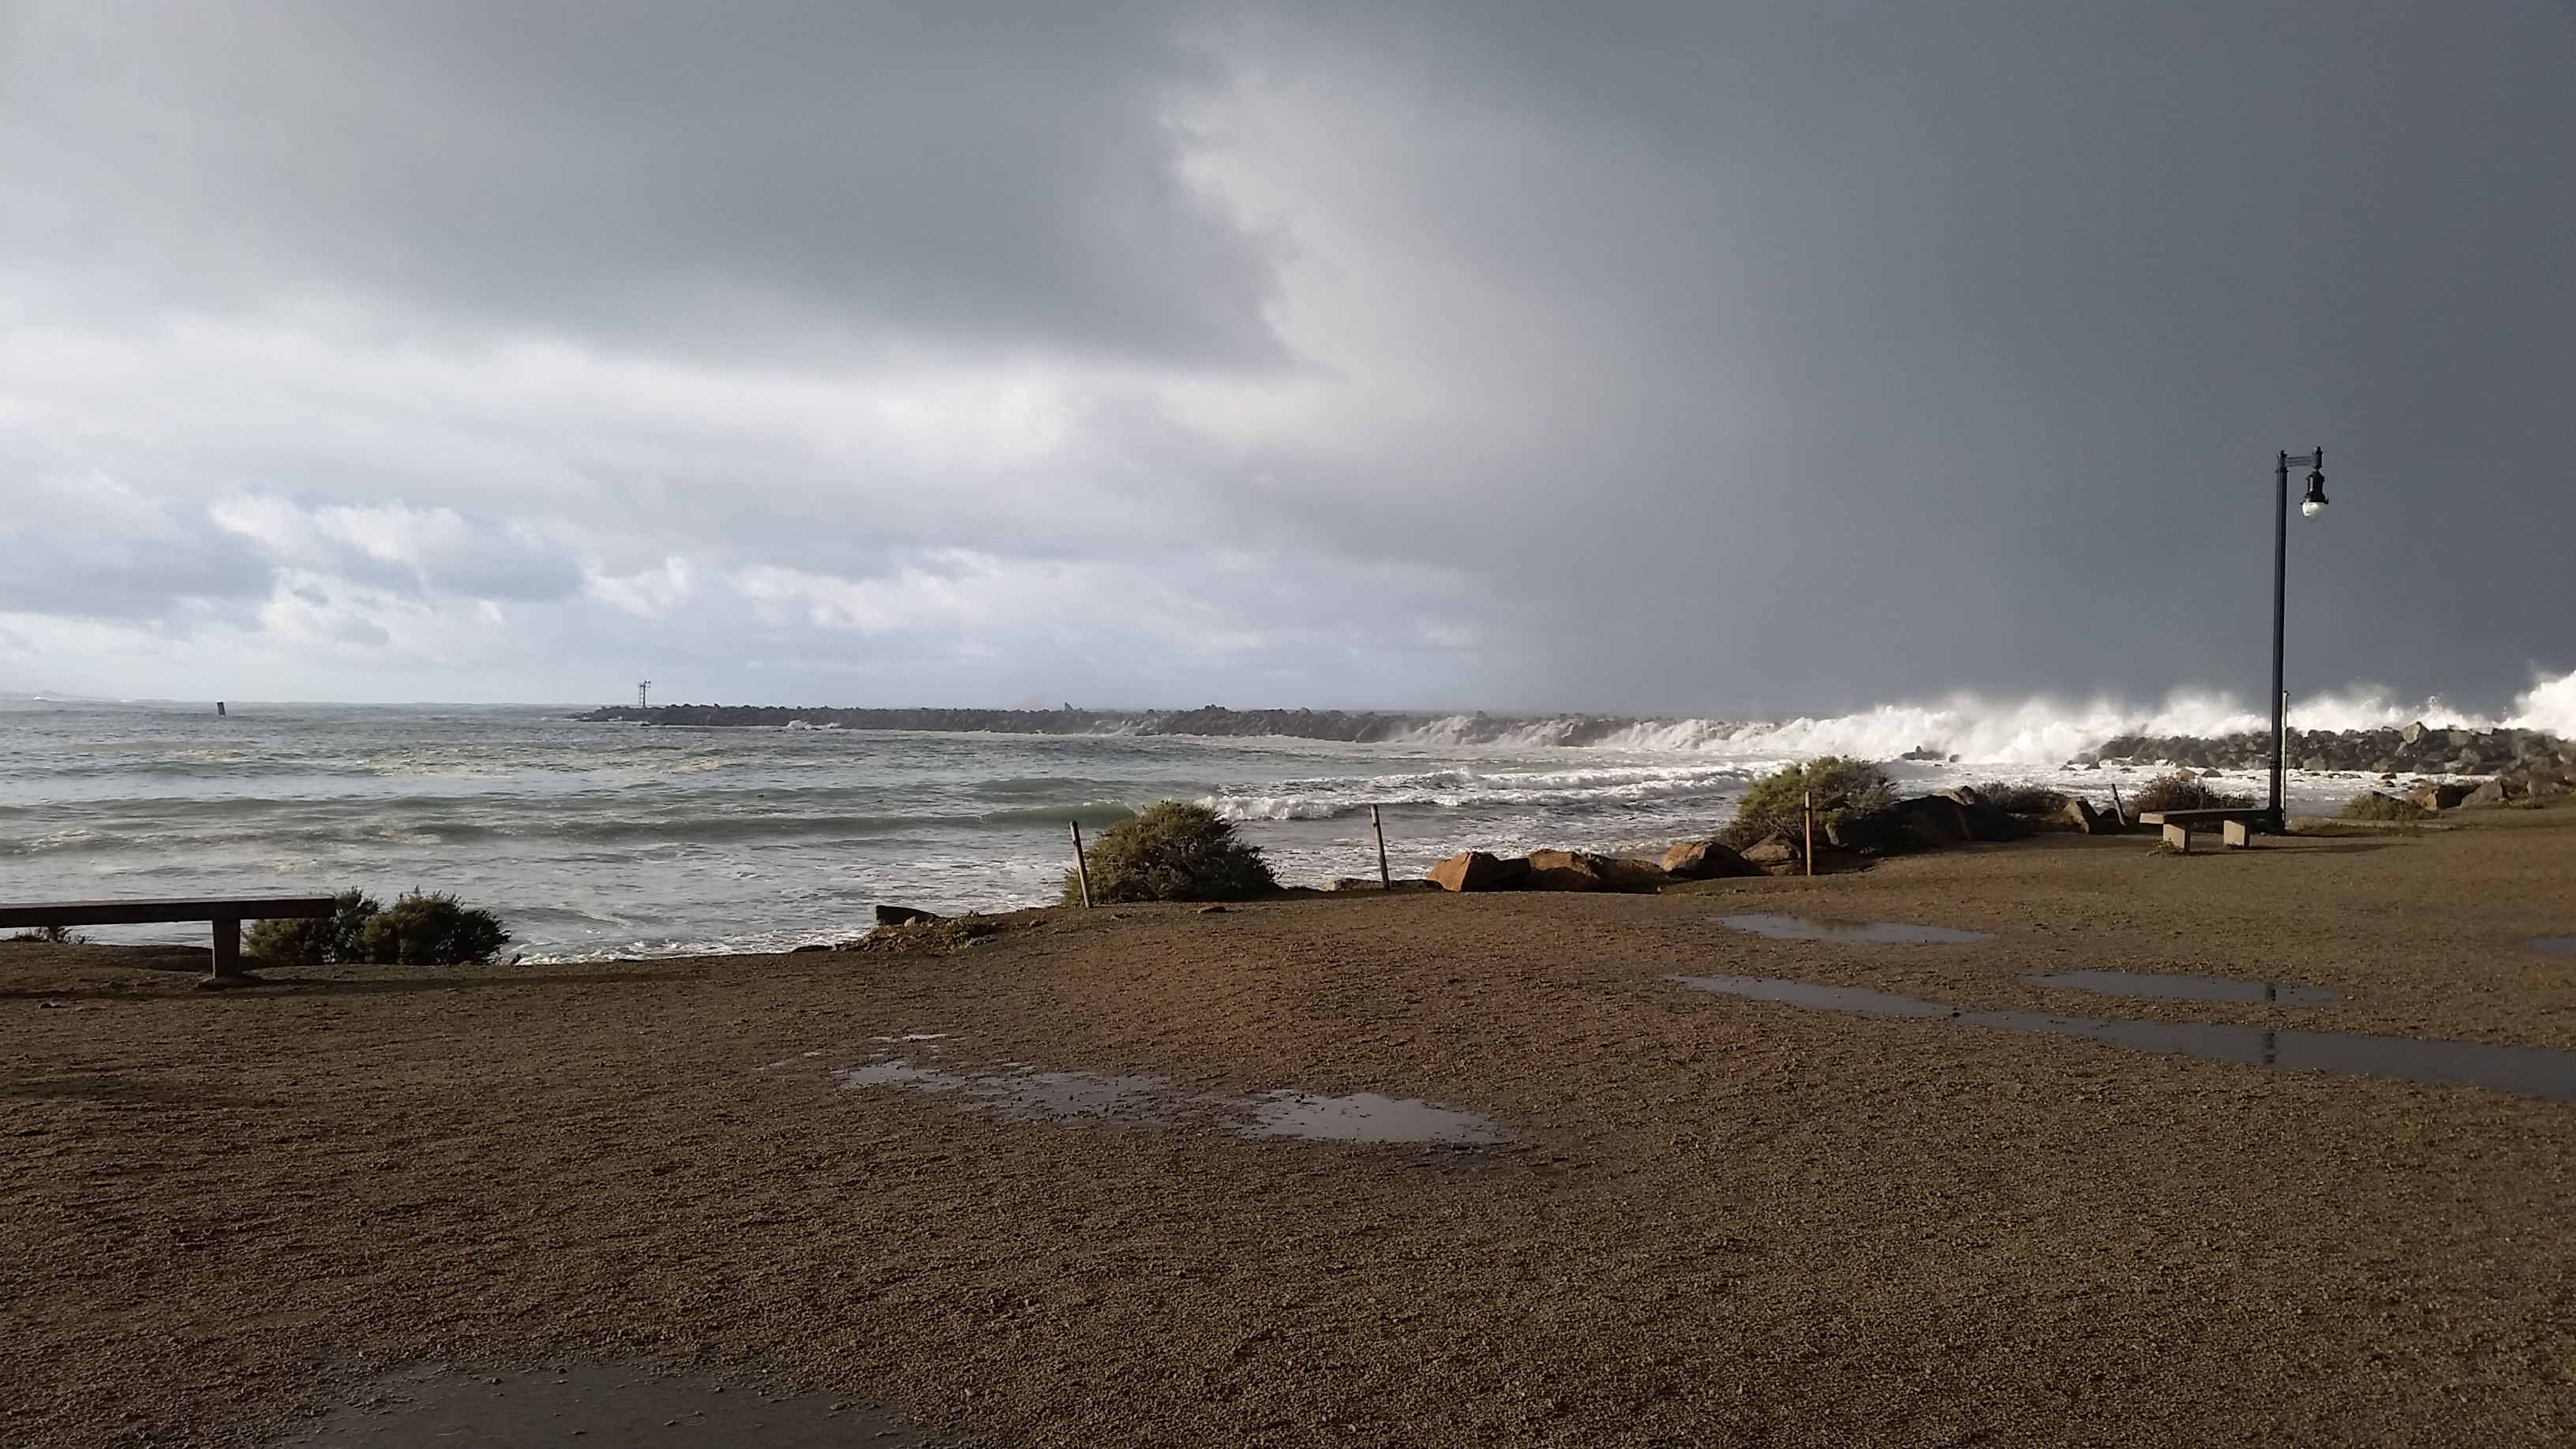
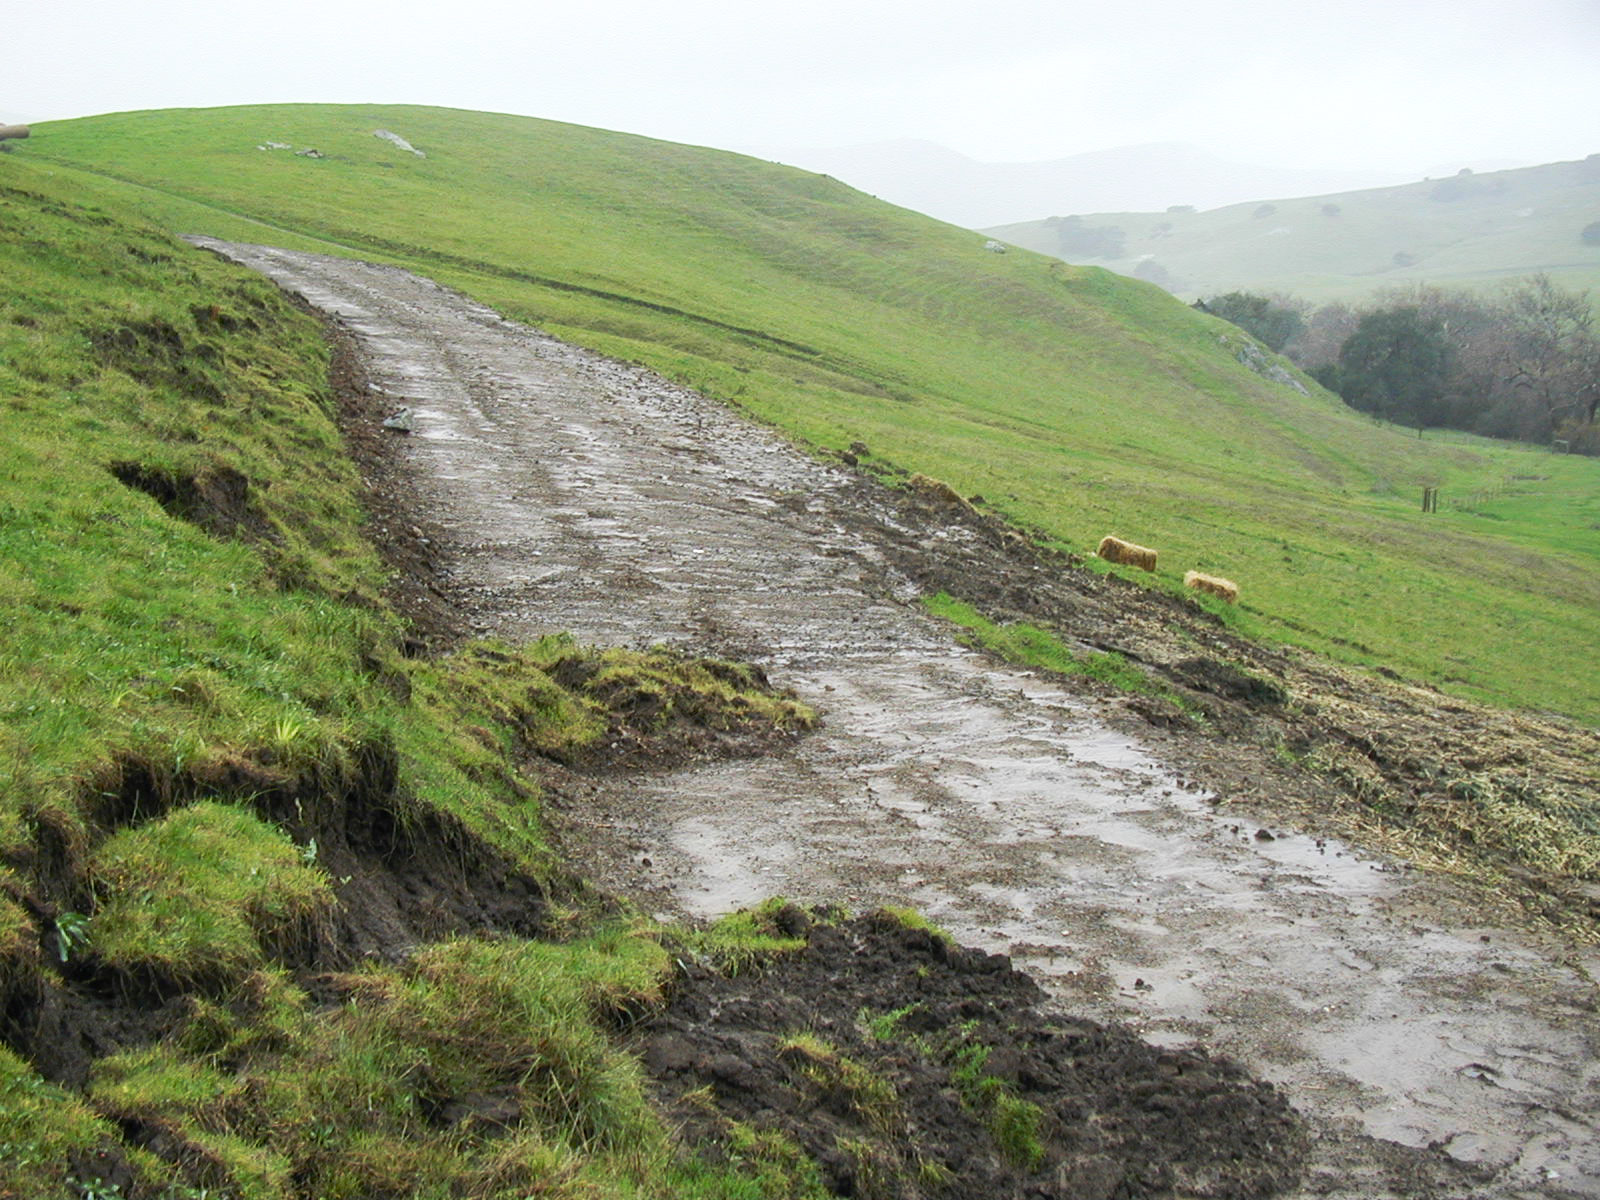
Rain can also cause problems for the bay. When a large amount of rain falls quickly, it can lead to erosion and wash sediment into the bay, making it difficult for plants and wildlife to thrive.
Local Data and Citizen Science
The County of San Luis Obispo has a wonderful website that tracks rainfall and streamflow at certain key sites countywide. This kind of information is very accurate and invaluable, but there are only a few stations within the watershed.
The Morro Bay Rain Gauge Network is different because it relies on citizen scientists to gather hyperlocal data that can give us a picture of how much rainfall is draining into the smaller upland creeks that run into Chorro and Los Osos creeks and then out into the bay. In order to make the watershed picture complete, we need to have Rain Gauge Network participants in each area of the map below.
Check it out to see if your home, school, or business is in one of these areas.
![]()
If you are located in one of the areas labeled on the map above, then you can join us. Here’s how.
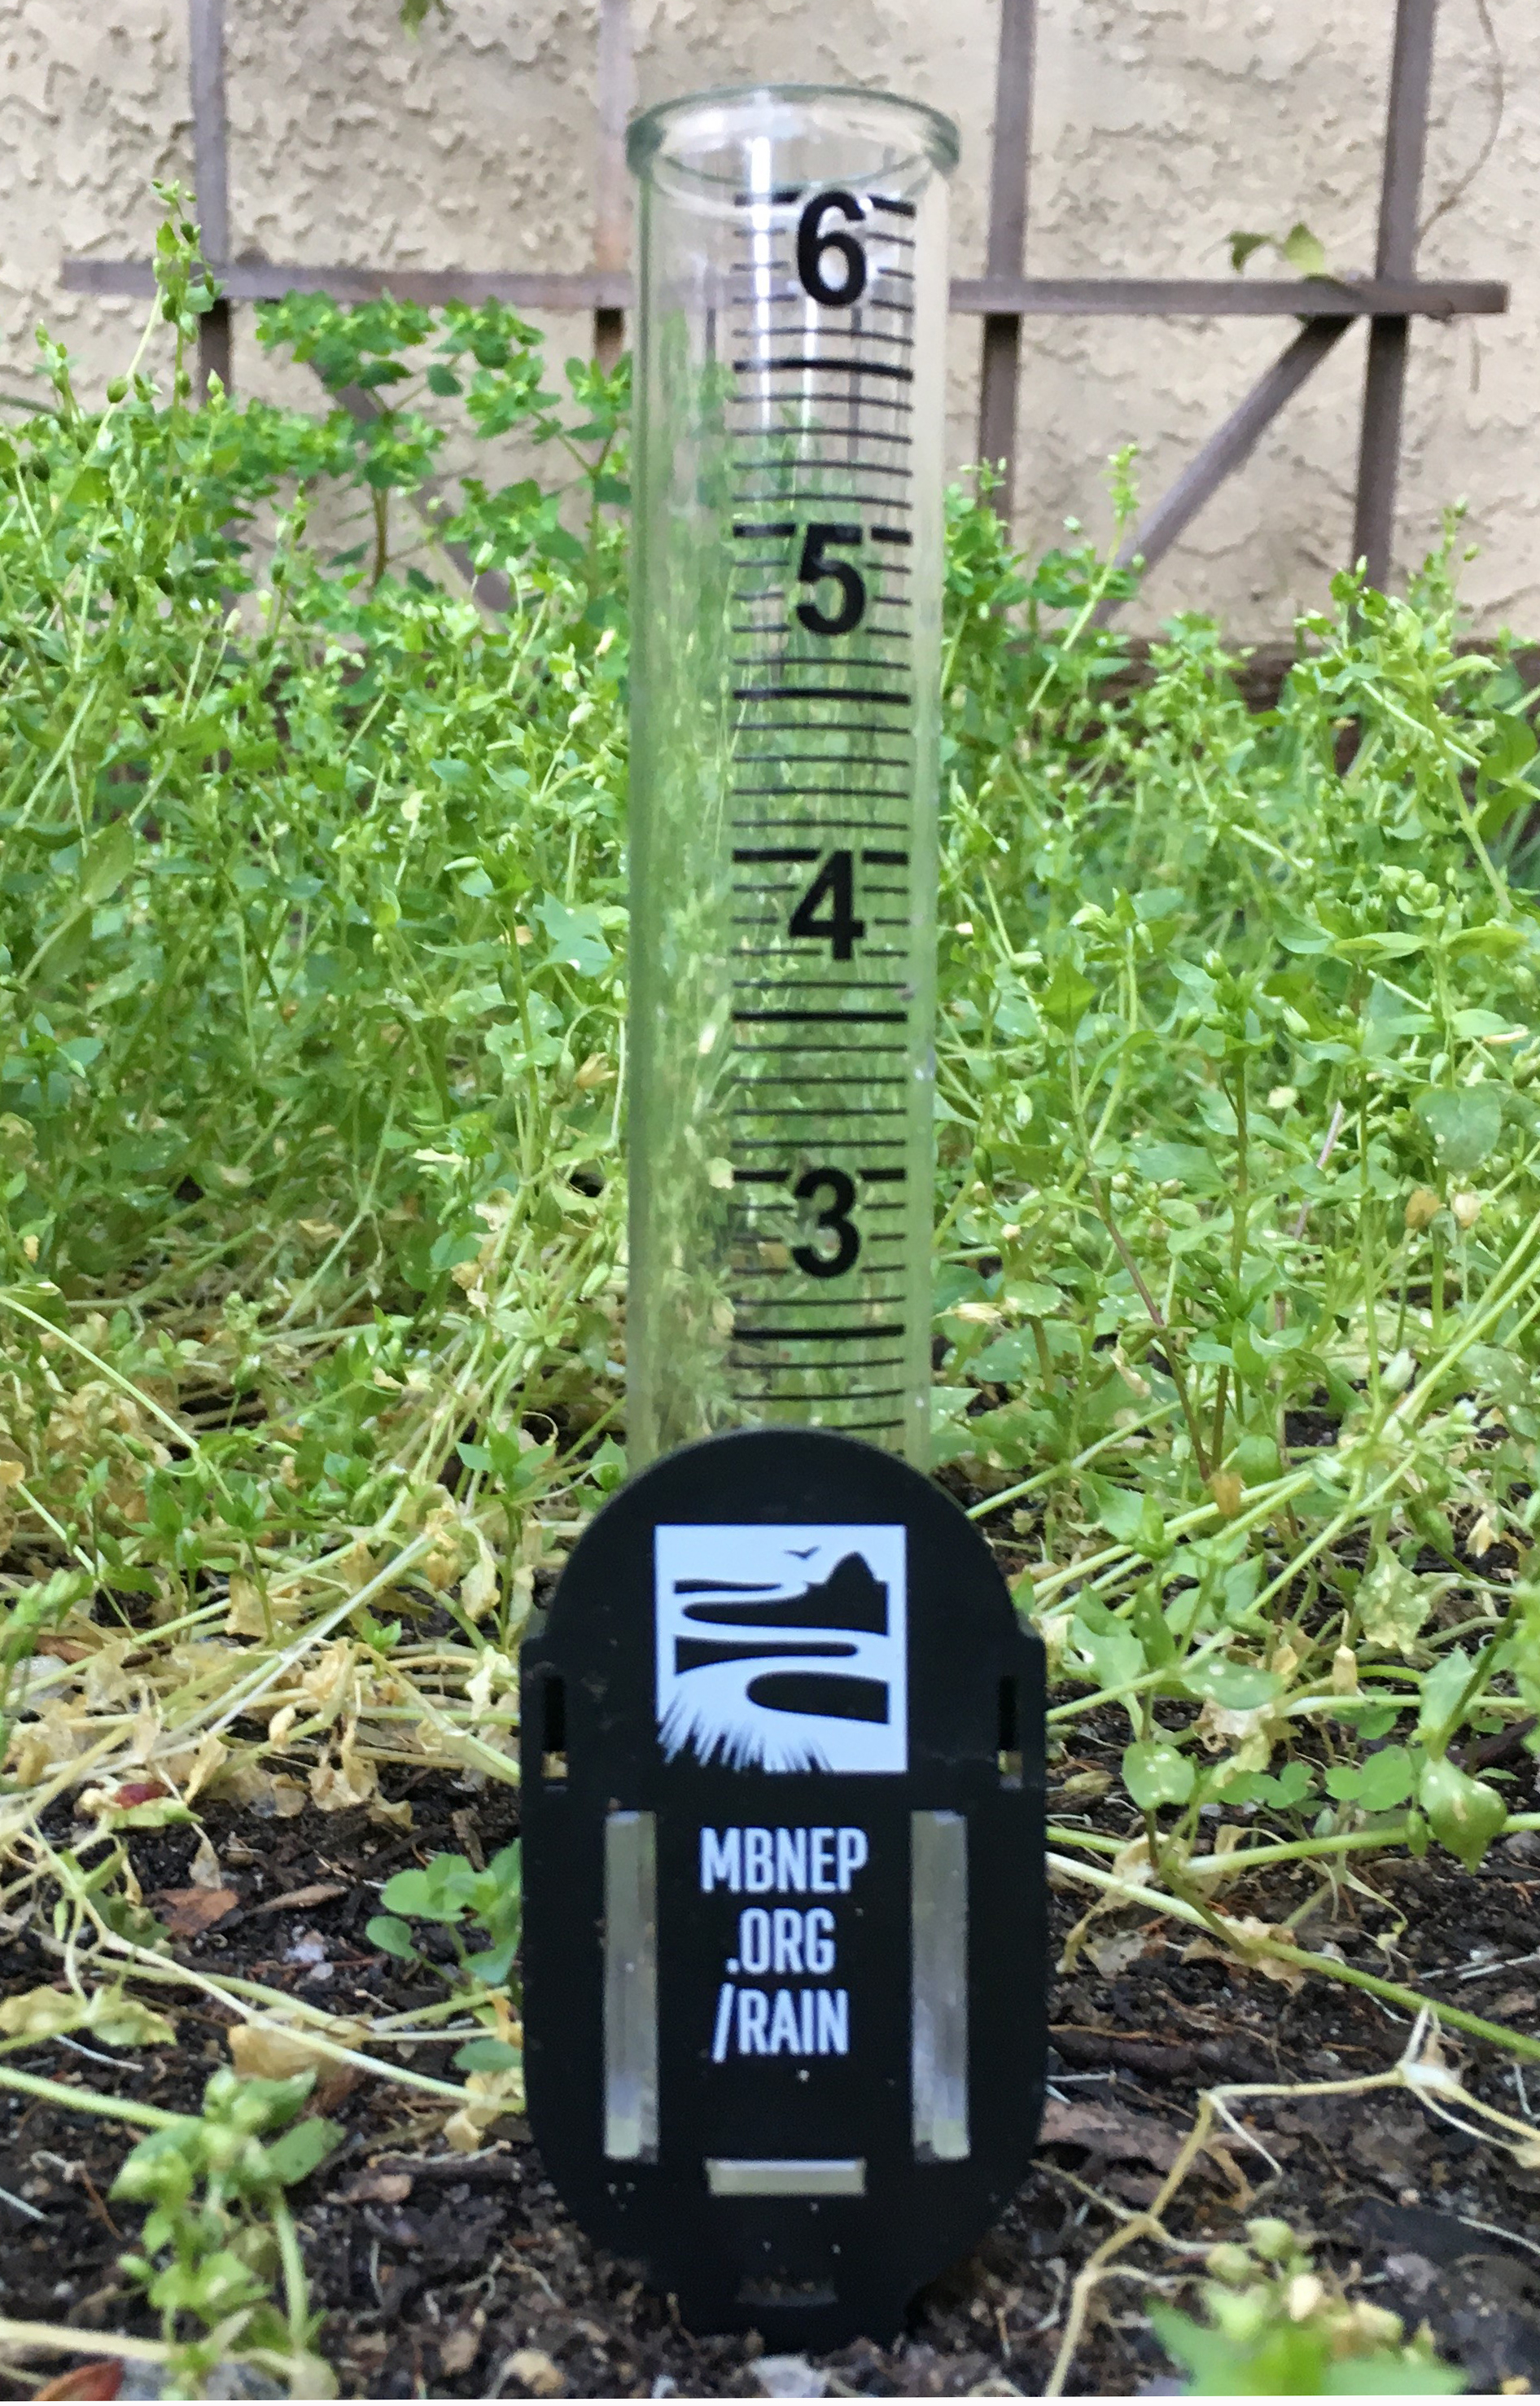
- Pick up your free rain gauge from the Estuary Program office. (Or, use a rain gauge that you already have at home.)
- Install your rain gauge in an open area away from overhangs, gutters, and downspouts.
- Whenever it rains, make a note of how much rain collects in your gauge. It is best to do this once a day during multi-day storms.
- Visit MBNEP.org/rain and scroll down to the data entry form. Enter your email address and your rainfall totals for each day on this website. (You can enter your data after each storm, or keep notes on your measurements and enter them once a month. It’s up to you! Just make sure to select the correct date for each measurement.)
- Watch your new data pop up in the Rain Gauge Network table. It will be averaged with other Rain Gauge Network stations in your watershed section, but you’ll also get to see data just for your rain gauge station displayed on the screen
We’re just getting started, but over time, the data in this table will accumulate and we’ll be able to compare data season over season and year over year.
We hope to see you—and your rain gauge data—soon!