Each spring, Estuary Program staff and volunteers gear up for Bioassessment, an important monitoring tool that allows us to assess the health of local streams to determine their value as fish habitat. We conduct monitoring at creek sites throughout the Morro Bay watershed, which involves collecting macroinvertebrate or “macro” samples (insects that are visible to the naked eye) and taking measurements of the health of creek habitat.
Here’s what a day of monitoring involves.
Water quality monitoring
Upon arriving at the site, we use water quality meters to collect information such as pH, temperature, turbidity, flow, and oxygen levels. Fish and macros prefer water of neutral pH, cool temperatures, low turbidity (meaning that the water is clear), and high oxygen levels.
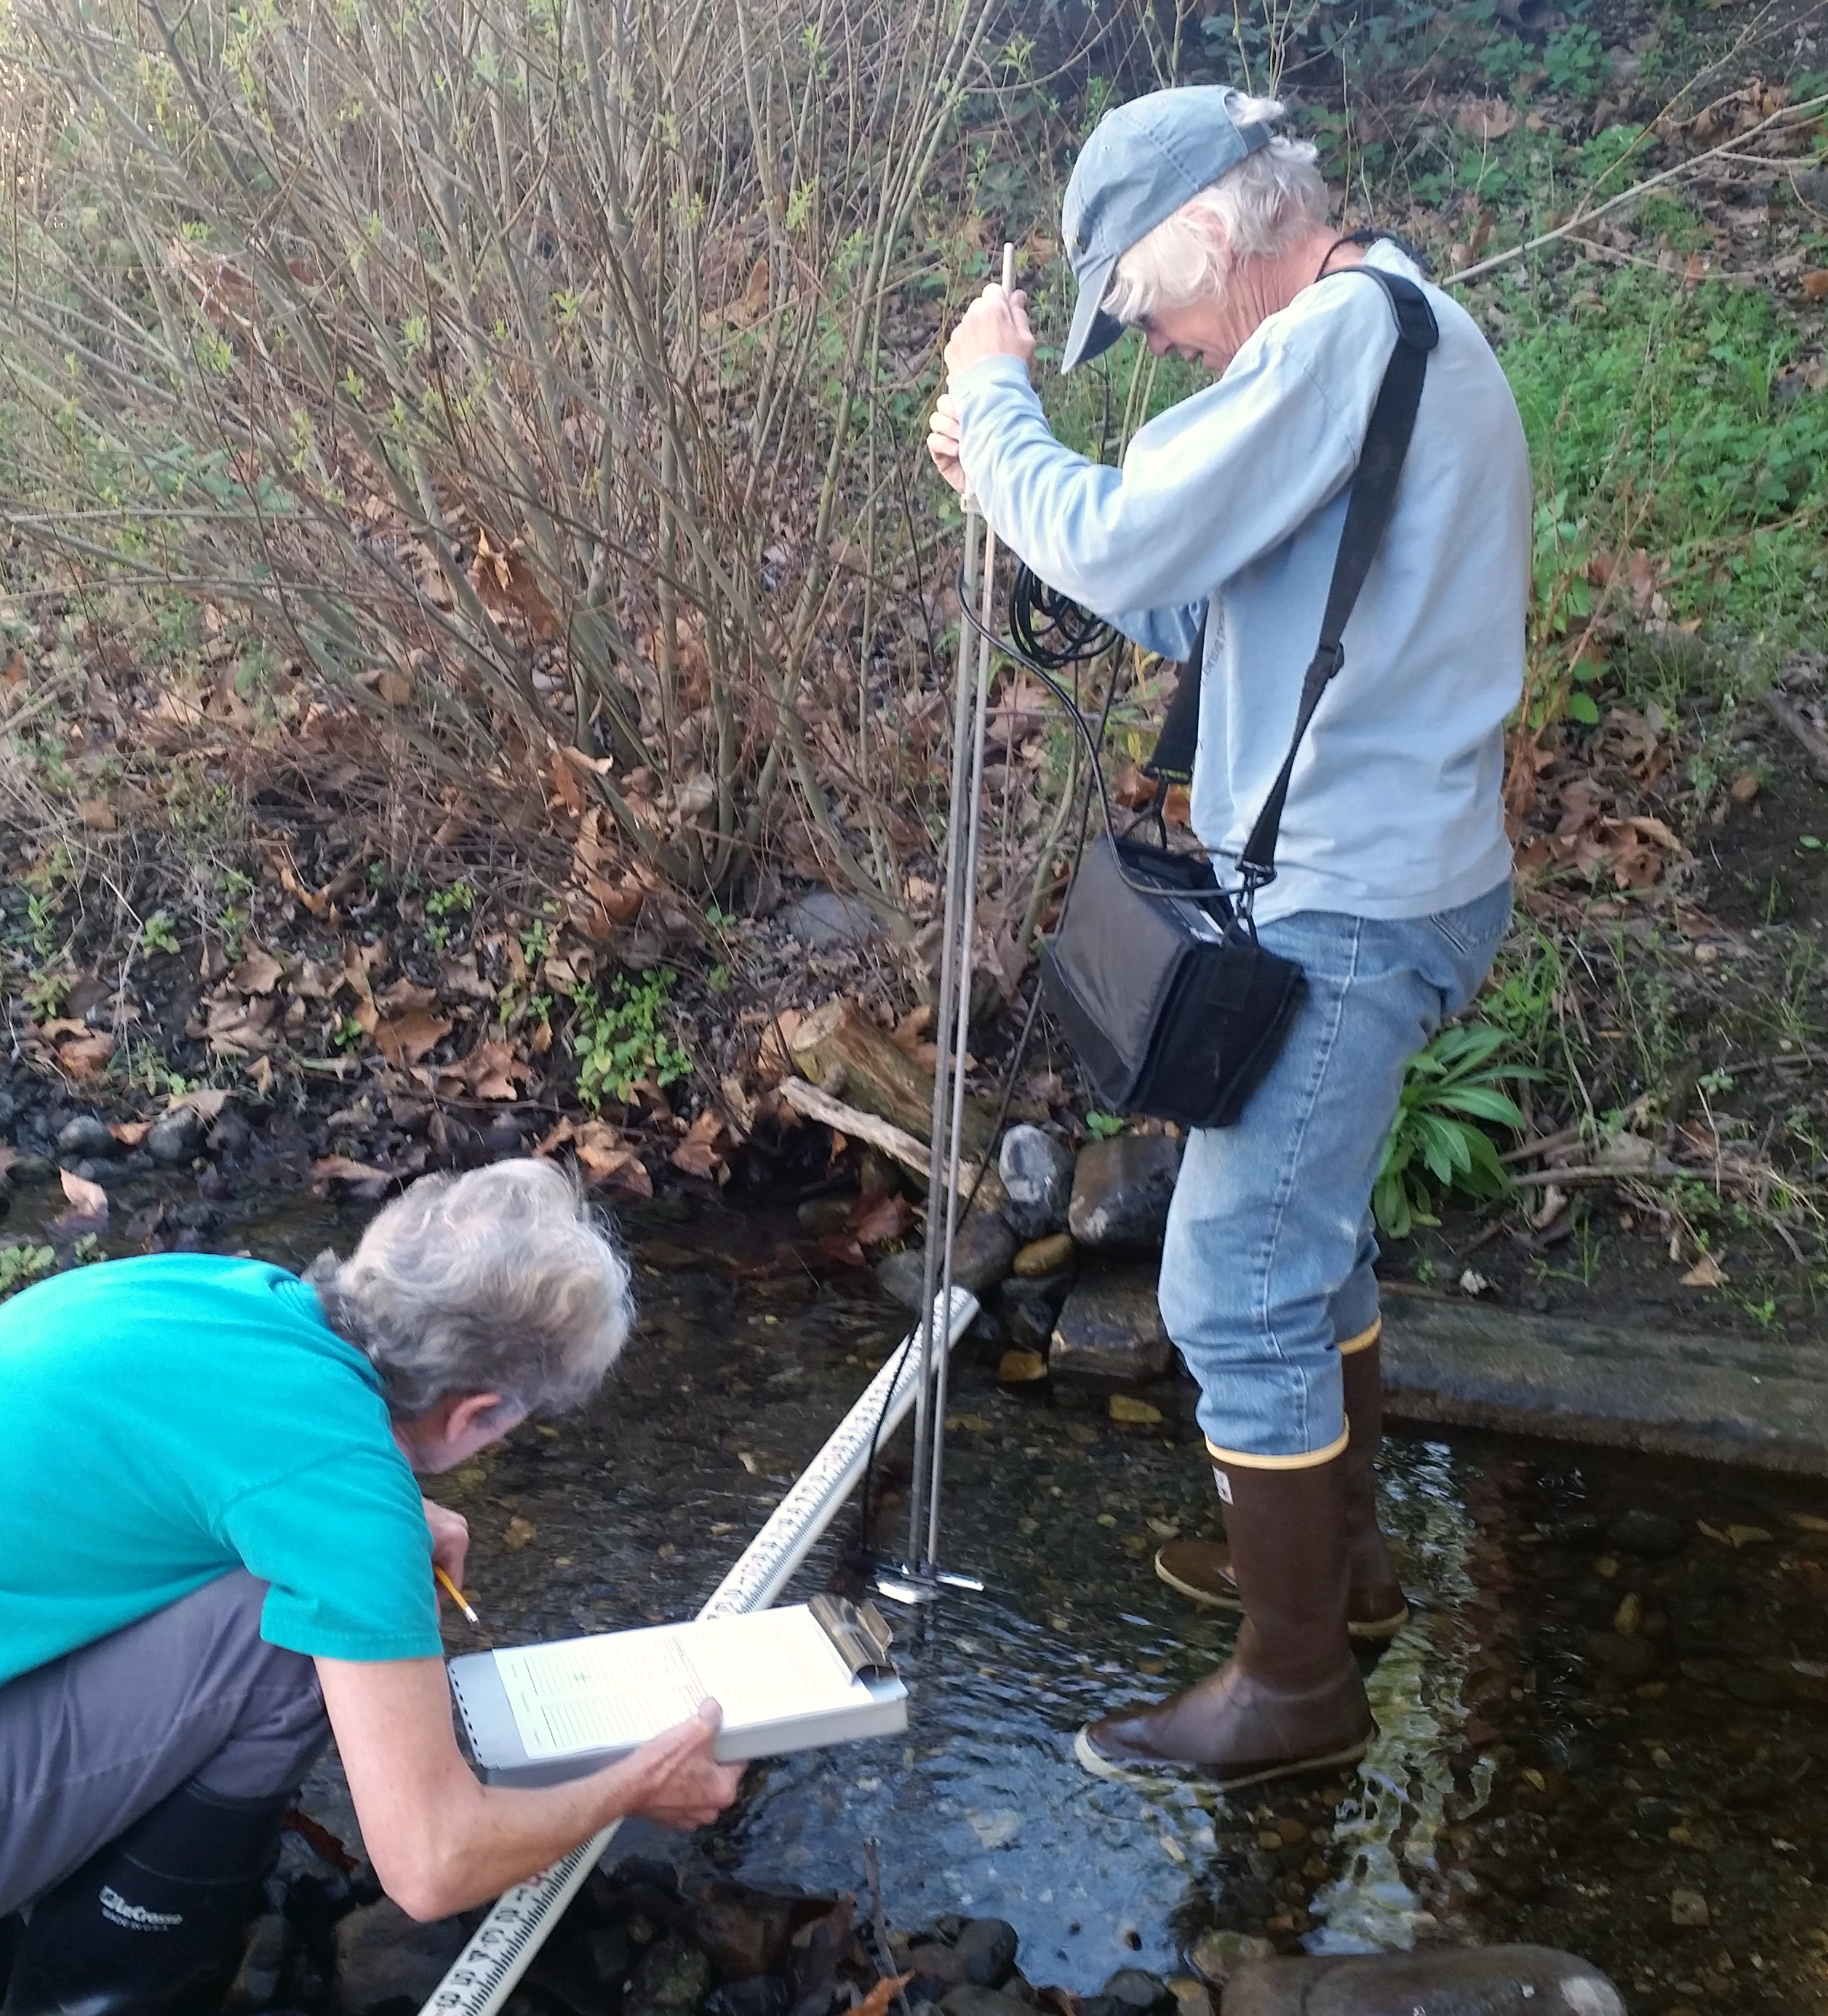
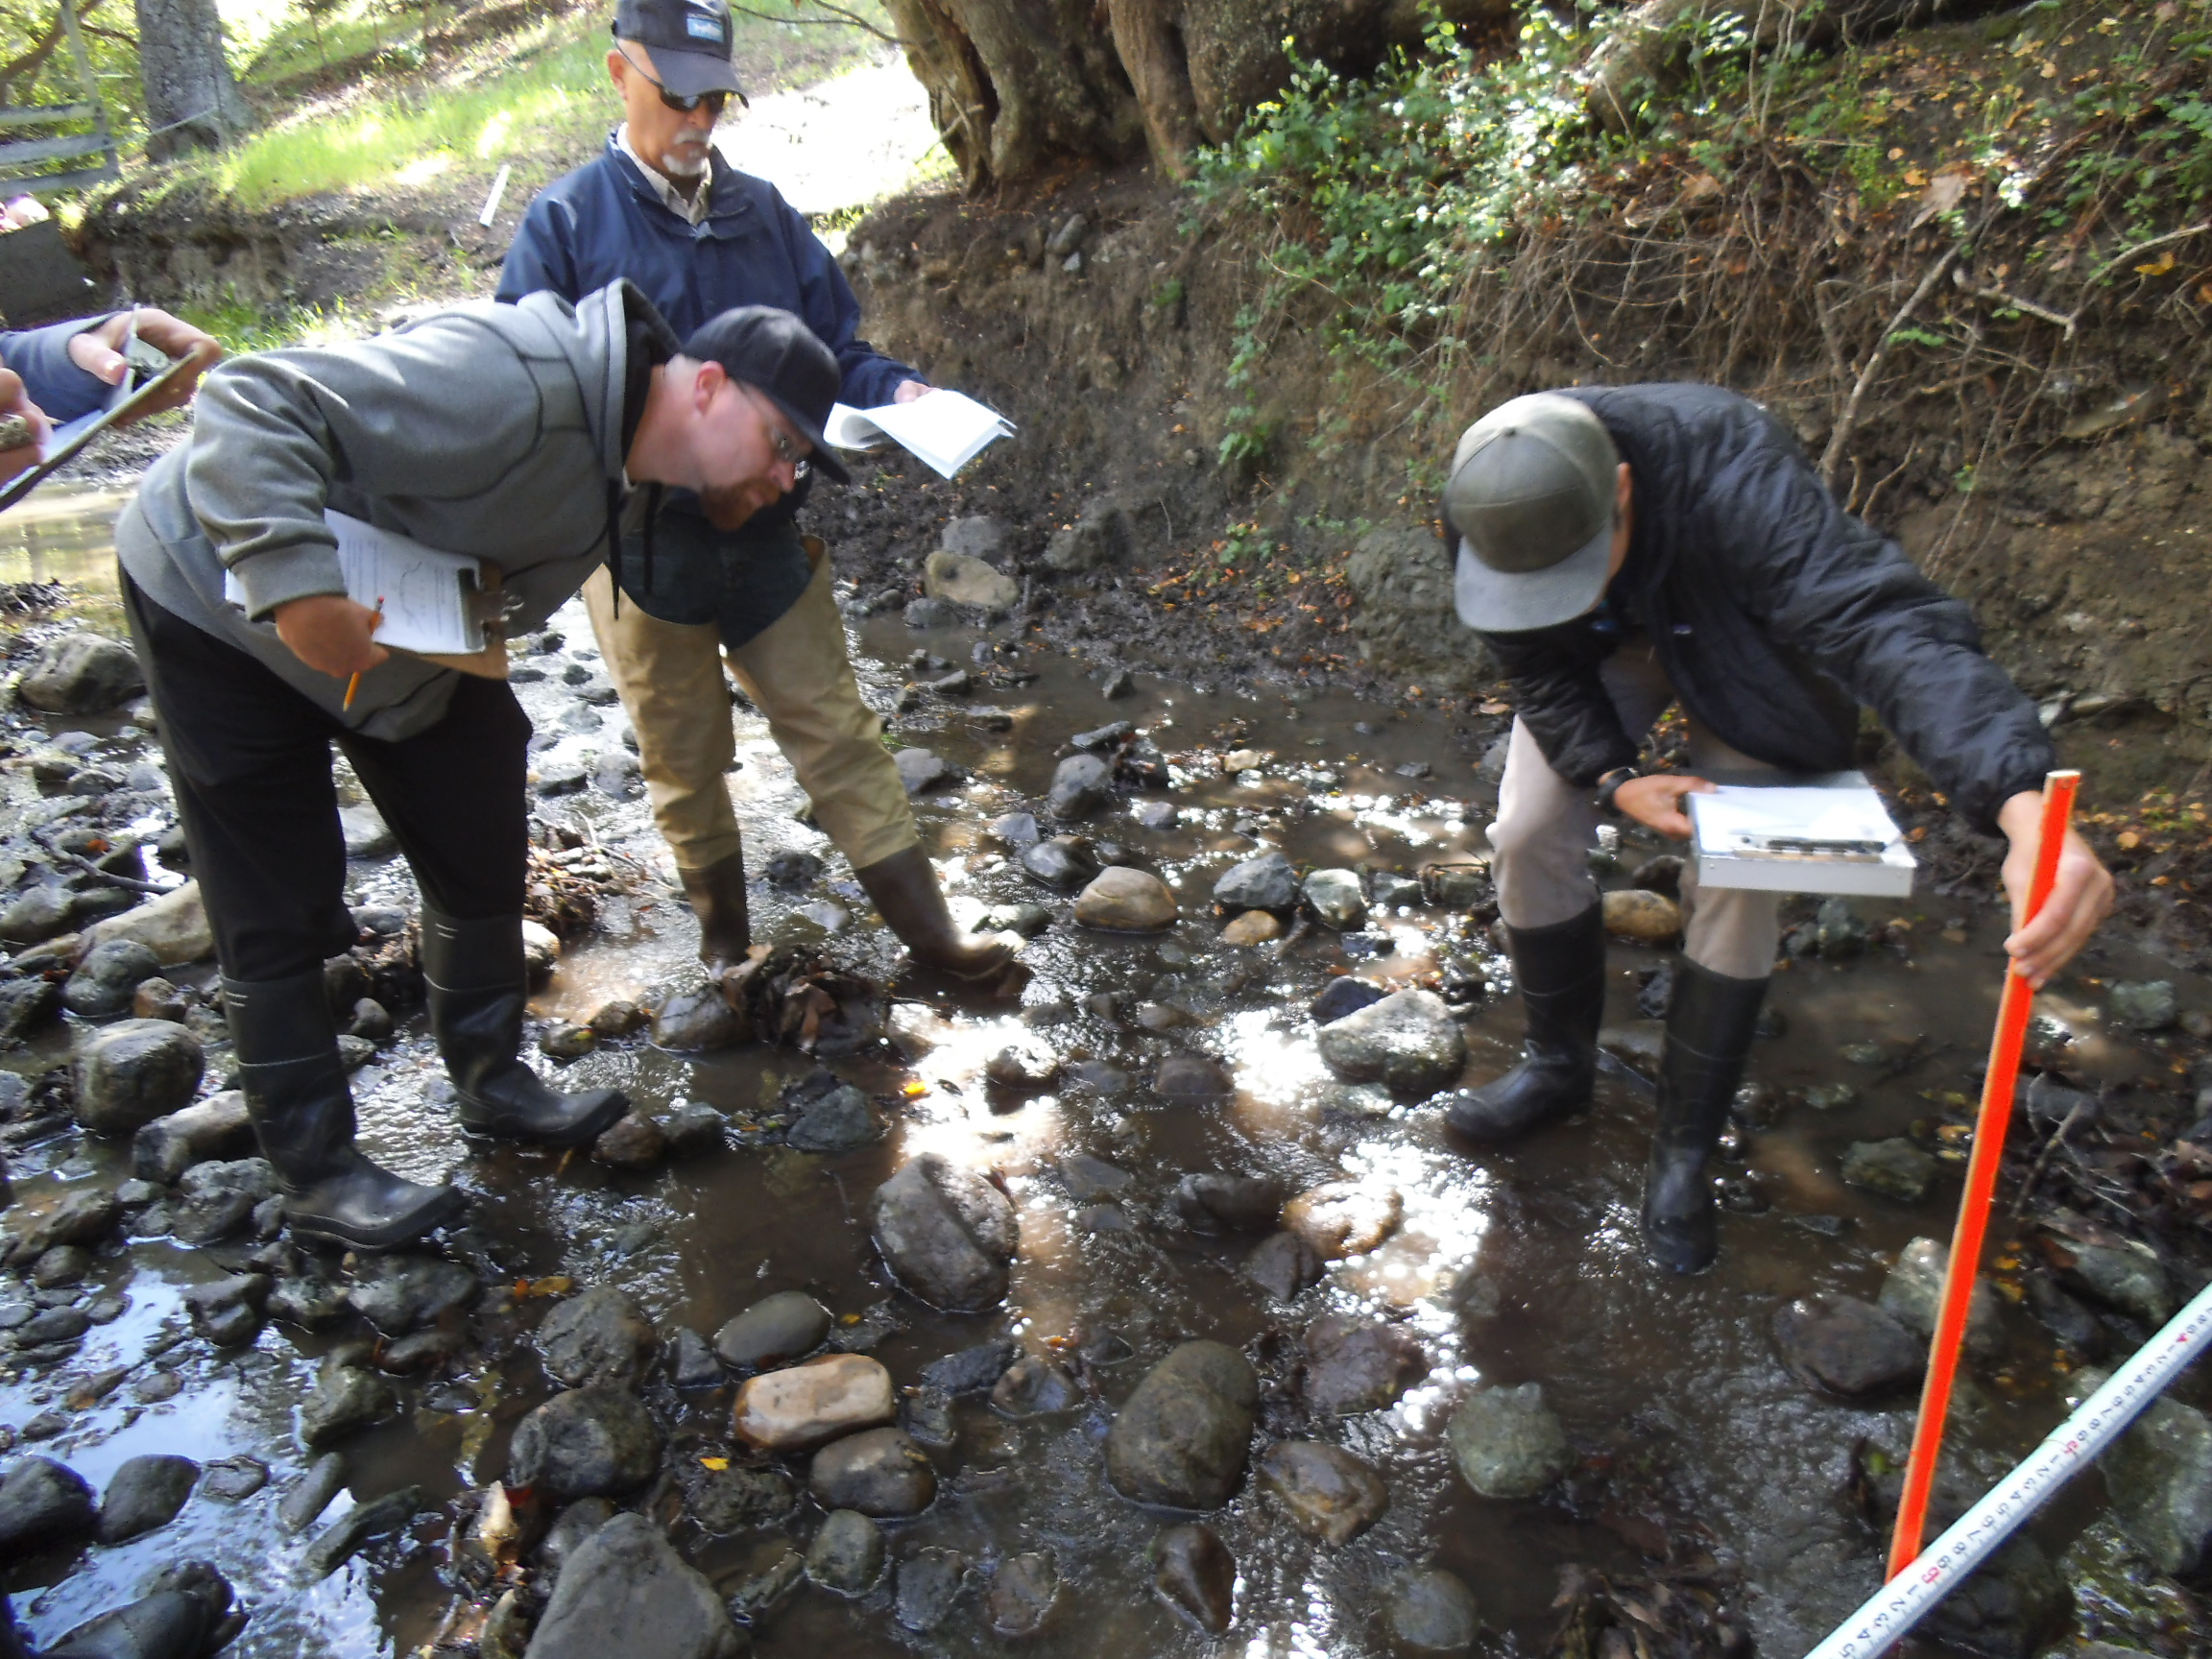
Habitat measurements
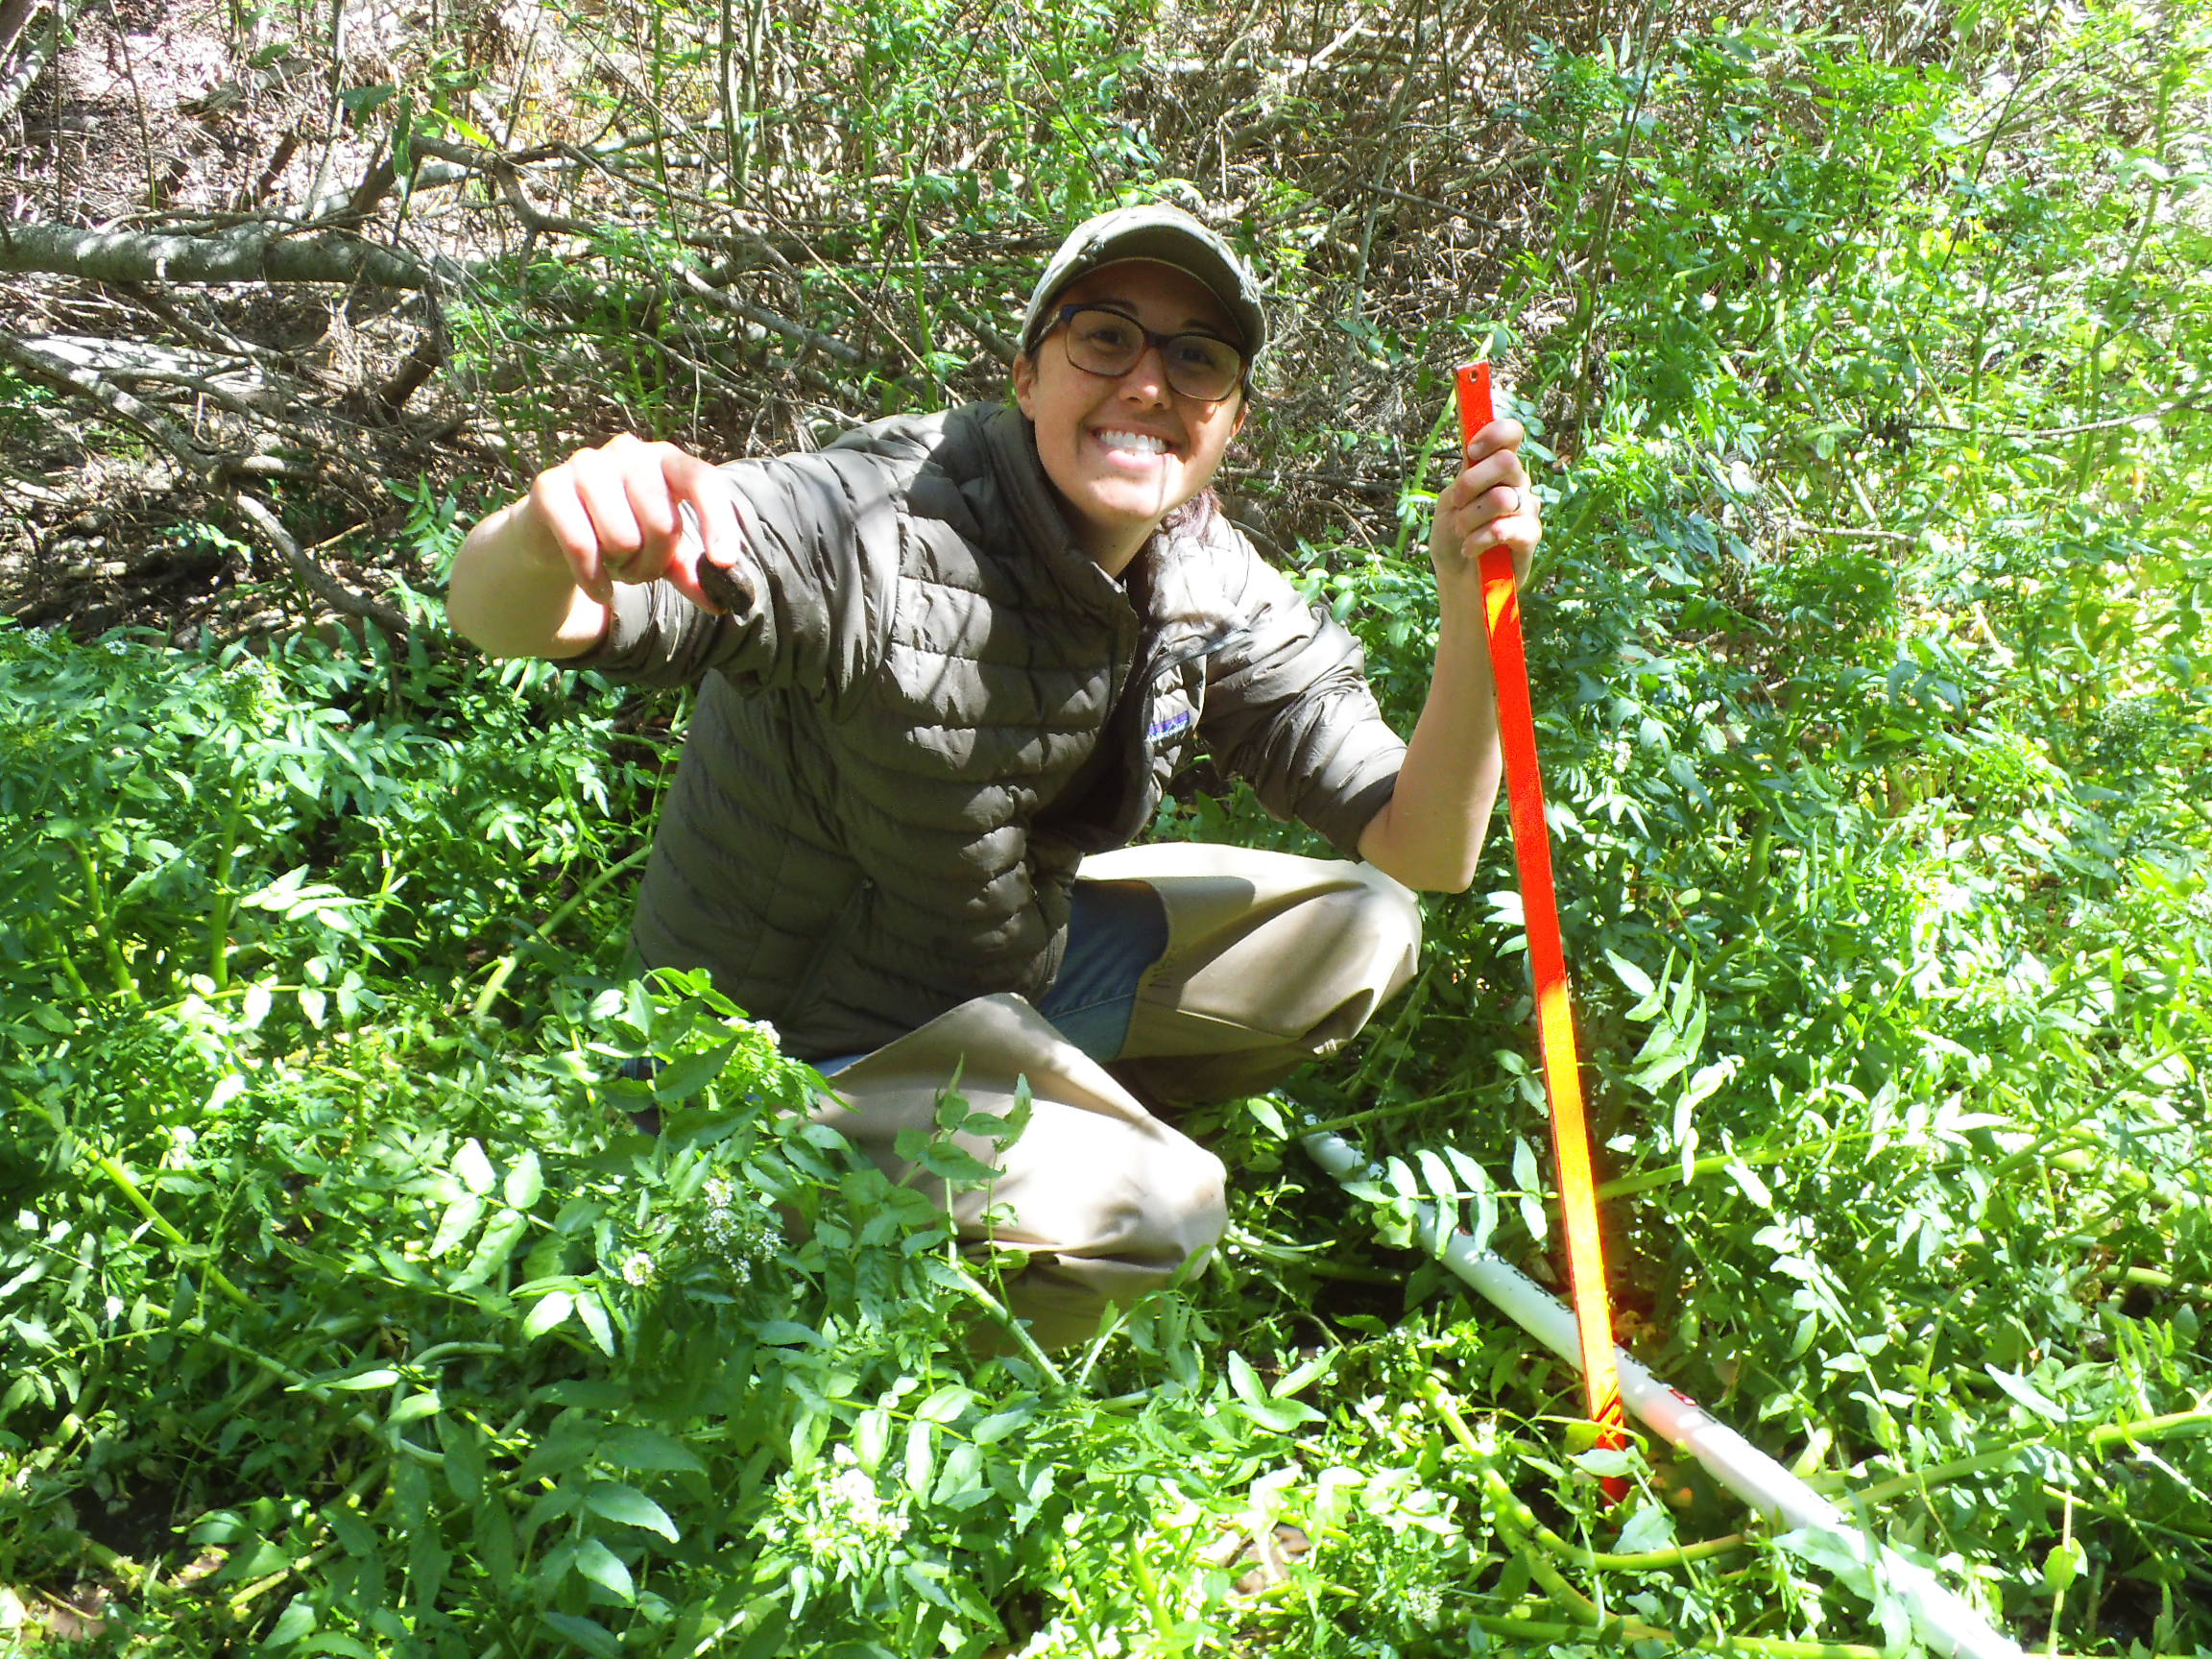
We collect measurements of the habitat such as water depth and the characteristics of the creek bottom, such as the size of the rocks and whether they are buried in sediment or sand. This data helps assess whether a creek is healthy habitat for fish and macros.
Collecting macros
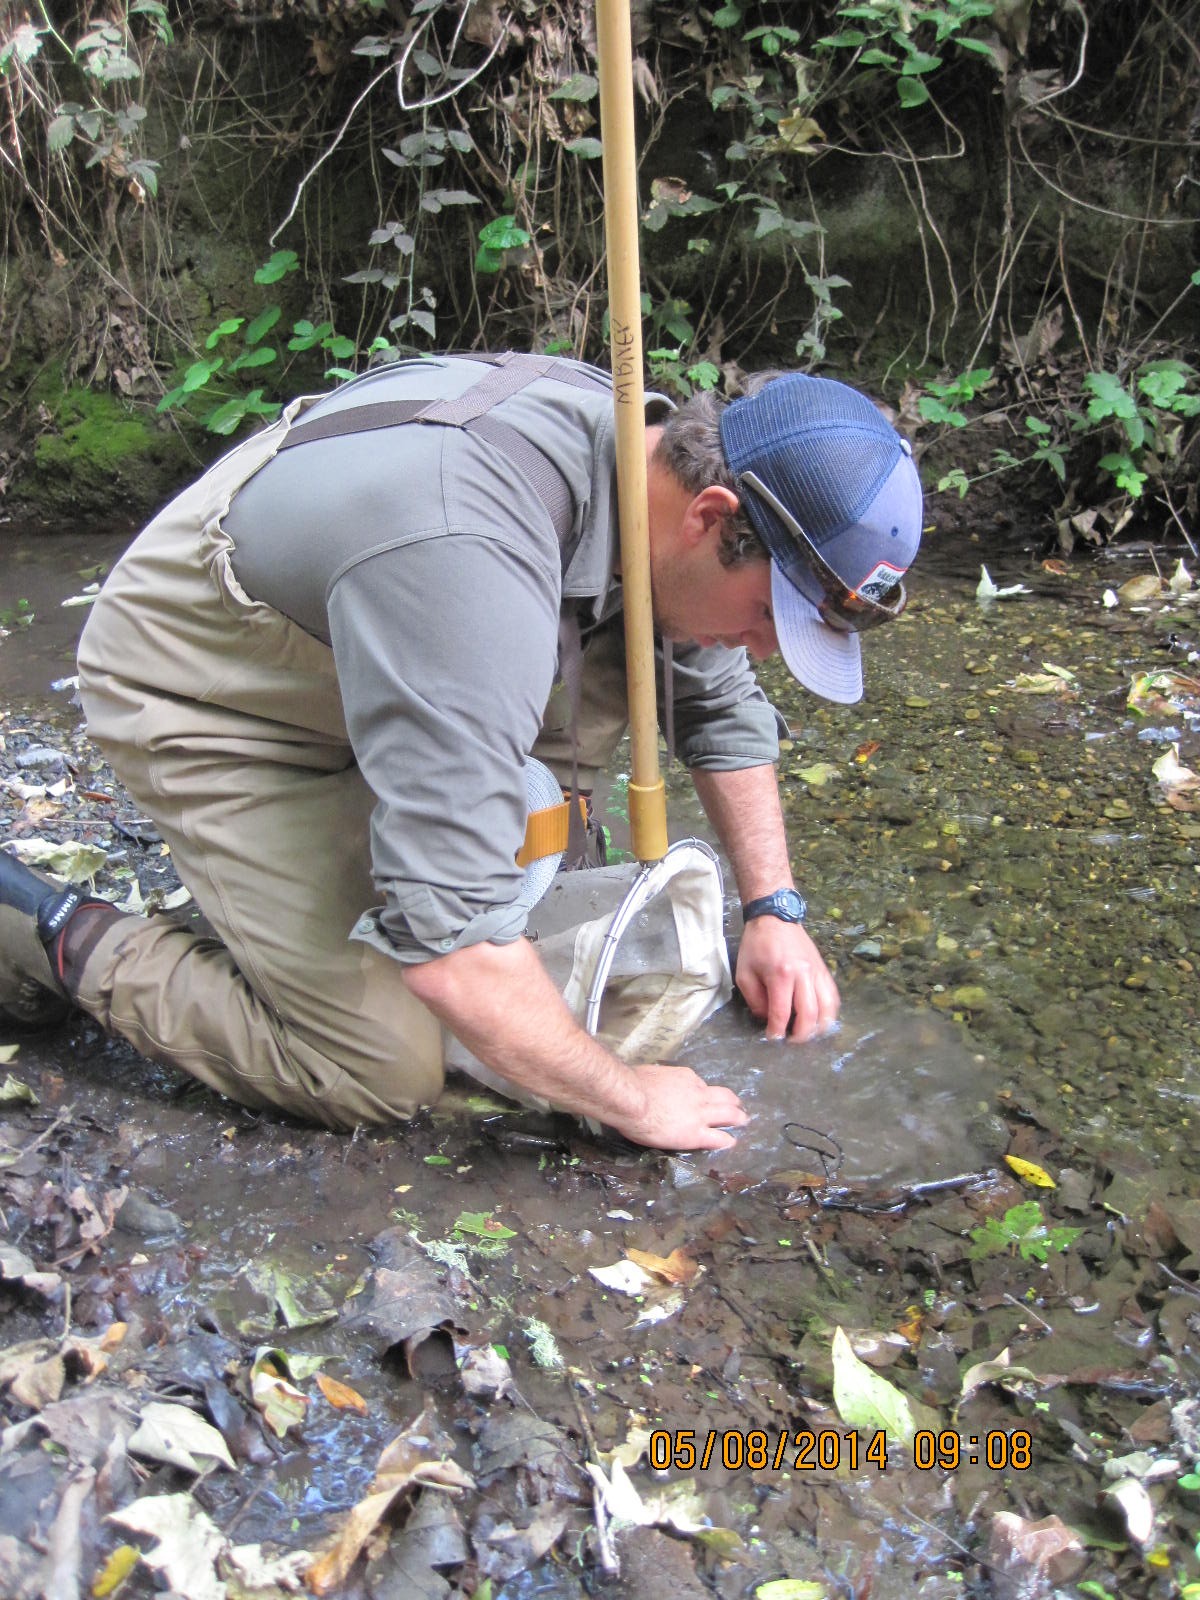
We place a net in the creek. We scrub rocks and stir up the creek bottom in a one-foot-square area in front of the net. The macros clinging to the rocks or hiding in the substrate are washed into the net. We repeat this process at ten points throughout a 150 meter section of the creek.
Preparing samples
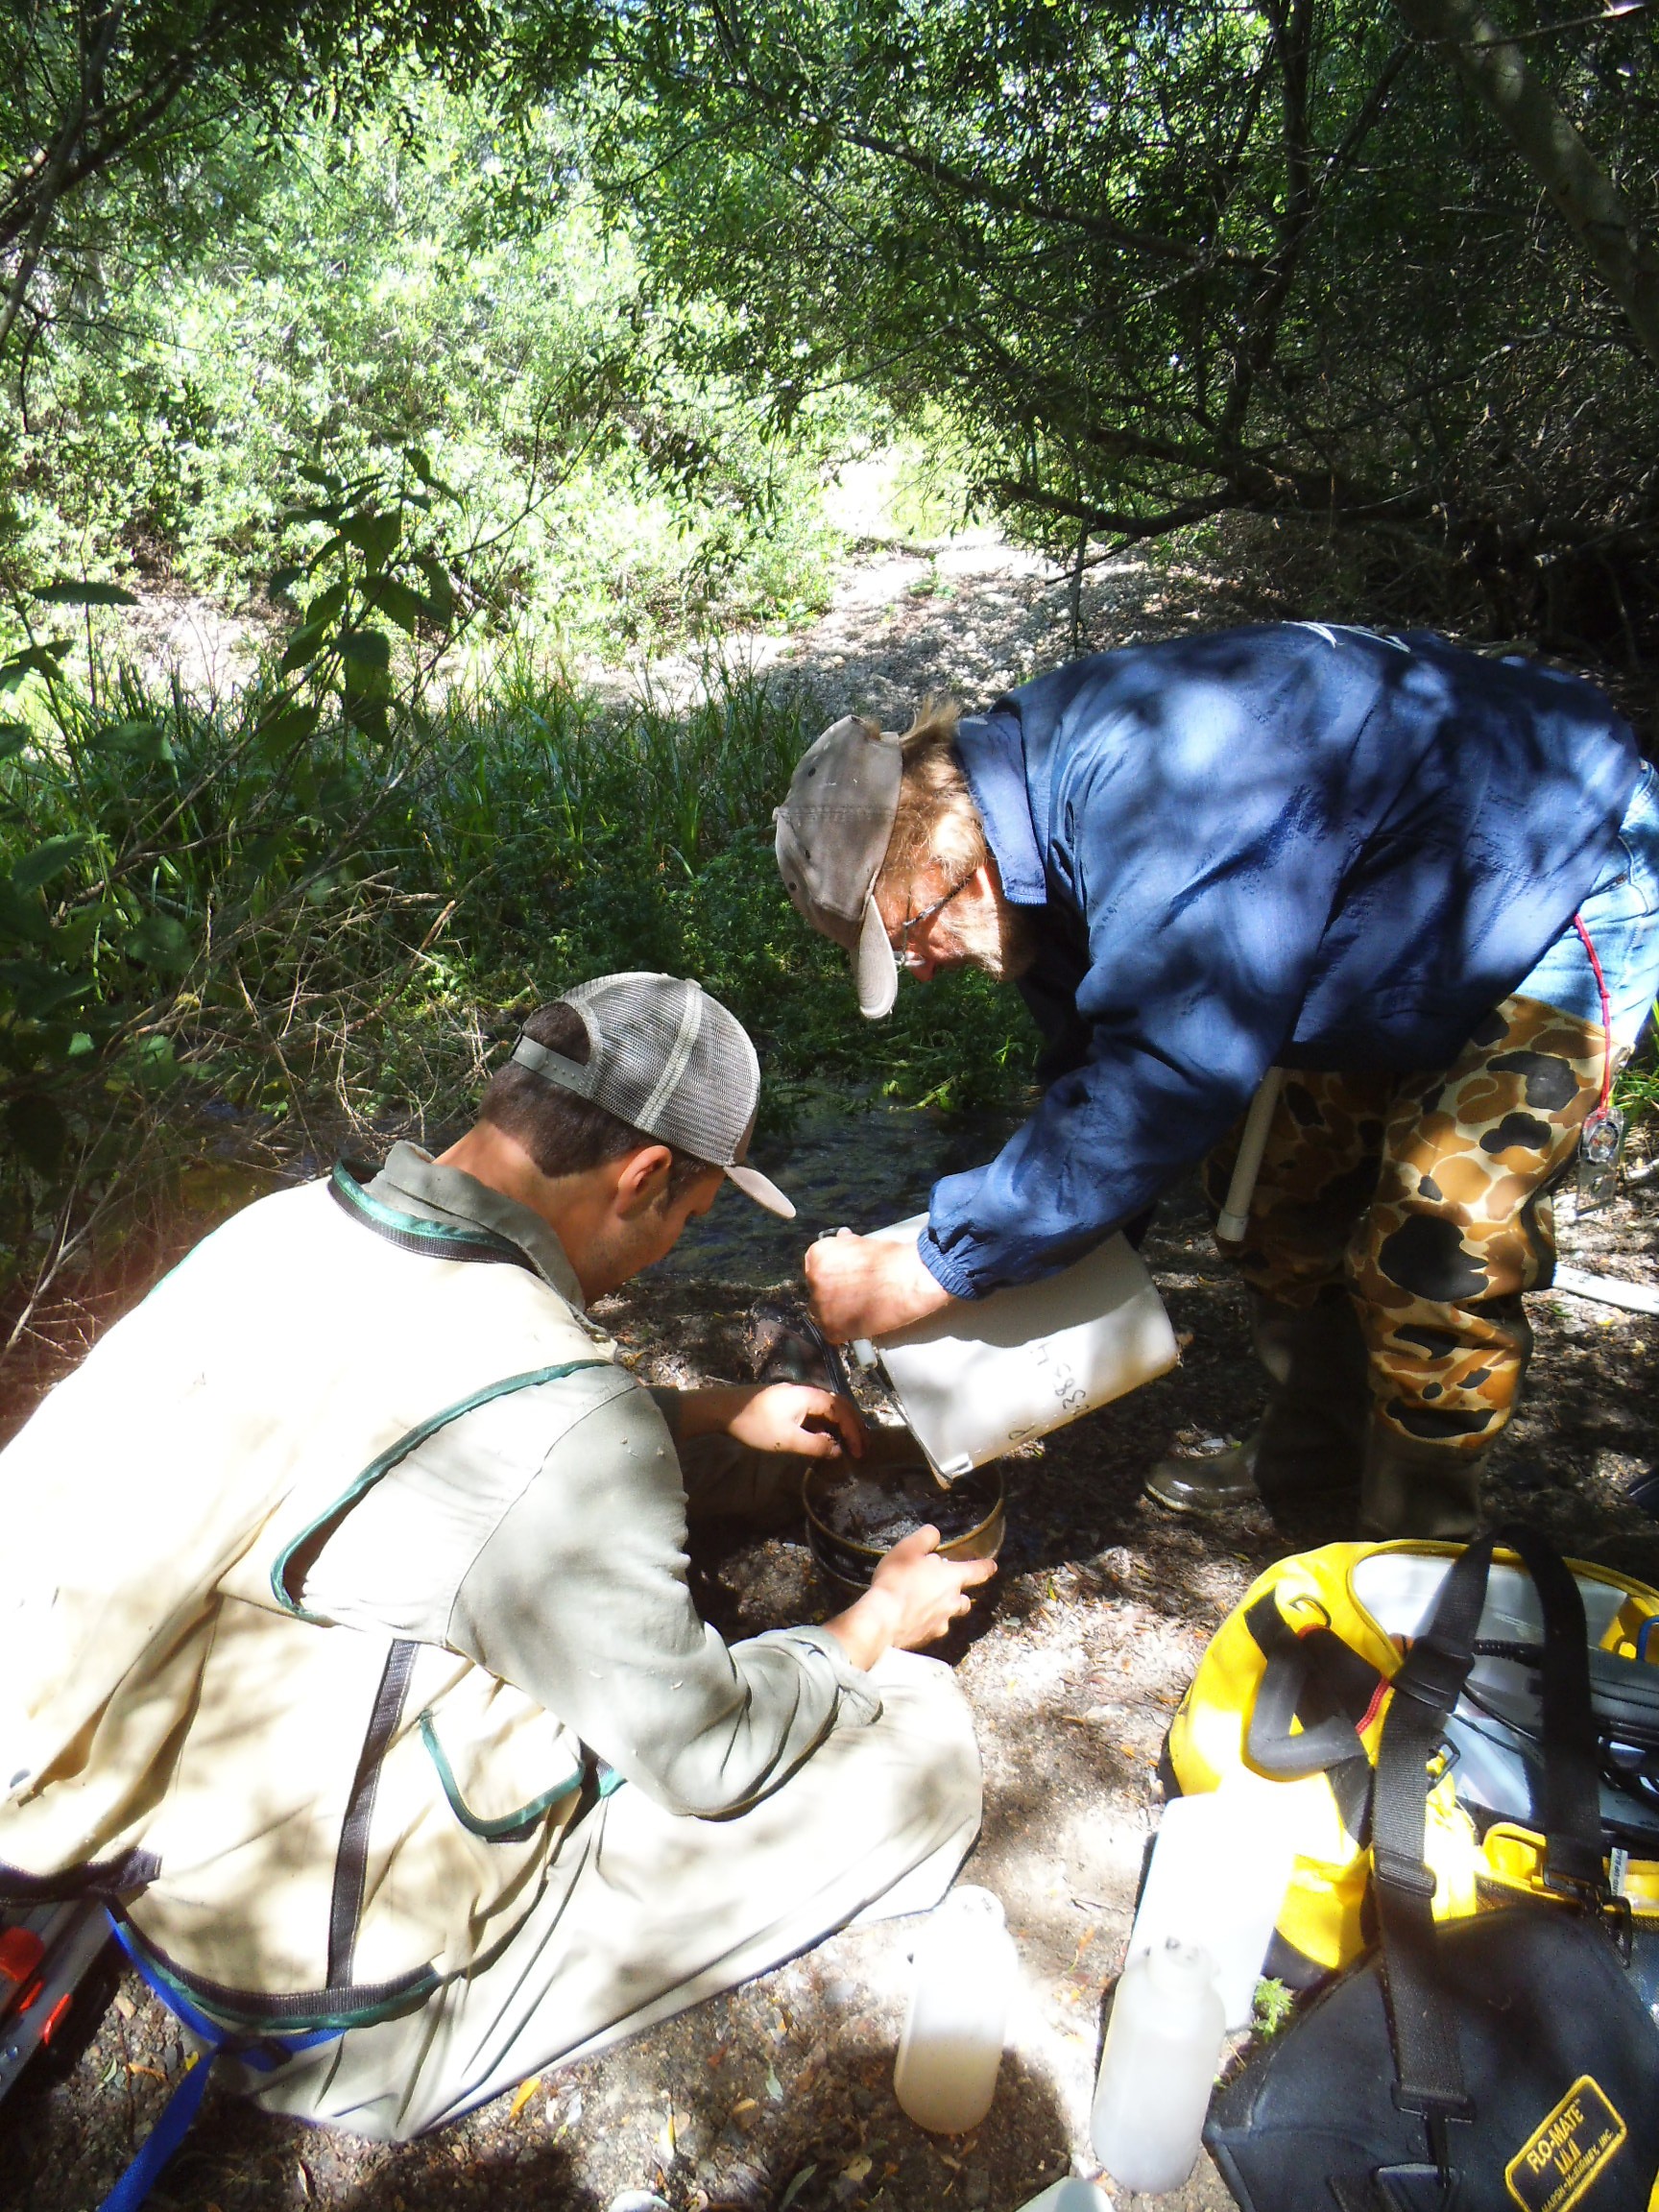
We transfer the contents of the net to a sieve. We rinse sticks and leaves to remove any macros clinging to them. The sample goes into a jar with alcohol preservative and is shipped to a lab for sorting and identification.
What do the bugs tell us?
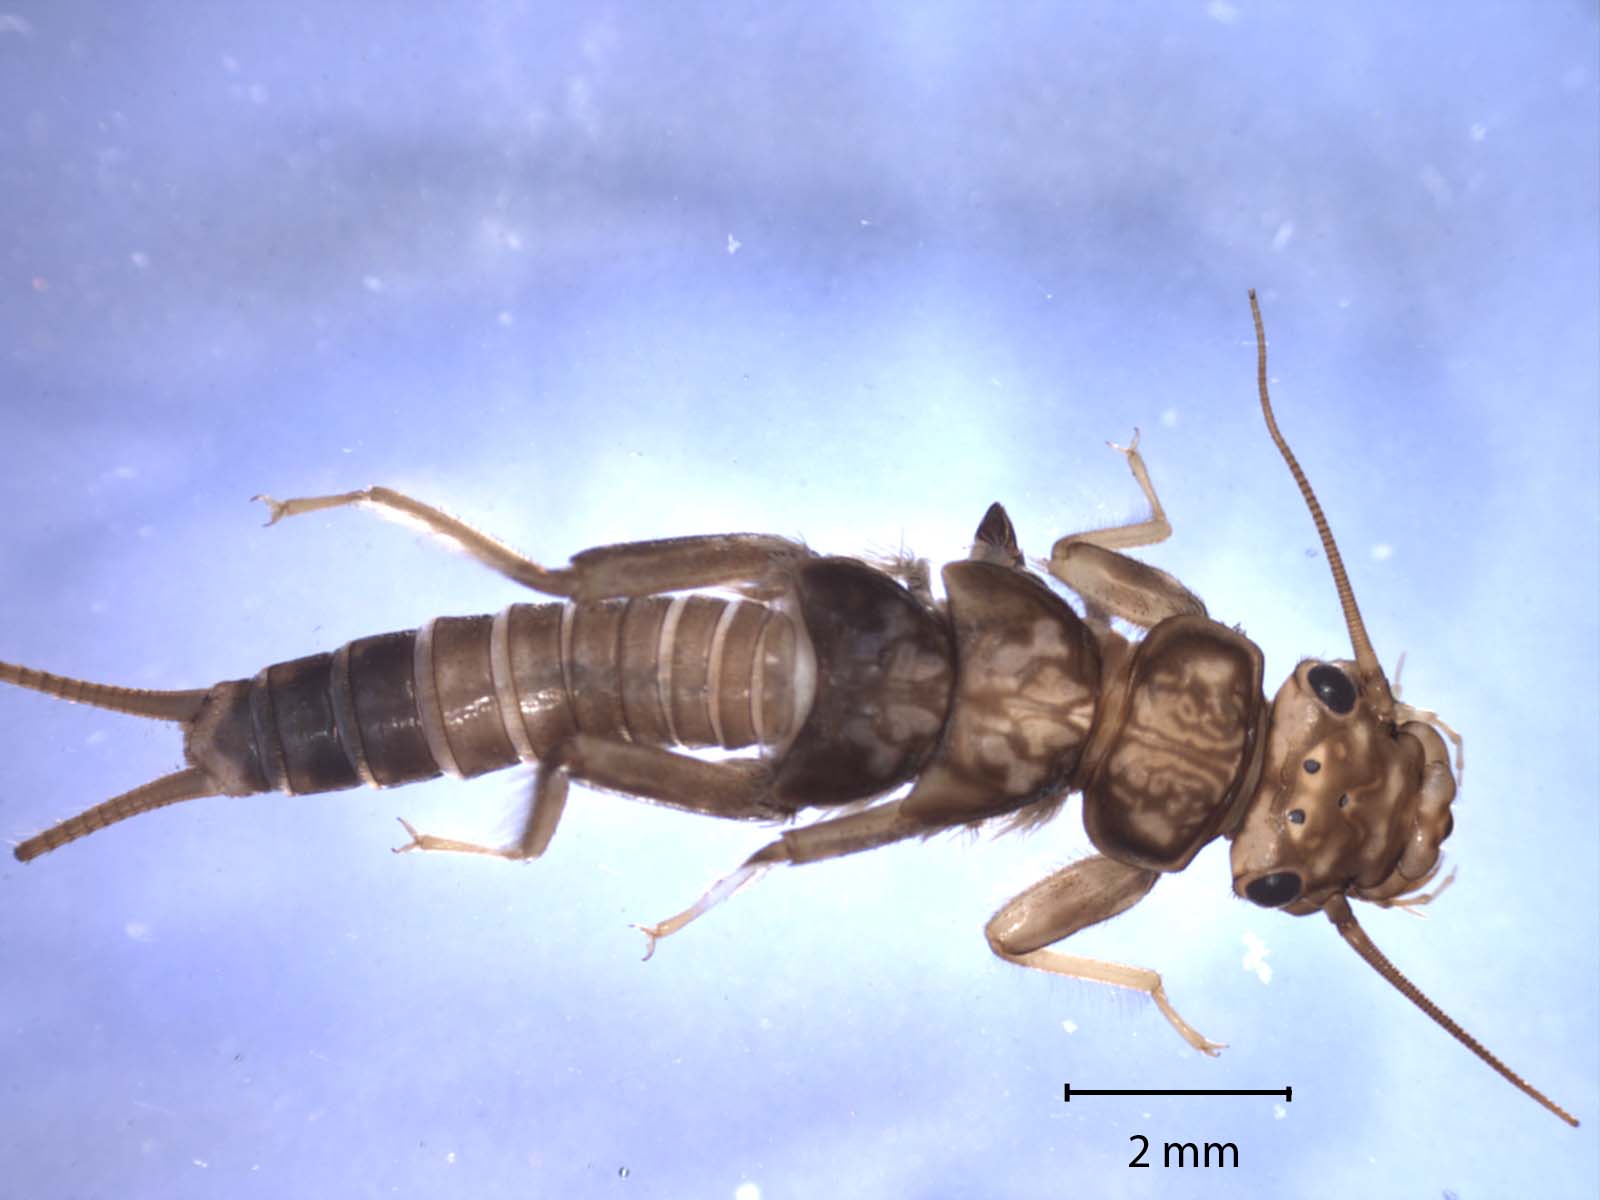
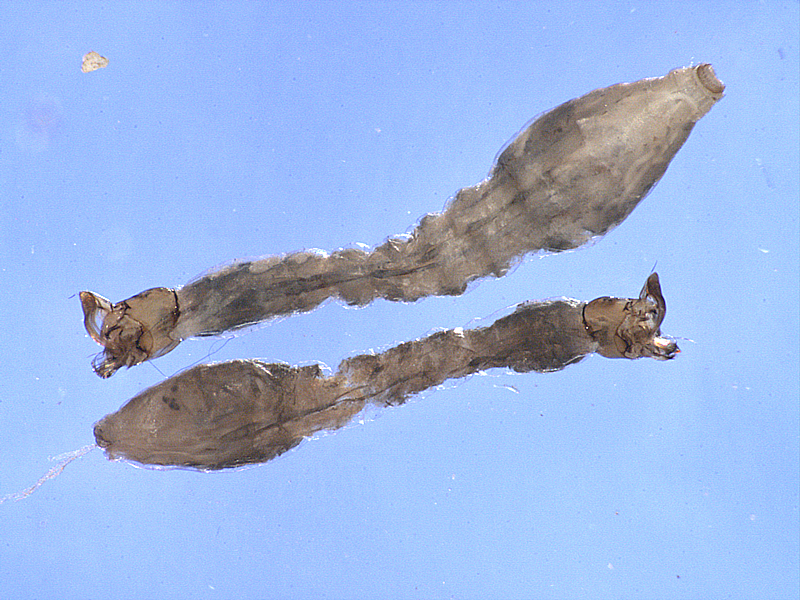
Some macros are very sensitive to pollution, so if you find them in a creek, you know the water quality is likely good. The stonefly pictured above on the left is sensitive to pollution and its presence in a creek indicates good water quality and habitat quality. Others, such as the black flies pictured on the right, are tolerant of pollution. So, if that’s all you find in a creek, you know that the water quality is likely poor.
What does the data show?
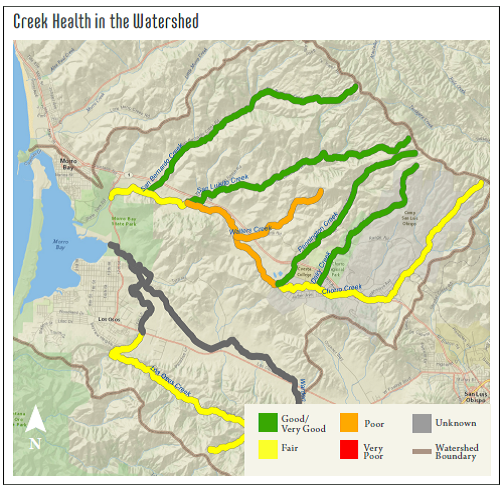
Based on the types of macros in our samples, the lab provides scores for each site. The map above shows the averaged scores from 2008 through 2012 for creeks throughout the watershed. Those coded green have high scores, which means these creeks have cold clear water with lots of oxygen and good habitat that supports healthy bug and fish populations. Those coded yellow and orange have fair and poor bug scores.
Join the team!
If you are interested in getting your feet wet and helping the monitoring effort this spring, join us for a hands-on field training session on Saturday, April 18, from 9 a.m. to noon. Our staff will teach you skills in macro sample collection, habitat measurements, and water quality monitoring.
Fieldwork is expected to take place in the last two weeks of April and the first week of May. Each monitoring trip takes about four hours, and dates will be offered both during the week and on weekends. We hope to see you there!