If you’ve spent any time on the bay, you’ve probably seen the long blades of eelgrass that are now abundant in our waters. This seagrass provides many benefits to the ecosystem, including reducing erosion, improving water quality, sequestering carbon, and providing habitat and a food source for wildlife.
The Estuary Program works with partners to study and monitor eelgrass. This research shows large changes in eelgrass abundance over the past 20 years. The reasons for the decline and rapid recovery are complex and likely include many factors such as changes in water quality and bay floor elevation.
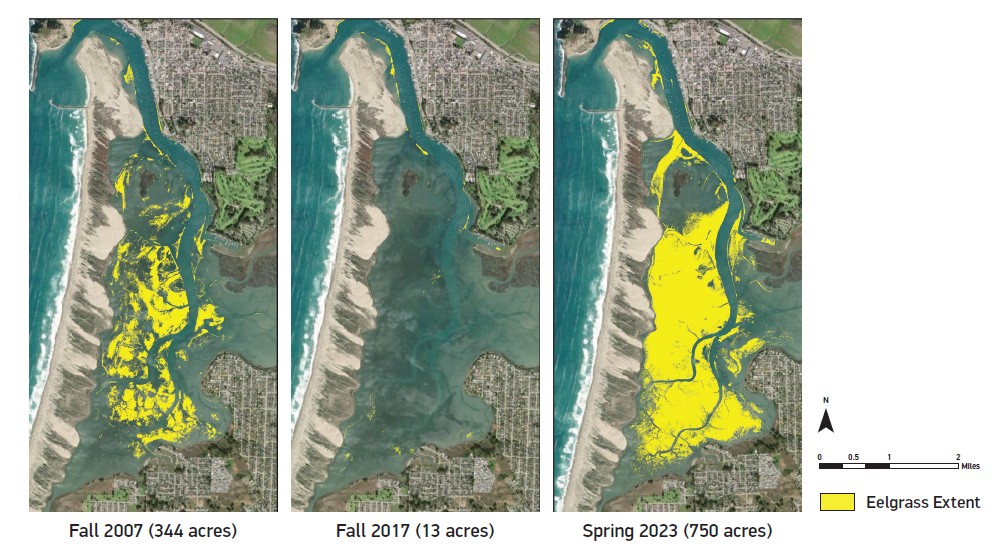
Eelgrass Acreage: 2007, 2017, and 2023
These maps illustrate the large swings in eelgrass acreage (shown in yellow) in Morro Bay. Eelgrass acreage declined from 344 acres in 2007 to only 13 acres in 2017. Eelgrass has been steadily increasing since then, with 750 acres mapped in 2023. We expect to see eelgrass acreage decrease again in the coming years, as 750 acres is likely above the carrying capacity within the estuary.
Tracking Morro Bay's Eelgrass Acreage
Estimating the total acreage of eelgrass in the estuary is challenging, and the mapping method has changed over time. Early surveys in the 1960s involved triangulation with a compass to create hand-drawn maps. Now, aerial imagery collection is the technique most commonly used. The 2023 eelgrass map indicating 750 acres of eelgrass was created with a combination of drone imagery to capture intertidal eelgrass and sonar data to map the deeper beds.
We use drones, such as the one above, to create a low cost and easily repeatable method of mapping. The task of annotating imagery has historically been conducted manually, which can take hundreds of hours. To automate this process, a team of Cal Poly and Stanford researchers created a machine learning network. The team was able to train the network to identify eelgrass in bay imagery in order to obtain reliable acreage estimates.
Bay Fish Populations Shift with Eelgrass Abundance
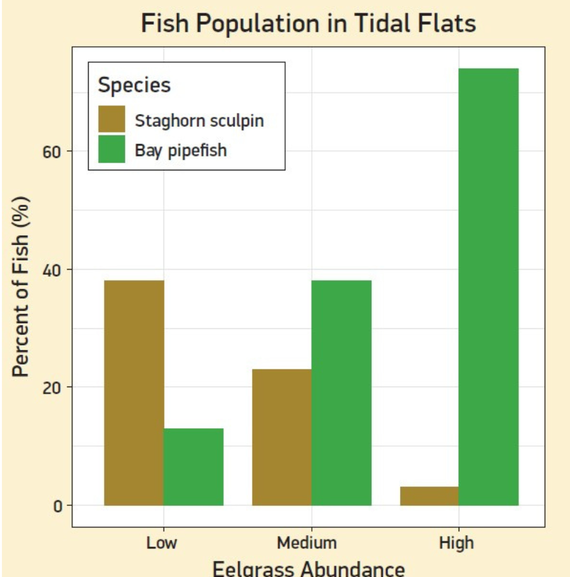
Morro Bay’s eelgrass beds provide essential habitat for many species of fish. Monitoring efforts have assessed fish communities at different stages of eelgrass abundance, illustrating how fish species respond to changes in habitat.
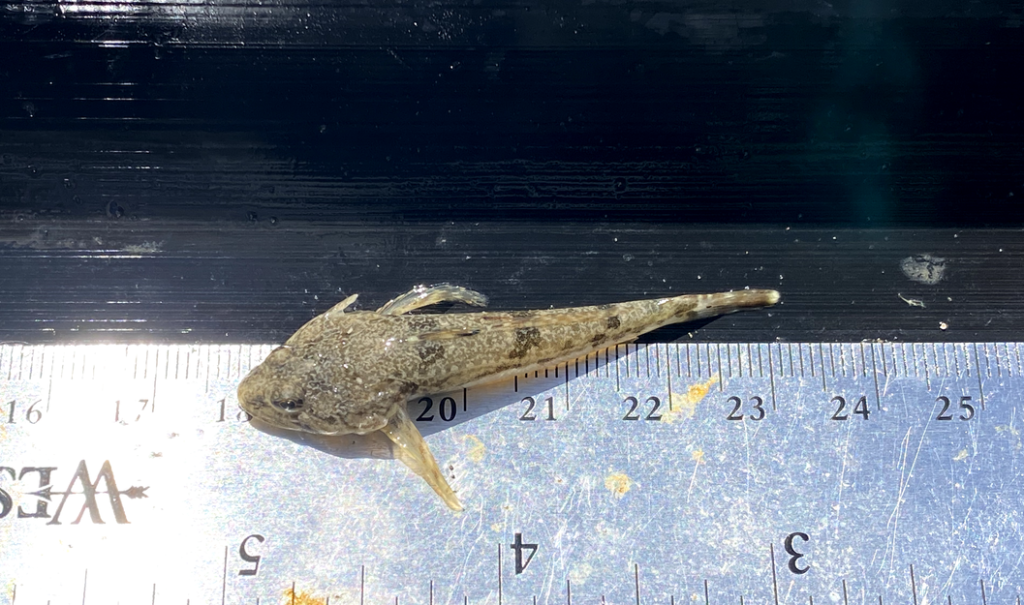
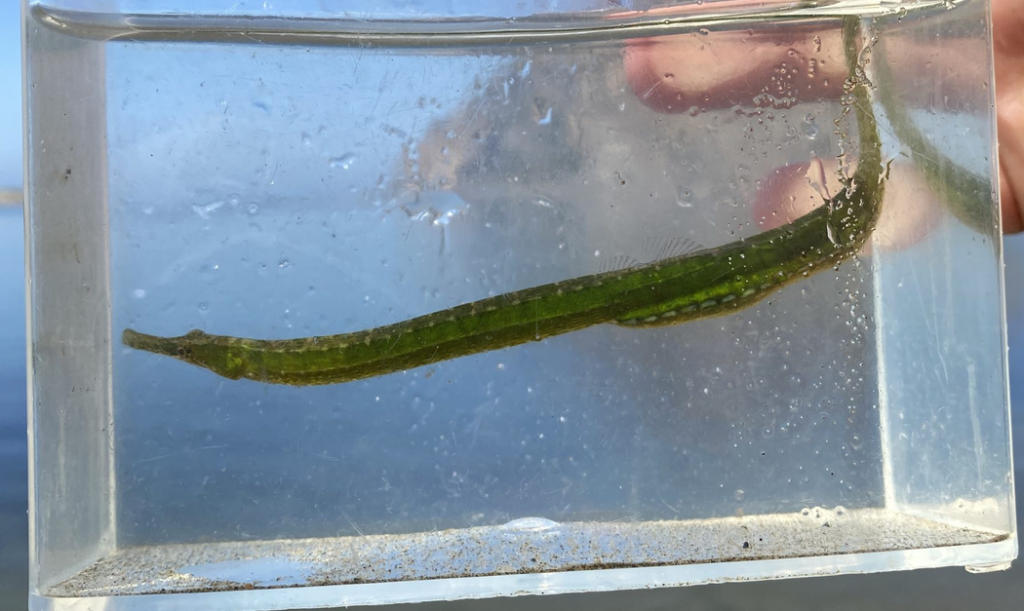
The graph shows the percent of two types of fish captured within tidal flats where eelgrass tends to grow. In times of low eelgrass abundance, species like staghorn sculpin (pictured left) that prefer bare mud and sand were dominant. In contrast, during times of high eelgrass abundance, species like bay pipefish (pictured right) that prefer eelgrass habitat were more prevalent.
For more information on our eelgrass research, scan the QR code below.