How will climate change likely affect the Morro Bay watershed and estuary?
Models continue to predict hotter, drier weather with more severe storms and drought as well as accelerating sea level rise.
Science-based models and real time observations show that our climate is changing, which can impact the severity and frequency of droughts, fires, and floods. Furthering our understanding of local climate change impacts and working with partners to develop adaptation strategies are important steps towards building resiliency.
Climate Change Causes Changes in Temperatures
Temperatures are expected to increase on a global and local scale. In Morro Bay, our maximum average temperature of 66.9 °F could increase to 75°F by the end of the century. Though this increase may not seem large, when combined with climate stressors like sea level rise, it could have significant impacts to ecosystems in the bay and watershed.
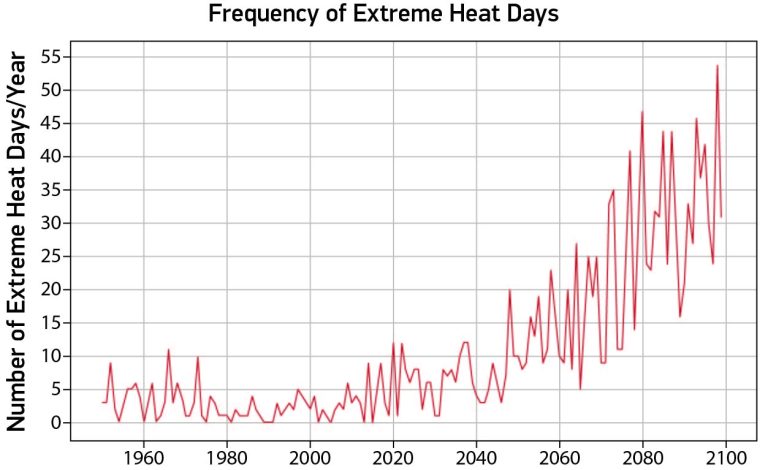
Frequency of Extreme Heat Days May Increase with Climate Change
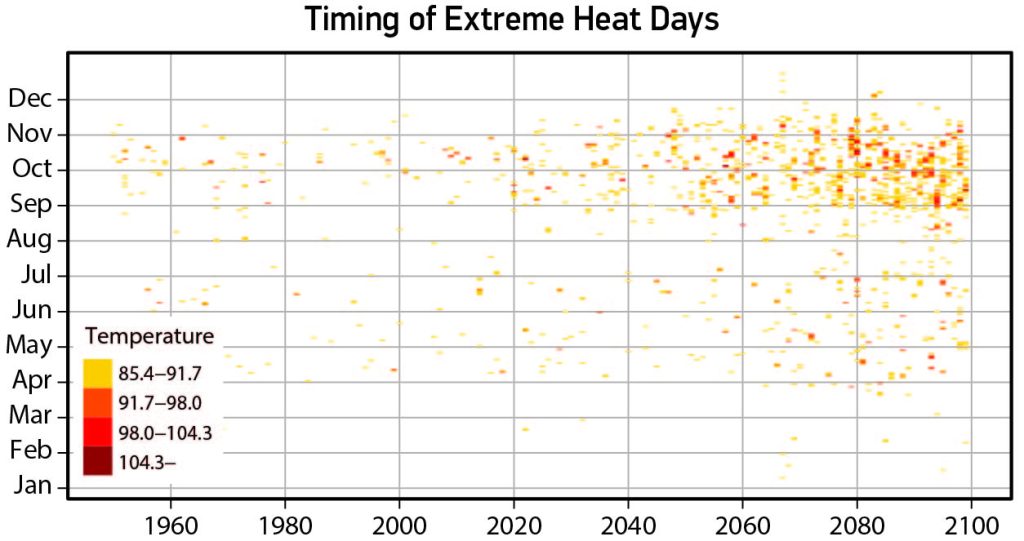
Timing Of Extreme Heat Days
The graph to the right shows in which months extreme heat days occurred each year over the past seventy years. These days tended to occur in the summer and early fall. The graph also shows when climate models forecast extreme heat days to fall from now until the end of the century. We are likely to experience more of these extreme heat days throughout the year, and they are likely to be hotter than they were historically.
The Causes and Effects of Sea Level Rise
Globally, mean sea level has risen between 8 and 9 inches since 1880. The two main drivers of this change are melting ice sheets and thermal expansion of seawater, both of which are made worse by excess carbon emissions. The exact rate at which the ocean level changes at a particular location depends on local factors such as erosion, ground settling, and the effects of regional ocean currents.
The impact of sea level rise will be felt by humans and wildlife alike. Even if the rate of encroachment is slow, its effects on infrastructure and coastal communities are projected to be expensive. And even if it is not immediately dangerous, the rate of “nuisance flooding” has been on the rise across the world and can be incredibly disruptive. Rising seas also mean saltwater encroachment into freshwater creeks and groundwater aquifers, which can impact wildlife and contaminate municipal water supplies.
Historic Sea Level Rise
Observations from local NOAA sensors and monitoring equipment help track sea-level change in the region. Current projections place the yearly rate of sea level rise in Port San Luis at just under 1 mm/year, however, even under low carbon emission scenarios, this rate is expected to increase to over 4 mm/year by 2100.
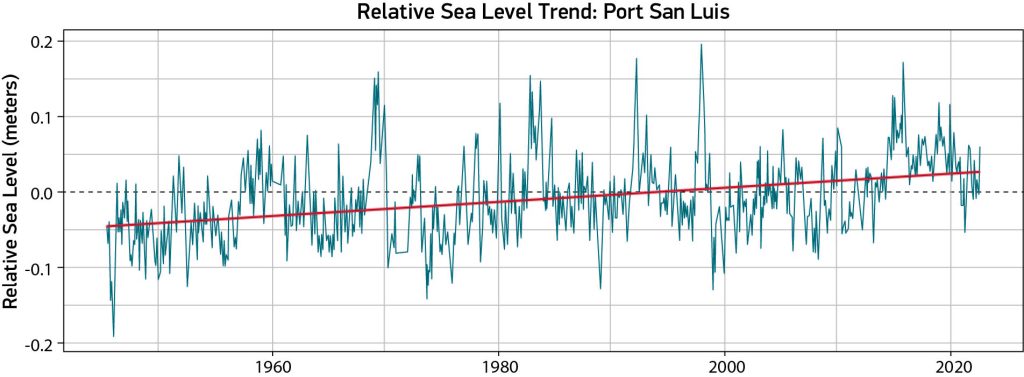
NOAA sensors in Port San Luis track sea levels. While the level increases in some years and dips down in others, the data indicates a relative increasing sea level trend (represented by the red line) of 0.97 mm/year, which is equivalent to 0.32 feet of rise over the last 100 years. The rate of sea level rise is also likely to accelerate, with estimates indicating sea levels up to an additional meter higher by the end of the century.
Projected Future Sea Level Rise
To better understand and plan for rising seas, the United States Geological Survey (USGS) developed a model called the Coastal Storm Modeling System (CoSMoS) that projects coastal flooding for different amounts of sea level rise coupled with runoff from storm events. CoSMoS uses wind and barometric pressure from climate models to predict how the effects of storms and flooding change along with climate shifts.
Guidance from California state indicates that sea level rise in our region is likely to be between 0.3 m and 1 m by the end of the century. These zoomed in views of water inundating some well-known areas around Morro Bay illustrate the potential effects of a one-meter rise.
These following maps show which areas the CoSMoS model predicts will be inundated given one meter of sea level rise (pictured in blue). The orange areas represent further flooding when sea level rise is coupled with a 20-year storm event, which is a storm so large that it has only a one-in-twenty chance of occurring in a given year.
Whether sea level rise falls short or exceeds the current predictions, we still have a chance to mitigate it by reducing carbon emissions and adapting to changing conditions by improving the coastal resiliency of our communities. Strategies such as wetland restoration, effective groundwater management, and the use of natural infrastructure for shoreline protection can bolster coastal neighborhoods and habitats against the rising sea.
Climate Impacts on Water Quality
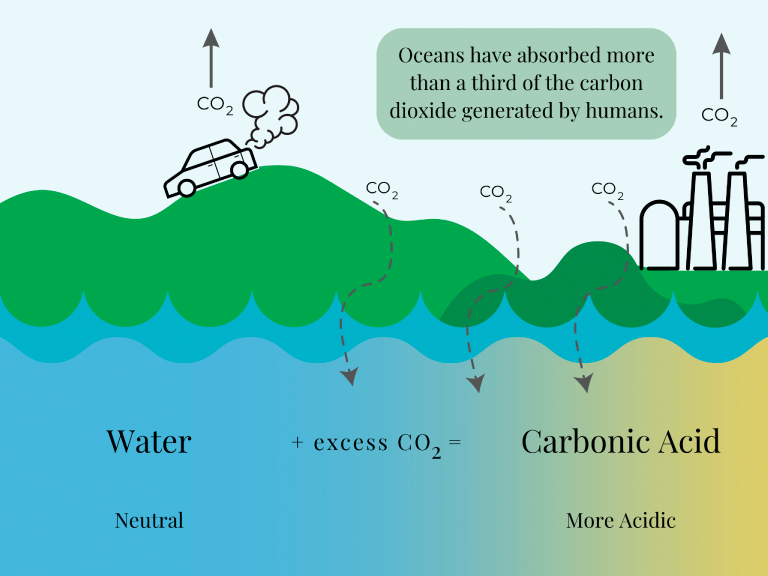
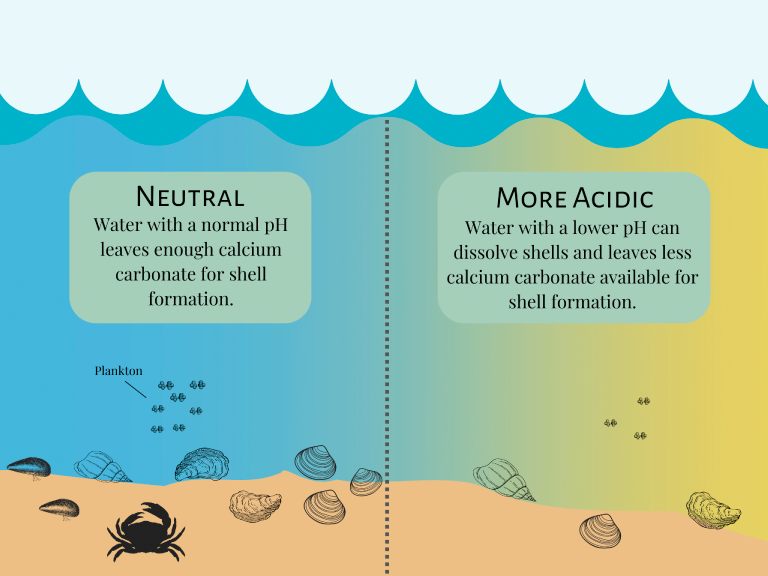
Ocean acidification (OA) due to climate change is a global issue that can impact water quality and habitat conditions for shelled creatures. Research is essential to understanding the local impacts of OA to estuary habitats, plants, and wildlife.
What is ocean acidification?
How does ocean acidification impact shelled creatures?
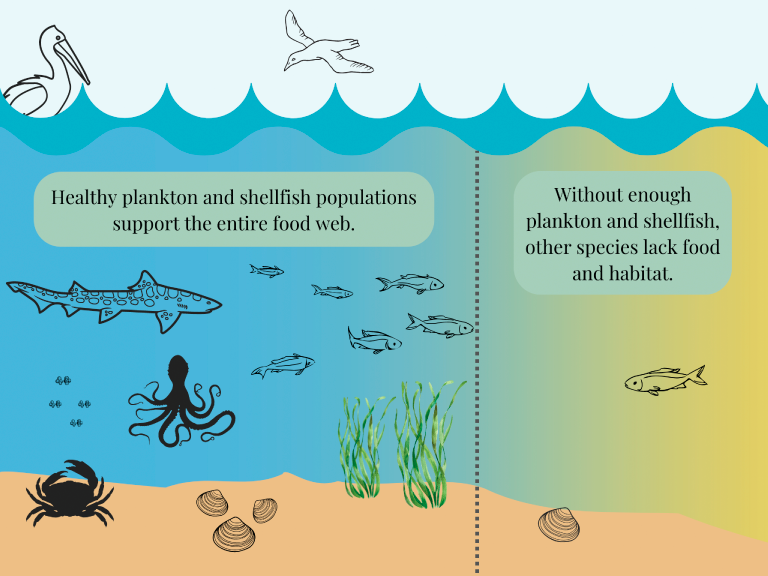
How does ocean acidification affect the food web?
OA Research In Our Bay
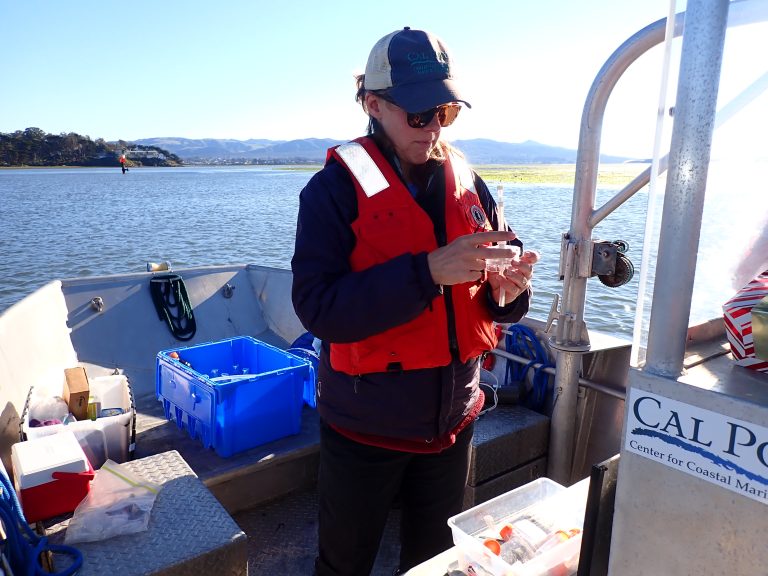
Dr. Emily Bockmon of Cal Poly’s Chemistry Department collects water samples to analyze their nutrient and carbonate chemistry, indicators of ocean acidification. This research project involved analyzing samples from the bay mouth to the back bay to see how the influx of ocean water and the presence of eelgrass impact water quality. Photo courtesy of Cal Poly.
OA Impacts in Our Bay

Increasingly acidic conditions in our bay could greatly impact our two commercial oyster farms, as well as bay wildlife. Photo courtesy of Morro Bay Oyster Company and Christa Renee.
Data Notes
Sea Level Rise Projections for California, State of California Sea Level Rise Guidance (2018 Update): State of California Sea-Level Rise Guidance
Measuring Sea Level and Future Sea Level Rise, NOAA Climate: Climate Change: Global Sea Level | NOAA Climate.gov
CoSMoS model technical documentation: JMSE | Free Full-Text | Projected 21st Century Coastal Flooding in the Southern California Bight. Part 1: Development of the Third Generation CoSMoS Model (mdpi.com)
Port San Luis Relative Sea Level Trend, NOAA station 9412110: Sea Level Trends – NOAA Tides & Currents
Cal-Adapt Extreme Heat Day model using the HadGEM2-ES climate model (warmer/drier) and the RCP 8.5 emission scenario (assumes emissions continue to rise throughout the 21st century): Extreme Heat Days & Warm Nights (cal-adapt.org)
Ocean acidification graphics were adapted from diagrams created by The Nature Conservancy in Washington.