Morro Bay is a jewel of the Central Coast, attracting residents and visitors for sailing, paddling, and swimming. These activities are a big part of what makes the bay special, but they can only be enjoyed safely when the water is clean. Pollutants like bacteria, viruses, and protozoa can cause illnesses in people and wildlife. Potential sources of these pollutants are pets, stormwater runoff, wildlife, wastewater spills, or boat waste holding tanks that are not properly maintained.
For nearly 20 years, Estuary Program staff and volunteers have ventured out to the bay each month to monitor for indicator bacteria, which are microorganisms that indicate whether fecal contamination may be present. This long-term record helps us track trends in water quality and potential impacts on bay uses such as recreation and shellfish farming.
How We Monitor Bacteria
The Estuary Program and its volunteers have monitored bacteria in Morro Bay and the watershed creeks that drain into it for nearly 20 years. We began a collaboration on the bacteria monitoring effort in 2022 with Drs. Laurie McConnico and Silvio Favoreto of Cuesta College. Cuesta students participate in semester-long fellowships to collect and analyze bacteria samples from a series of creek and bay shoreline sites.
Each month, volunteers use sterile techniques to collect water samples from bay and creek sites for analysis.
Students then bring the samples to Cuesta’s lab for processing. They add a chemical indicator to the water sample and seal them into trays. The trays are incubated overnight, allowing the bacteria to grow and trigger the chemical indicator.
Students return to the lab the following day to interpret the results. When the water samples contain bacteria, the chemical indicator causes the water to fluoresce. The trays pictured above are designed so that the number of individual wells with fluorescence indicate the concentration of bacteria in the sample. Trays with low numbers of fluorescent wells (left) have low concentrations of bacteria, and trays with many fluorescent wells (right) have higher bacteria concentrations. The final results are shared with partners such as landowners, agencies, and public health officials.
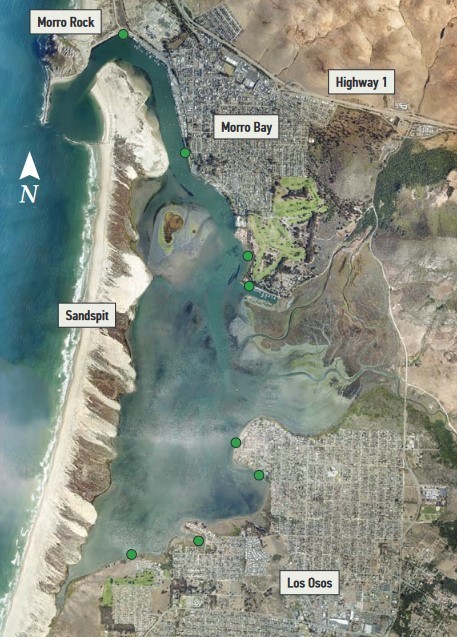
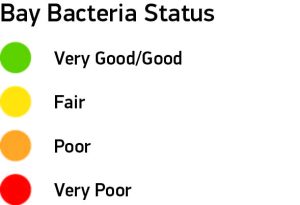
Bay Bacteria Status
This map shows the eight sites where the Estuary Program has monitored water quality monthly from 2005 through 2024. The green color of the circles indicates that bacteria levels are low and that these sites are typically safe for swimming. However, runoff from a storm can carry pollutants including bacteria into the bay, so public health officials typically recommend staying out of the water for 72 hours following a storm.
To see the data used to create this map, visit our data dashboard.
Other Local Bacteria Data
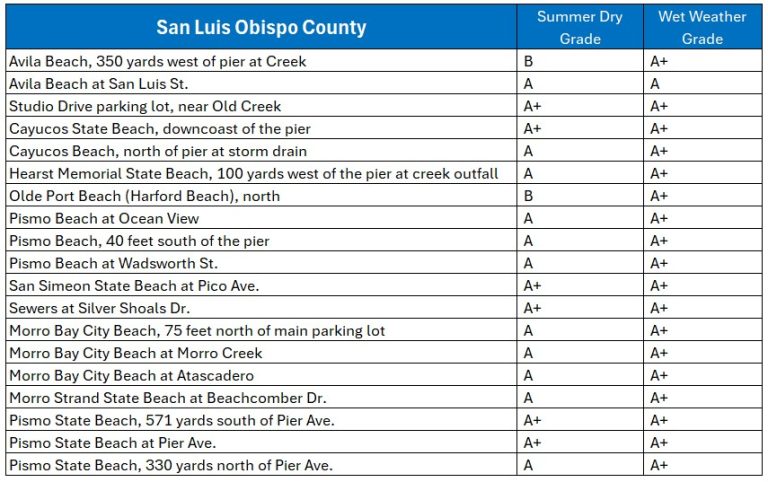
Another source of local bacteria data is Heal the Bay, an environmental nonprofit dedicated to making the Southern California coastal waters and watersheds safe, healthy, and clean. Each year, Heal the Bay compiles a Beach Report Card that assigns an A to F letter grade to five hundred California beaches using weekly bacteria results. The results are compiled from monitoring data collected by government agencies. Higher grades indicate a lower risk of illness to beachgoers.
The following table shows the grades for San Luis Obispo County beaches for 2024 to 2025. In the table below, results are separated into two categories. Data collected between April and October are assigned to the Summer Dry season, when beach usage tends to be higher. The Wet Weather data includes samples taken throughout the year within three days of a rain event greater than 0.1 inches. These events are particularly important, because stormwater runoff can transport pollutants such as bacteria into our coastal waters, impacting our beaches. In 2024 to 2025, SLO County beaches received very high grades.
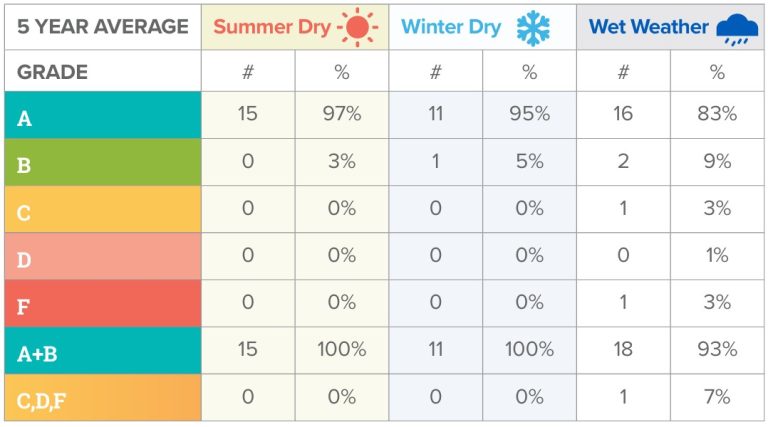
Heal the Bay also released a table summarizing the past five years of monitoring results from sites within SLO County. This table includes the Summer Dry and Wet Weather categories, along with results collected between November and March that are not included in the Wet Weather Grade. Both the Summer Dry and Winter Dry grades have consistently scored an A or B, while 93% of Wet Weather grades have scored in this higher range.
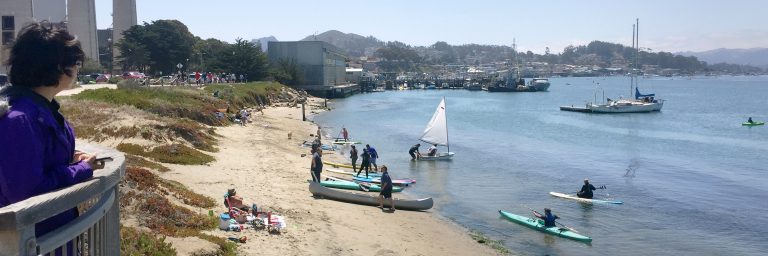
Visitors come to Coleman Beach to enjoy Morro Bay while relaxing on the sand or venturing into the water.
In 2023, the Estuary Program began tracking recreational use at eight popular coastal-access sites on the bay using a survey method developed by the Environmental Protection Agency (EPA). Cal Poly students and community volunteers conducted several four-hour surveys at each site to track the time visitors spent and the main recreational activities they engaged in. The data from these surveys were used to build a profile of site visitation over the course of a typical day. By reasonably assuming that the flow of arrivals and departures throughout the day has a regular pattern, we can use this profile to estimate total visitation for a given day by counting the people or cars present at a single point in time.
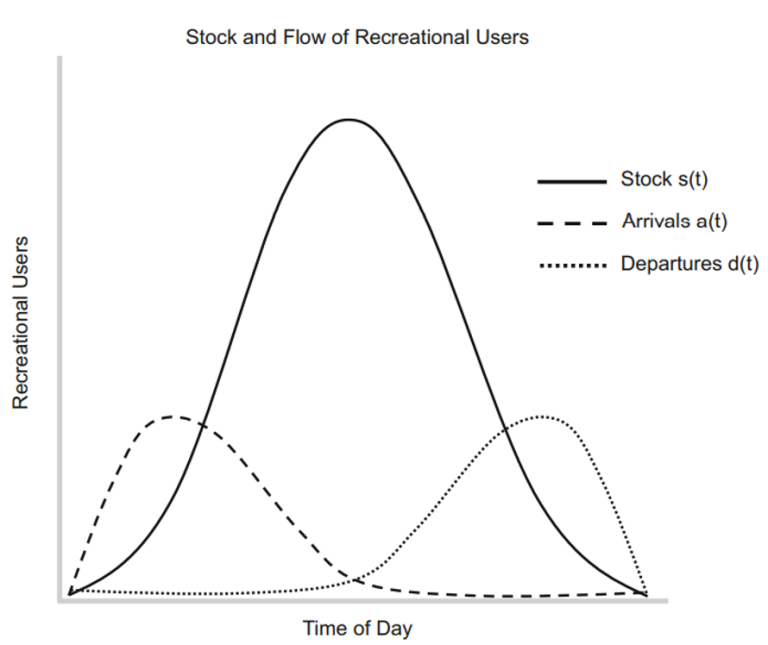
A hypothetical “stock curve” of site visitation (solid line) representing the number of people at a site throughout a typical day. This curve is based on the difference between the cumulative number of arrivals (dashed line) and departures (dotted line). Figure courtesy of EPA (Mulvaney et al. 2020).
Now that the four-hour surveys are complete, volunteers are collecting car counts from each site several times per month, which are then converted into daily visitation estimates. We’ve found that sites with access to docks where visitors can launch personal watercraft, such as State Park Marina and the Tidelands Park boat launch, have the highest visitation. Smaller beach sites, commonly used by joggers or people walking their pets, typically receive a third of the visitation seen at our dock-based sites.
Understanding how sites are utilized for recreation can aid in the estimation of their economic value and conducting frequent surveys allows us to track how bay use changes over time. When paired with water quality and site condition data, this information can indicate how people’s use of the bay shifts with changing site quality and can help us prioritize restoration for popular access sites.
Data Notes
The map includes enterococcus data collected and analyzed by Estuary Program volunteers from 2005 through 2024 using the IDEXX method. The scoring, status, and trends were based on the Water Board’s method (see water quality section above for reference). The trend was determined by assessing data before and after January 1, 2014 for comparison. The recreational use monitoring effort follows methods developed by the EPA’s Office of Research and Development. Data collected during four-hour continuous surveys aids in the development of visitation curves, from which daily visitation can be extrapolated by counting the number of parked cars at each site.
Mazzotta, M., Merrill, N., Mulvaney, K., Atkinson, S., Sawyer, J., Dalton, T. 2021. How to Quantify Recreation in an Estuary: Methods for estimating the number of participants and value of recreation for coastal access points. U.S. Environmental Protection Agency.
Mulvaney, K. K., Atkinson, S. F., Merrill, N. H., Twichell, J. H., Mazzotta, M. J. 2020. Quantifying Recreational Use of an Estuary: A Case Study of Three Bays, Cape Cod USA. Estuaries and Coasts. https://doi.org/10.1007/s12237-019-00645-8