Is water in the creeks and bay clean enough for fish and aquatic life?
Some areas are healthy and others are degraded.
Fish and aquatic life require clean waters that have adequate oxygen and are free of pollutants. To better understand whether the waters of the bay and creeks support the most sensitive wildlife, Estuary Program staff and volunteers conduct ongoing monitoring of oxygen levels, nitrate pollution, and creek health indicators.
Bay Oxygen Status
The waters of the Morro Bay estuary are home to fish, invertebrates, and other types of aquatic life, many of which require oxygen to thrive. To better understand the health of the bay, Estuary Program volunteers kayak out in the early morning hours to measure the lowest oxygen levels of the day at seven bay sites.
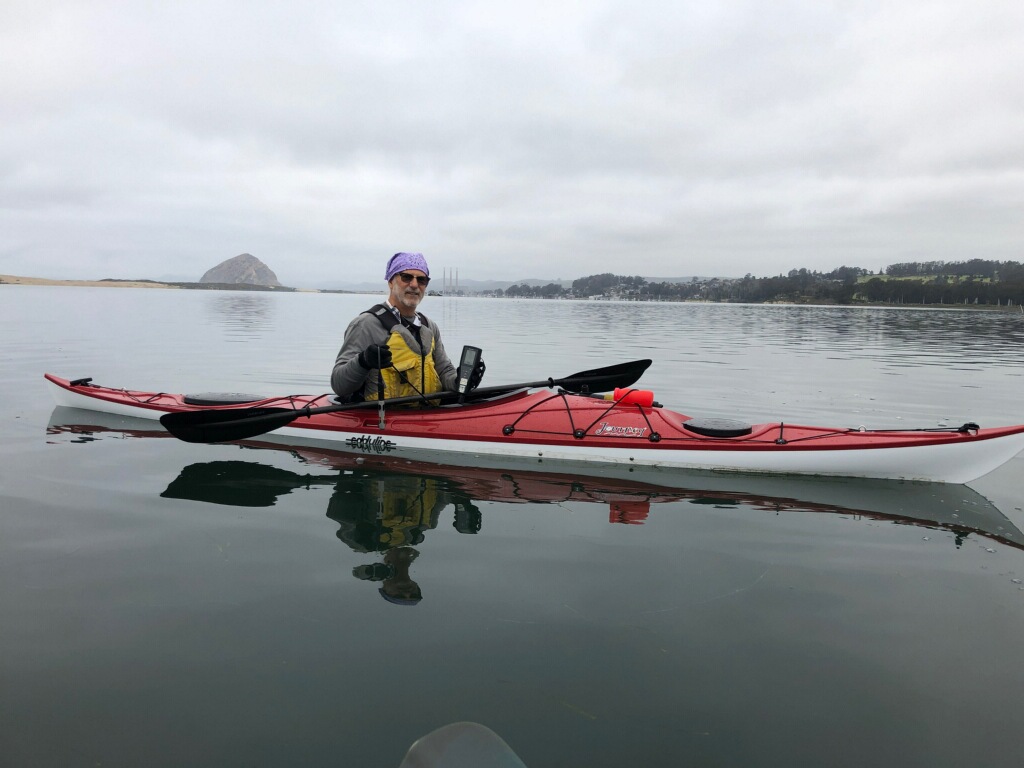
This monitoring effort has been conducted for over 20 years, and the data consistently shows a trend of decreasing oxygen as you move from the front bay to the back bay. The deeper waters of the front bay easily mix with the cold, well-oxygenated water pushed in from the ocean by incoming tides. Conversely in the back bay, the shallow waters limit tidal mixing, leading to lower oxygen levels. Although lower than ideal, baywide oxygen levels have remained relatively stable over time. While conditions remain Very Poor at the furthest back bay sites, data indicate significant improvements in oxygen levels at the Sharks Inlet and Cuesta Inlet sites.
To view the data used to create this map, visit our data dashboard.
Ocean Observing Sensors in Morro Bay
The Central and Northern California Ocean Observing System (CeNCOOS) is part of a national network of observing systems to collect important water quality data from our coastal and Great Lakes areas. The data from this NOAA program are crucial for weather forecasting, emergency response, fishing and aquaculture industries, conservation, and science and research efforts. In partnership with Cal Poly researchers, the Estuary Program helps support two sensor stations in Morro Bay.
Data collected by these sensor stations are available in in near real time for use by community members and scientists via data dashboards for the front bay water quality parameters, back bay water quality, and back bay weather station. The data continue to inform research efforts by scientists at Cal Poly and across the state related to ocean acidification, eelgrass population dynamics, bay circulation and water quality, aquaculture, and sea level rise.
Researching Ocean Acidification in the Estuary
Ocean acidification (OA) is a global issue that can impact water quality and habitat conditions for shelled creatures. Research is essential to understand the local impacts of OA on estuary habitats, plants, and wildlife. Dr. Emily Bockmon of Cal Poly’s Chemistry Department is at the forefront of OA research in Morro Bay and has recently published findings from carbonate chemistry monitoring within the estuary during the warm summer months (Bartoloni et al. 2023). These surveys found that the back bay is notably more acidic than the front bay, likely due to the higher number of biological processes that produce carbon dioxide (CO2). Because the back bay is farther from the mouth of the estuary and experiences less tidal exchange with the ocean, these CO2 producing processes persist for longer periods of time. Fortunately, the back bay also contains a relatively high concentration of dissolved minerals that can neutralize acids, helping to buffer the back bay from extreme changes in acidity. Dr. Bockmon’s lab is currently working on another publication analyzing a multi-year series of shoreline samples and data from continuous sensors deployed in the bay. These efforts will further reveal how OA may impact the Morro Bay estuary in the future.
Nitrates in the Watershed
Reports of harmful algal blooms are becoming more frequent, with some of these producing toxins harmful to people and animals. While these blooms can be influenced by factors like water temperature and currents, excess nutrients such as nitrates can also drive them. Nitrates can come from sources like agricultural and residential fertilizing, stormwater runoff, and wastewater treatment plants. Even if a bloom is not toxic, excess algae growth can crowd out beneficial plants and deplete oxygen from the water, making it harder for fish and other aquatic life to survive. Tracking nitrate levels in our local creeks is essential for understanding overall creek health.
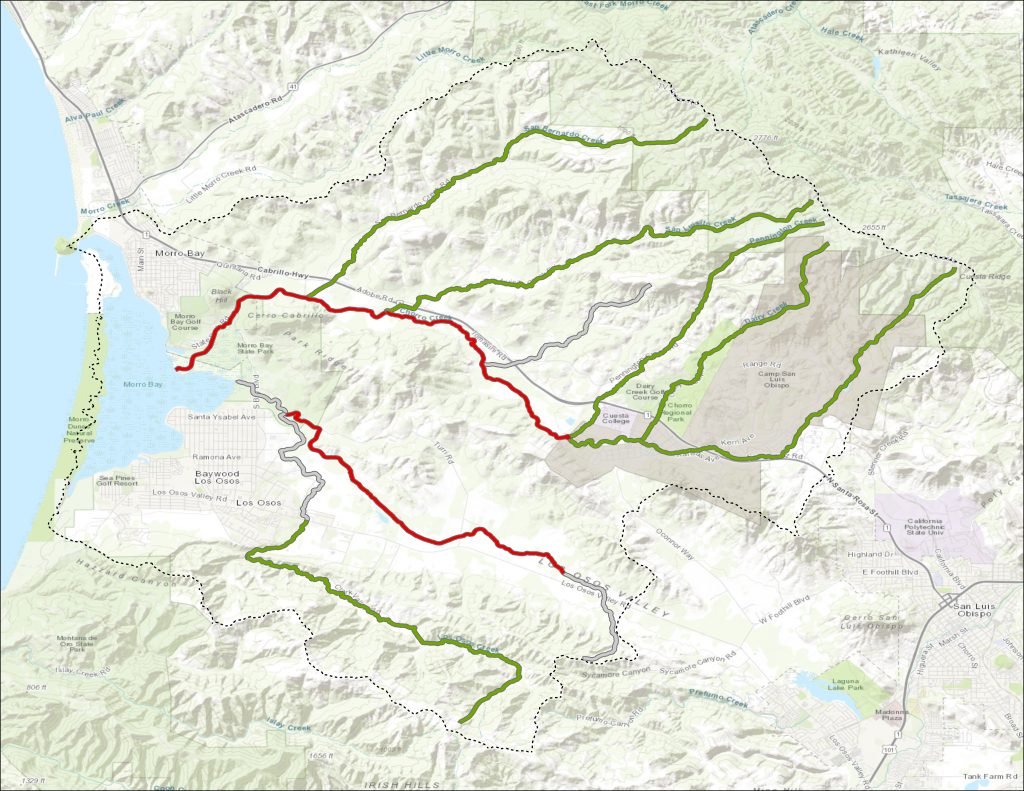
The map shows an analysis of nitrate concentrations for creek segments throughout the Morro Bay watershed. Data indicate that Upper Los Osos Creek, Upper Chorro Creek, and the creeks that drain into Chorro Creek (Dairy, Pennington, San Bernardo, and San Luisito Creeks) have low, or Good, levels of nitrates, which supports a healthier aquatic environment. Middle and Lower Chorro Creek and Warden Creek score Very Poor for nitrate levels, although Chorro Creek has shown a marked improvement over time. High nitrate concentrations can cause imbalances in the water quality, resulting in low oxygen levels that can harm sensitive wildlife like steelhead trout. Grayed–out creek segments indicate areas without enough data for assessment.
To view the data used to create this map, view our State of the Bay data dashboard.
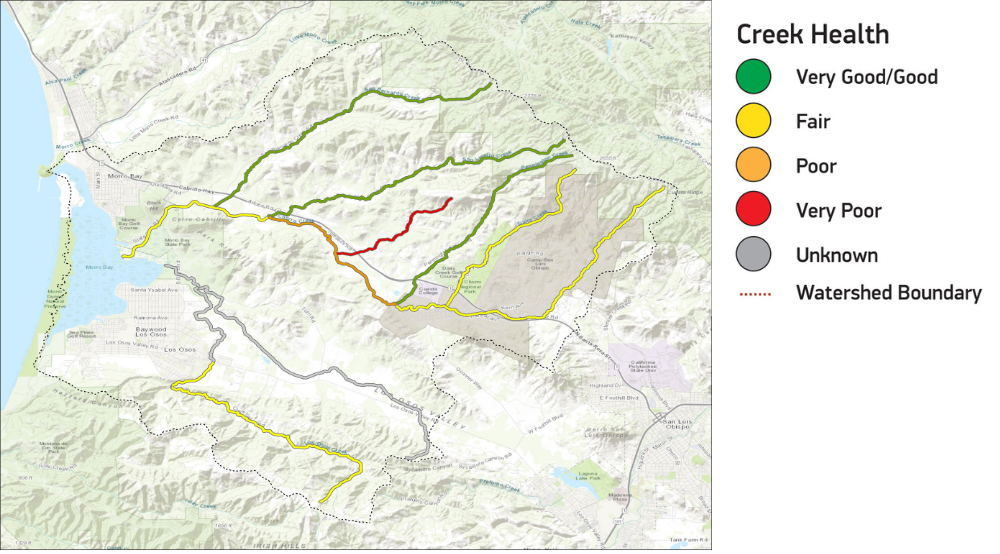
Creek Health in the Watershed
Water quality data help us understand whether a creek can support aquatic life. Another way to assess this is by monitoring the organisms living in the creek. By collecting and analyzing the macroinvertebrates (animals without a backbone that you can see with the naked eye), we can determine whether the creek habitat is suitable for sensitive species like steelhead trout. Some macroinvertebrate species are sensitive to pollution and will thrive only in clean waters, while others can tolerate very poor water quality conditions. Creeks with more pollution-sensitive species typically provide better habitat than creeks with more pollution-tolerant species.
To view the data used to create this map, view our State of the Bay data dashboard.
Creek Health Recovery After Winter 2023
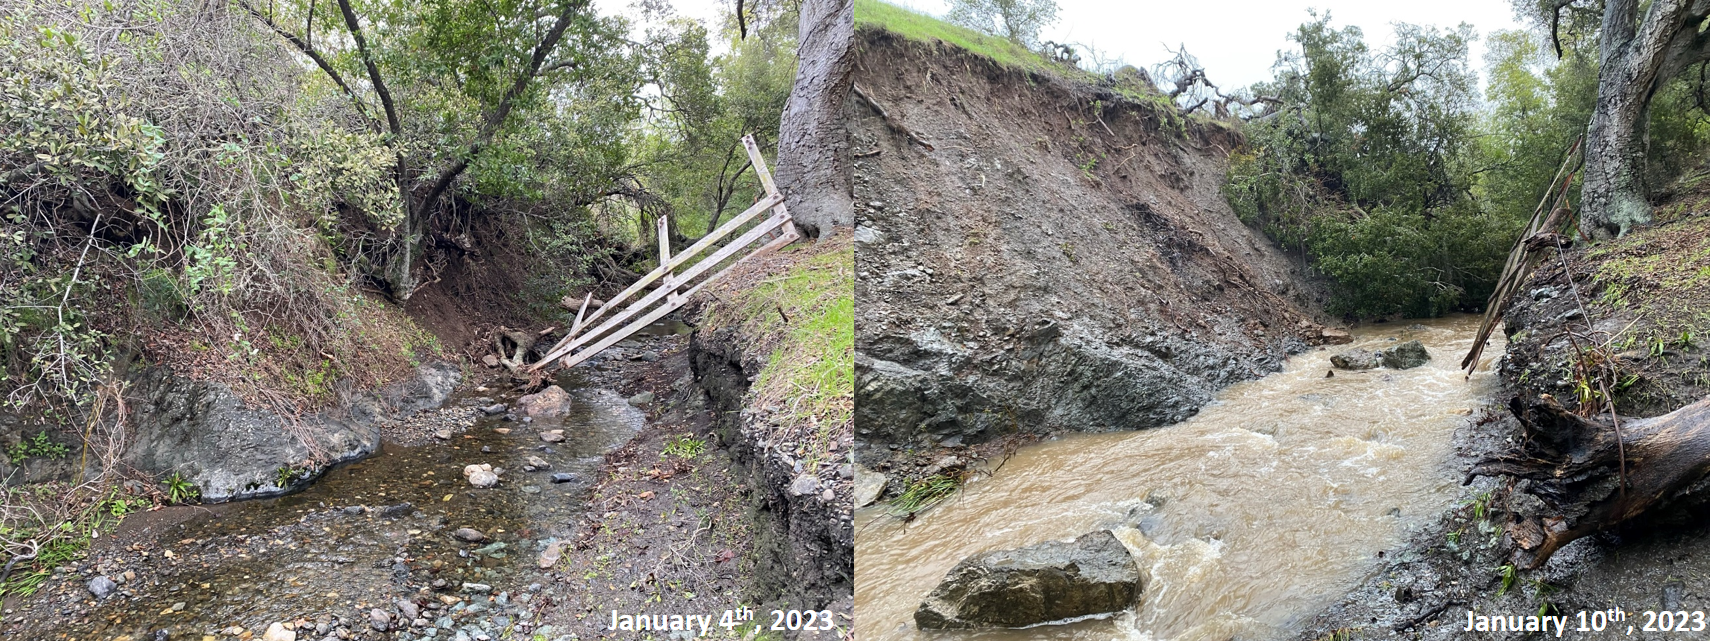
Storm events can play an important role for creek-dwelling macroinvertebrates since high-intensity storms and flooding can alter habitat conditions, making it challenging for sensitive species to thrive. Following the large storms of January 2023, creek health scores in the Morro Bay watershed indicated high levels of disturbance, especially in the tributaries of Pennington, San Bernardo, and Dairy Creeks. The series of photos below illustrates how the storms of January 2023 affected Pennington Creek.
By 2024, many of the tributaries showed significant improvement, with sites like Upper Dairy Creek improving as much as 73%. One site on Upper Los Osos Creek, however, recovered much more slowly, with scores improving by only 22% between 2023 and 2024.
Our 2025 results show that Upper Los Osos Creek is finally moving towards recovery, with its score improving from “Fair” in 2024 to “Good” in 2025. This site has shown a similar pattern historically, often taking two to three years to rebound after disturbance. The reasons for its slower recovery aren’t fully understood but may be related to its unique geology and groundwater interactions in Upper Los Osos Creek, which may limit how quickly habitat becomes suitable for macroinvertebrates after large storm events.
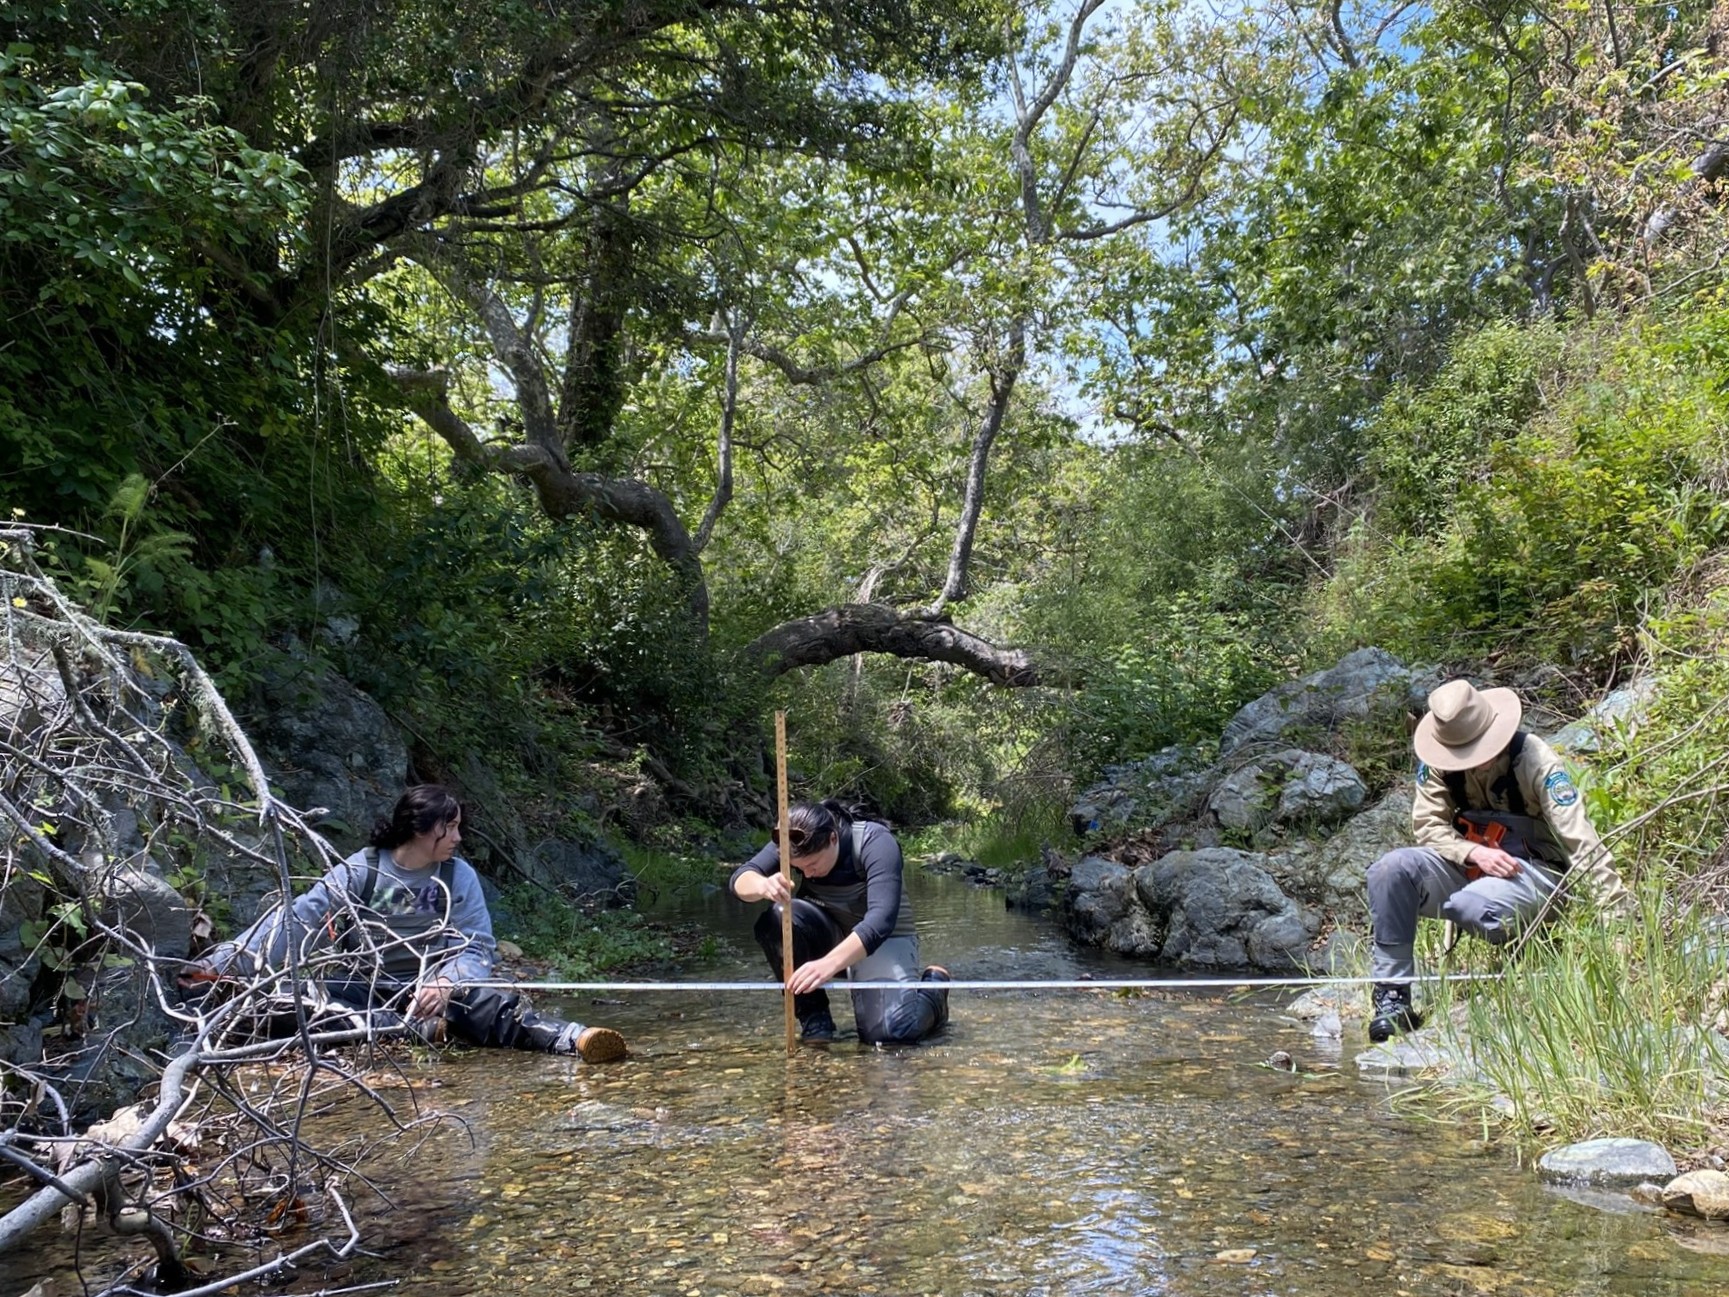
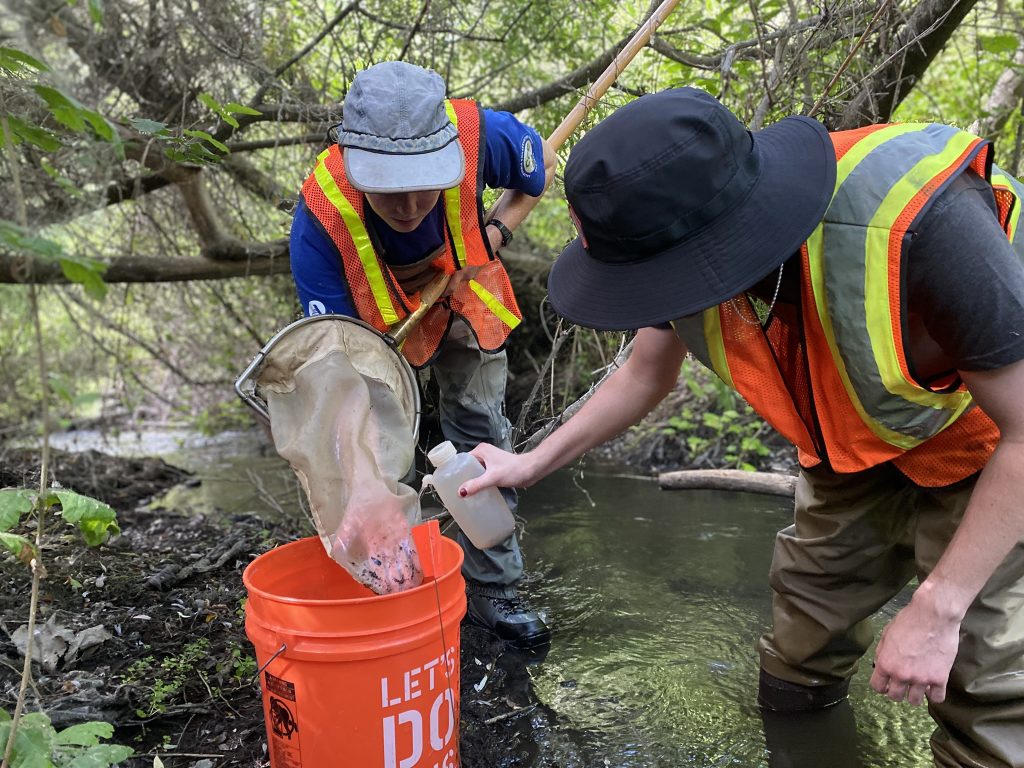
How We Monitor Creek Health
Each spring we work with our partners and volunteers to conduct this monitoring at sites throughout our watershed. We collect macroinvertebrates and take measurements of the habitat to determine whether the creek would support sensitive species.
Meet the Macroinvertebrates!
The types of macroinvertebrates we find in a creek give us information about the water quality in that creek. Some species are very sensitive to pollution, so if you find those in your sample, it’s likely that the water quality is typically good. Others are very tolerant to pollution, so if those are all you find in your sample, then the water quality is likely poor. Here are a few of the macroinvertebrates we often find in the Morro Bay watershed and what they tell us about water quality.
Thank You, Harold J. Miossi Trust!
The Harold J. Miossi Charitable Trust has generously supported bioassessment monitoring in the Morro Bay watershed since 2013, contributing more than $154,000 to this important work. With the Trust’s generous support, we have been able to develop a critical dataset that helps us to prioritize conservation and restoration projects and understand changes in creek health over time. To learn more about the Miossi Charitable Trust, please visit https://www.miossicharitabletrust.org/.
Tracking Oxygen in Our Creeks
Adequate amounts of dissolved oxygen in our bay and creeks are crucial for much of the aquatic life to thrive, including macroinvertebrates. These measurements are quick and easy to collect, making them a good indicator of ecosystem health. To track changes in oxygen within the creeks, we deploy continuous monitoring sensors at several sites to measure temperature, conductivity, pH, and chlorophyll pigment concentration in addition to dissolved oxygen. They are programmed to collect data each hour and can be left on site for up to three months at a time.
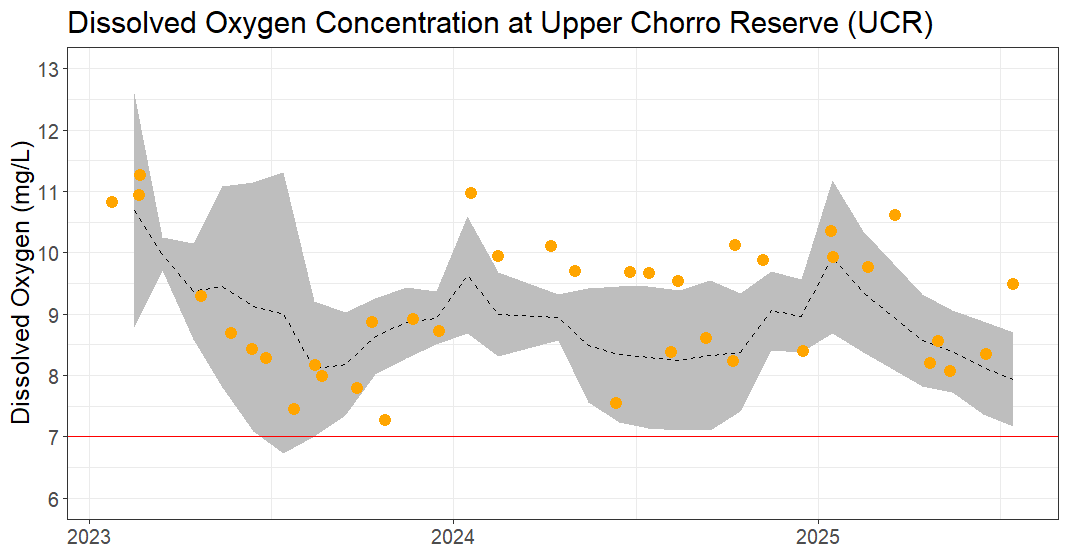
Dissolved oxygen (DO) readings taken during monthly monitoring visits (orange) and DO collected by continuous sensors (dashed line represents average DO and the gray shaded ribbon represents one standard deviation above and below the average) at a Chorro Creek site upstream of the Chorro Creek Ecological Reserve. The continuous deployments allow us to track the variability of DO throughout the month. The instantaneous readings can miss when DO drops below protective standards (red line), as it did in July 2023. Additionally, instantaneous sampling is typically conducted during the day, when DO is at its peak and may not be representative of average conditions.
Continuous dissolved oxygen data are particularly valuable for evaluating creek health because instantaneous readings collected during monthly site visits may miss extended periods of low oxygen. Sustained low oxygen concentration can be harmful for numerous creek-dwelling animals, including protected species like steelhead trout and California red-legged frogs. The results from our first full year of continuous monitoring have shown that sites along Warden Creek fall below protective standards for dissolved oxygen more frequently than our sites along Chorro Creek. For a more comprehensive overview of creek oxygen concentration, you can check out our latest Creek Health Memo.
Data Notes
The analysis for nitrates and bay oxygen utilized the Central Coast Regional Water Quality Control Board (Water Board) scoring method called California Central Coast Healthy Watersheds Project – Part 1, Report Cards for Scoring Water Quality Data to Characterize Health and Change. The analysis looked at all available data. The trend was determined by assessing data before and after January 1, 2014 for comparison. The nitrate indicator symbol was calculated for levels on lower Chorro Creek. For the creek health scores, the California Stream Condition Index was utilized, and scores for individual sites were averaged to represent conditions on each creek segment.
References
Bartoloni, S. E., Walter, R. K., Wewerka, S. N., Higgins, J., O’Leary, J. K., Bockmon, E. E. 2023. Spatial distribution of seawater carbonate chemistry and hydrodynamic controls in a low-inflow estuary. Estuarine, Coastal and Shelf Science. https://doi.org/10.1016/j.ecss.2022.108195
Benthic Macroinvertebrate Bioassessment Data Summary Memo 2024: https://library.mbnep.org/wp-content/uploads/2025/06/Benthic-Macroinvertebrate-Bioassessment-Memo-2024_FINAL.pdf
Morro Bay Estuary Health Memo (Water Year 2024): https://library.mbnep.org/wp-content/uploads/2025/08/Morro-Bay-Estuary-Health-WY2024.pdf
Morro Bay Watershed Creek Health Memo For Water Year 2024: https://library.mbnep.org/wp-content/uploads/2025/09/Morro-Bay-Watershed-Creek-Health-WY2024_FINAL-1.pdf
Dissolved oxygen monitoring: https://www.epa.gov/system/files/documents/2021-07/parameter-factsheet_do.pdf