Is Morro Bay safe for swimming?
Bacteria in the Bay

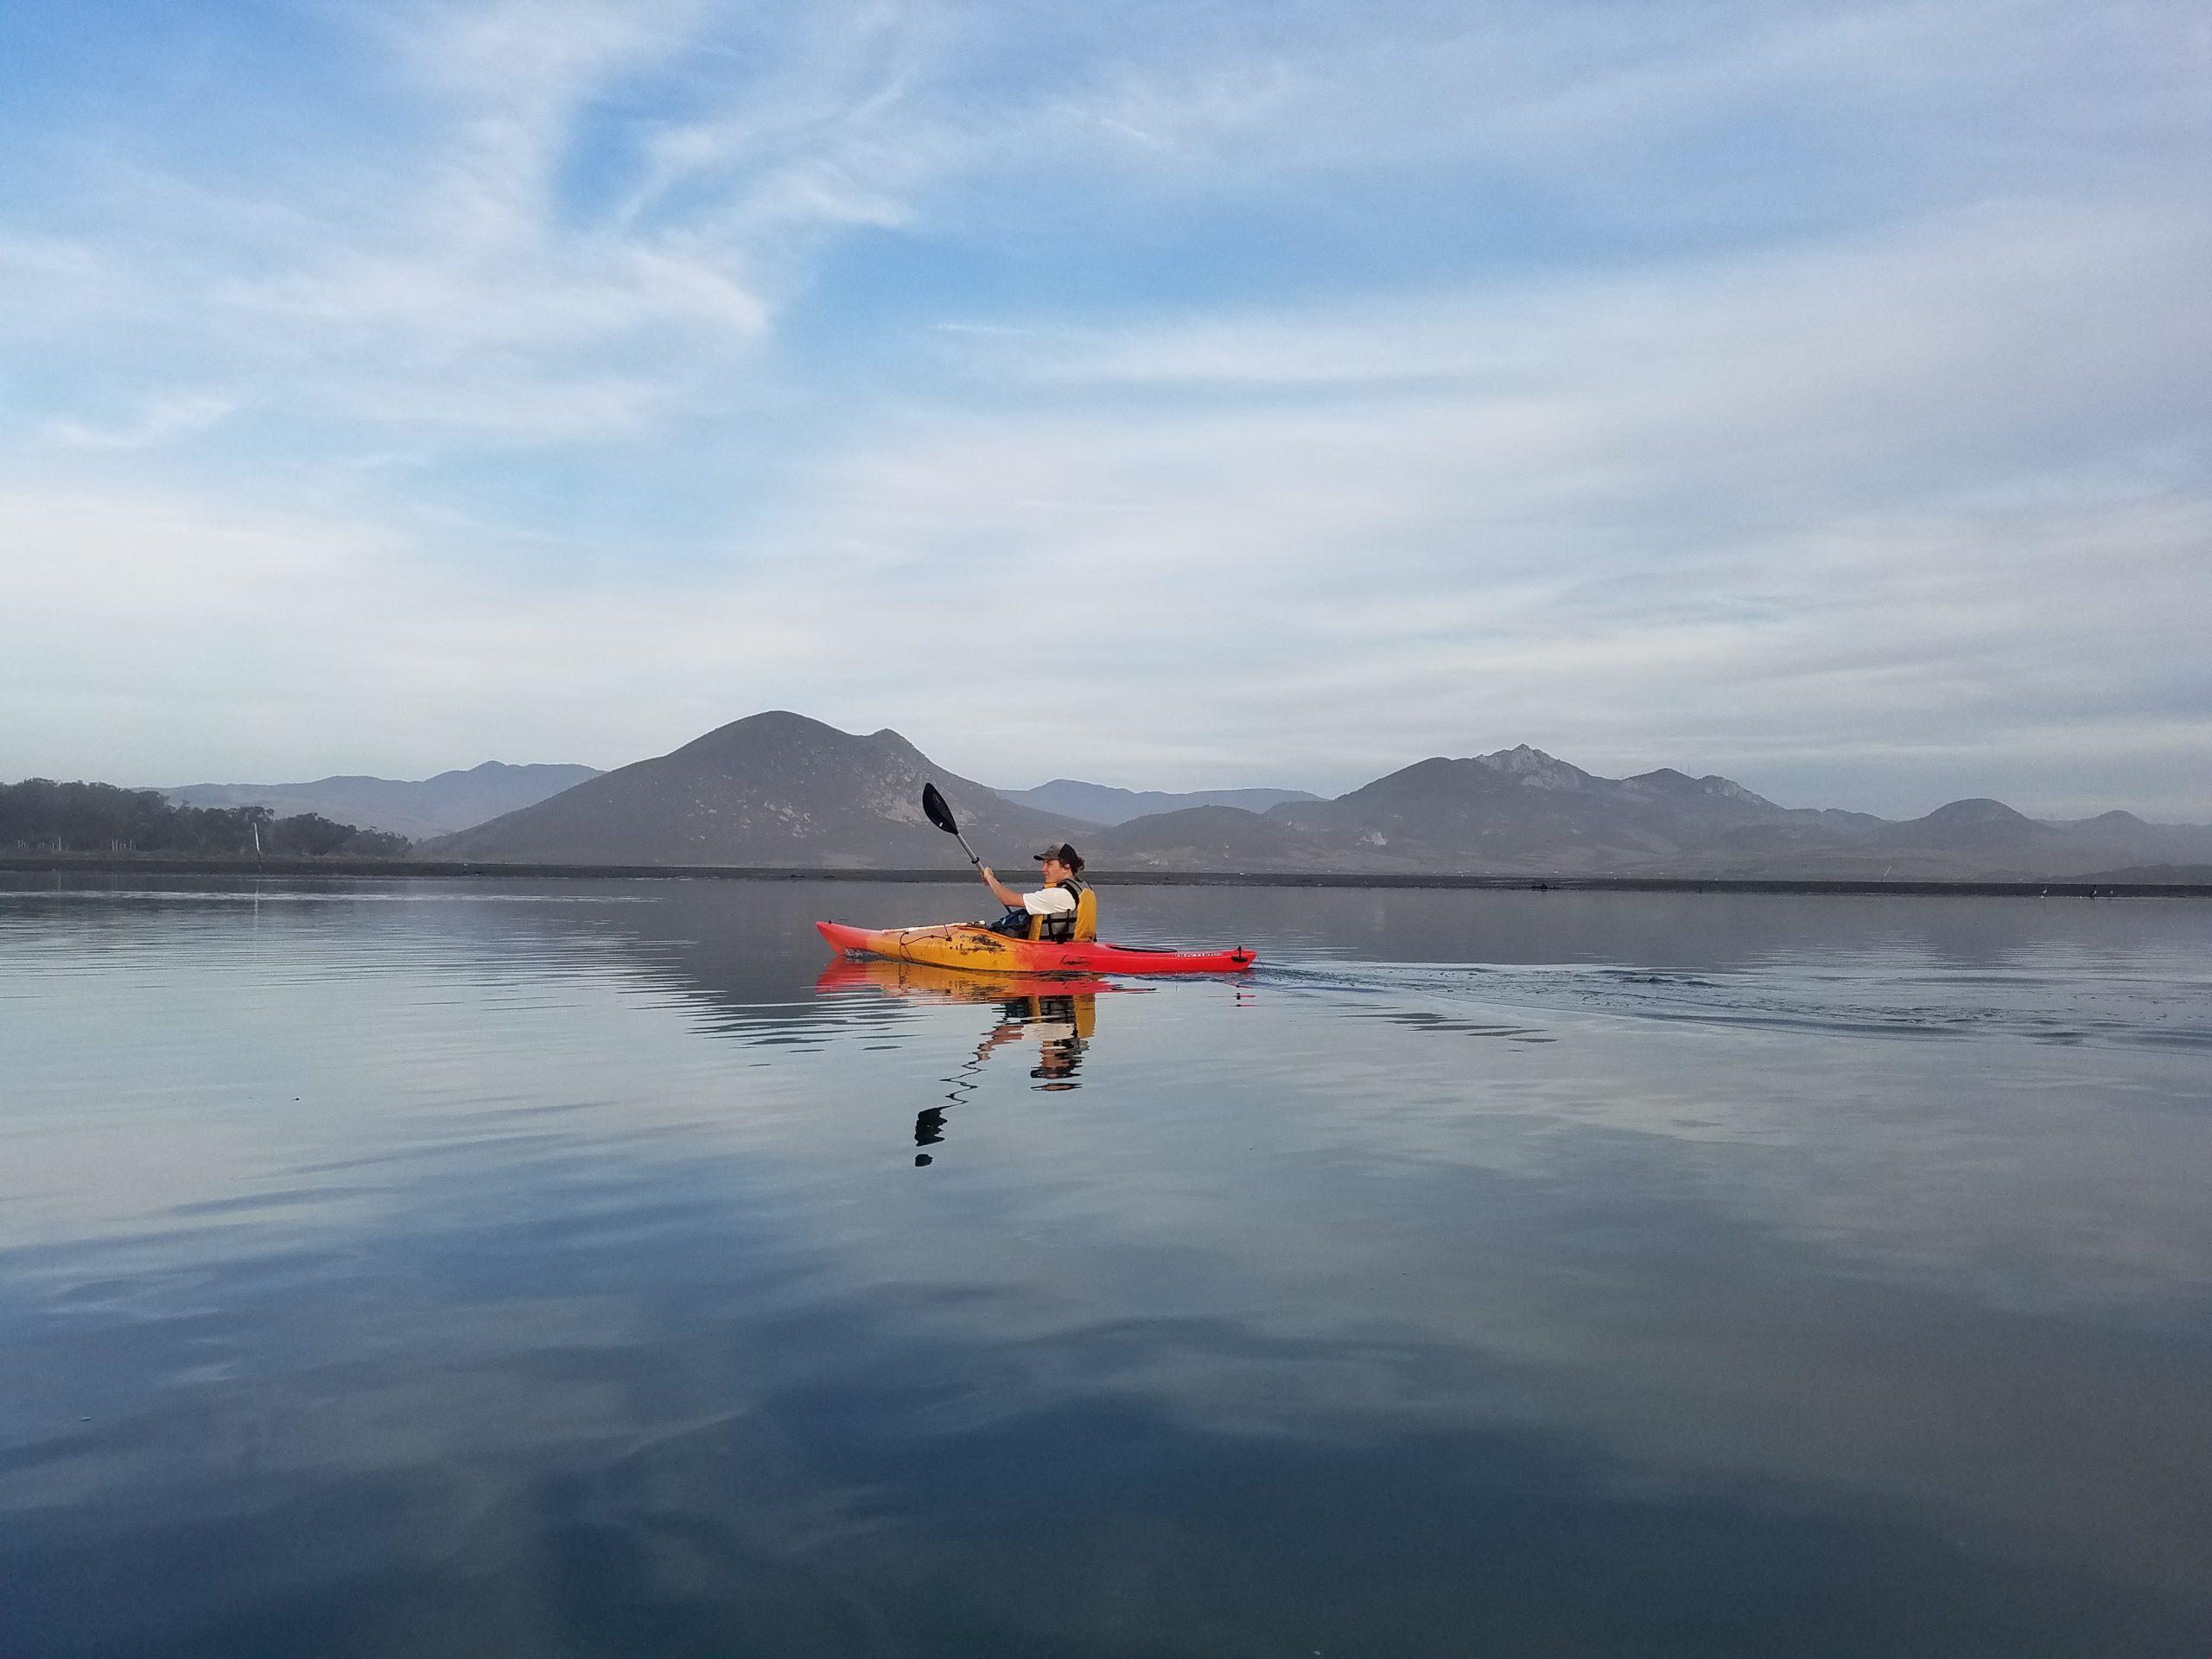
Residents and visitors alike are drawn to Morro Bay’s scenic beauty. While many are satisfied with admiring it from the shore, more adventurous types will head out on the waters to boat, paddle, swim, and fish. To do these activities safely, the bay waters must be clean; otherwise, people who recreate on the bay could become ill from pathogens like bacteria, viruses, and protozoa.
Sources of pathogens are varied and can include pet waste, agricultural operations, marine wildlife, and sewage spills from treatment plants or waste-holding tanks on boats.
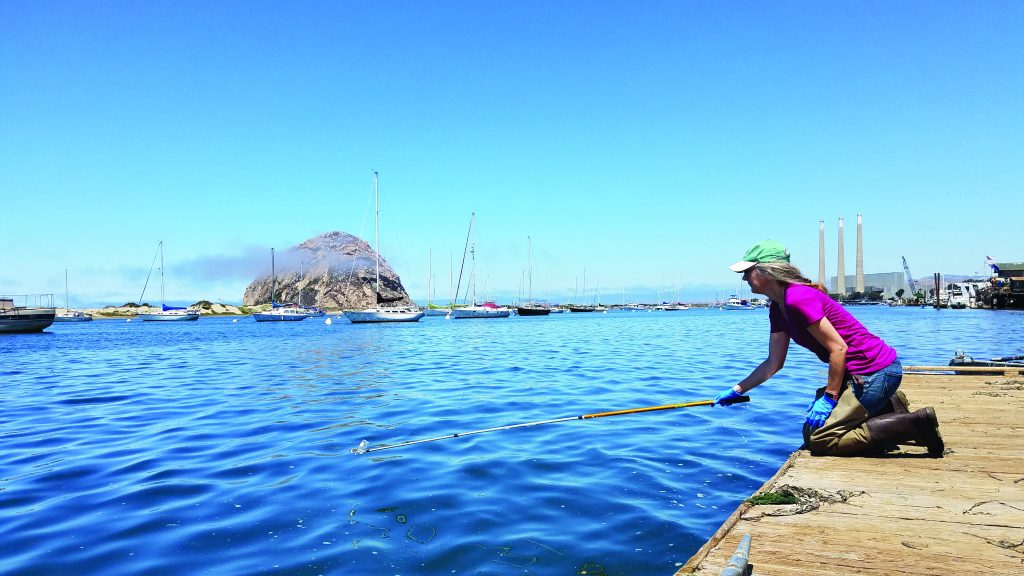
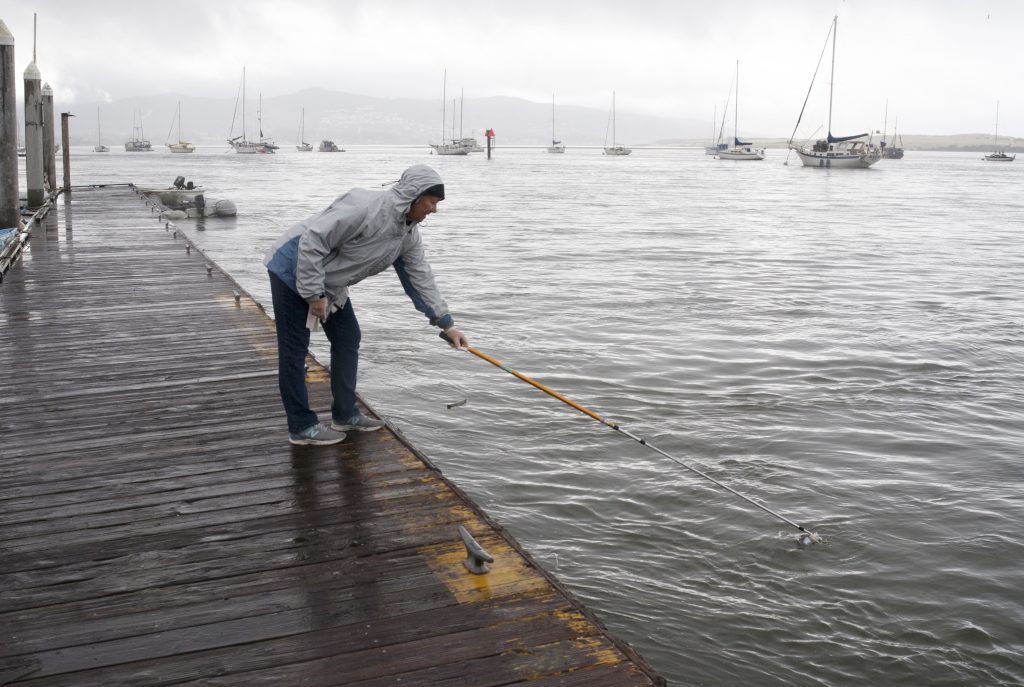
Estuary Program volunteers venture out monthly to monitor bay shoreline sites to determine if they are safe for recreational contact. This monitoring began in 2005 and, thanks to countless hours from dedicated volunteers, has resulted in a long-running dataset that tracks the safety of swimming conditions in the bay.
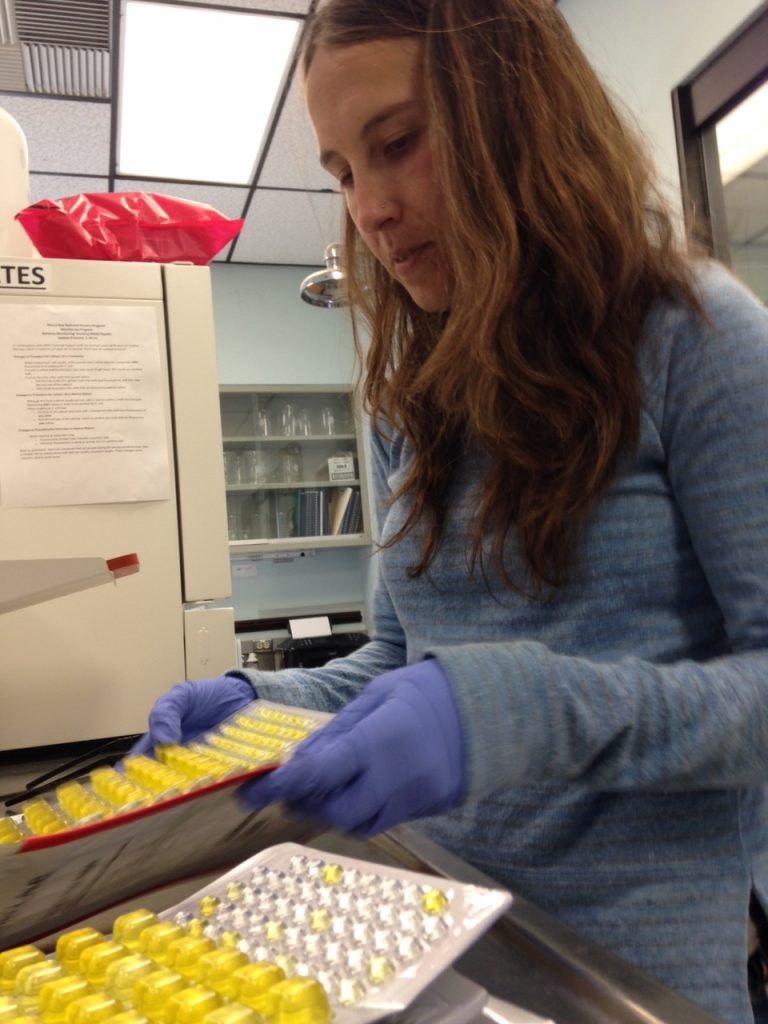
Video Presentation: Safe Swimming and Bacteria Levels in the Morro Bay Estuary
See how our volunteers and staff test for bacteria in our waters and learn whether bacteria levels are low enough for safe swimming. Video presentation by the Morro Bay National Estuary Program’s Assistant Director, Ann Kitajima. Diagram of Bacteria Sources used in the video presentation is courtesy of the Environmental Protection Agency (EPA).
How We Monitor Bay Bacteria
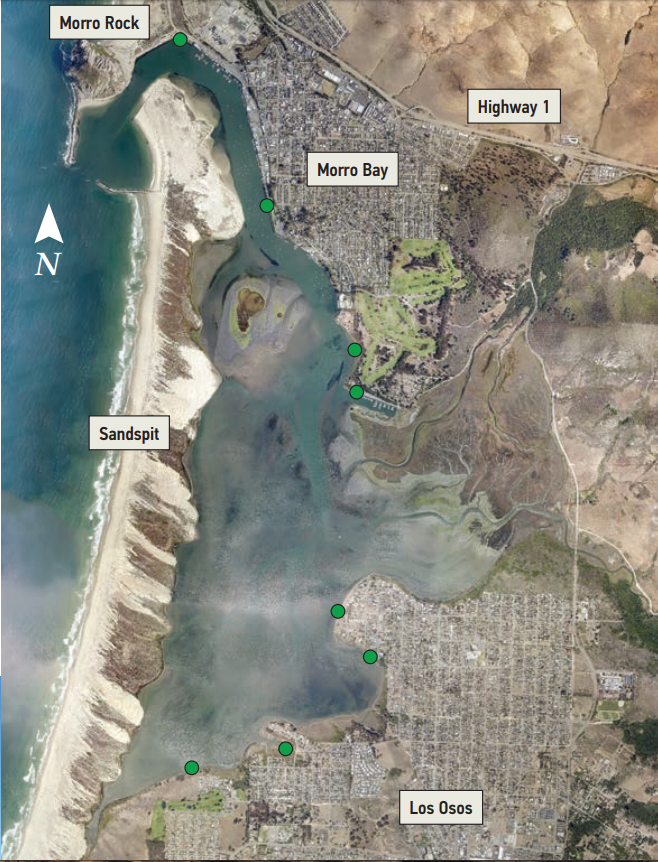
The map shows the safe swimming status of eight bay sites using data from 2005 through 2018. Green indicates that the bacteria concentrations are low, and waters are typically safe for swimming. Even clean waters can be contaminated by storm runoff, so it is best to stay out of the water for seventy-two hours after it rains.
Bay Bacteria Status
-
Very Good/Good
-

Fair
-

Poor
-

Very Poor
The eight bay shoreline monitoring sites were selected because they represent the areas with the most recreational contact. The sites are (from north to south) Coleman Beach (site code COL), Tidelands Park (TID), Windy Cove (WIN), State Park Marina (SPM), Pasadena Point (PAS), Baywood Pier (BAY), Cuesta Inlet (CIN), and Sharks Inlet (SIN).
Of the eight sites monitored, historical trends showed six sites typically had only rare exceedances of recreational contact standards. The four sites toward the mouth of the bay (COL, TID, WIN, and SPM) are along the well-mixed channel and are thought to be primarily influenced by ocean water entering the bay with the incoming tide. These sites have very few elevated bacteria results. The two sites further back in the bay, Cuesta Inlet (CIN) and Sharks Inlet (SIN), have minimal exceedances of recreational standards. These sites may experience some water circulation issues, as the back bay is shallow and experiences minimal mixing with the incoming tides during certain times of year. The reason for the lower bacteria concentrations might be the lack of bacteria input. Two sites, Baywood Pier and Pasadena Point, had more frequent exceedances of the standard. BAY and PAS had elevated bacteria levels in approximately 30% of their samples during 2017. In 2018, PAS had only one reading that exceeded the safe swimming standards. All results from BAY were safe for swimming, which has not occurred since 2008. These two sites may have higher bacteria levels due to human sources such as stormwater runoff and natural sources such as wildlife.
Other Bacteria Data
Another source of local bacteria data is Heal the Bay, an environmental nonprofit dedicated to making the Southern California coastal waters and watersheds safe, healthy, and clean.
Each year, Heal the Bay compiles a Beach Report Card that assigns an A to F letter grade to 500 California beaches using weekly bacteria results. The data comes from monitoring data from government agencies. Higher grades indicate a lower risk of illness to beachgoers.
The following table shows the grades for San Luis Obispo County beaches for 2018 to 2019. The data was separated into three categories. Data are assigned to the Summer Dry season when beach usage tends to be higher. The Winter Dry season is November to March and only includes times without rain. The Wet Weather data includes times with rainfall throughout the year. This is because stormwater runoff can transport pollutants such as bacteria into our coastal waters, impacting our beaches. In 2018 to 2019, SLO County beaches received very high grades.
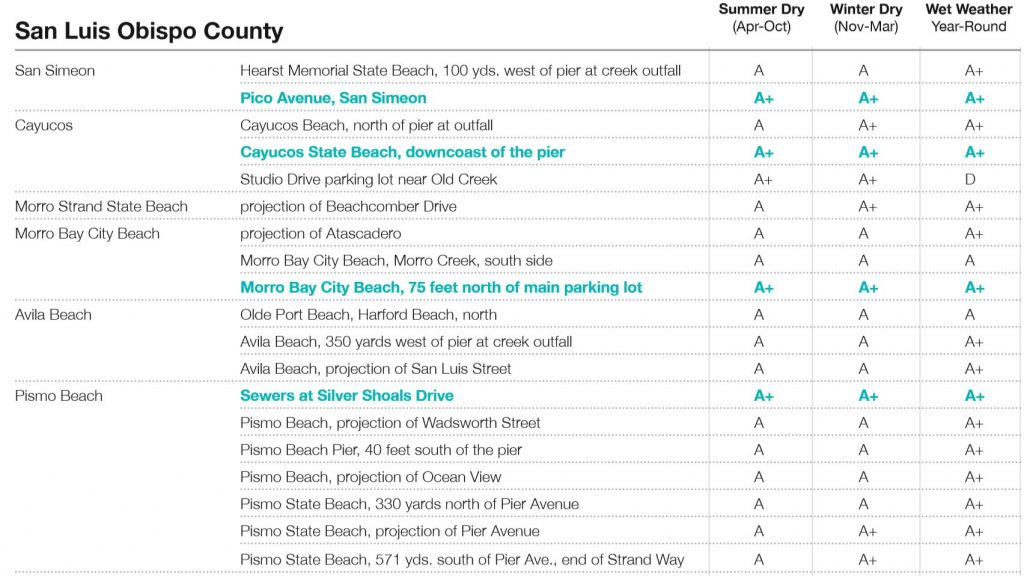
For comparison, here are results from some beaches throughout the state.
| Selected Beaches’ Reports | Summer Dry (Apr-Oct) | Winter Dry (Nov-Mar) | Wet Weather Year Round | |
| La Jolla | La Jolla Cove | C | A | – |
| Laguna Beach | Emerald Bay Beach, point zero | A+ | A | A+ |
| Santa Monica | Santa Monica Municipal Pier, point zero | C | C | F |
| Ventura | Rincon Beach, 25 yds. south of the creek mouth | A | A | A+ |
| Morro Bay | Morro City Beach, 75 feet north of main parking lot | A+ | A+ | A+ |
| Monterey | Monterey State Beach | A+ | F | |
| Santa Cruz | Cowell Beach, West of Wharf | F | A | C |
| Half Moon Bay | Surfer’s Beach, south end of riprap | B | F | |
| Ocean Beach | Ocean Beach, projection of Balboa avenue | A+ | A+ | A |
| Muir Beach | Muir Beach, North | A | A+ | |
| Fort Bragg | Pudding Creek ocean outlet | A+ | A+ | |
| Crescent City | Battery Point lighthouse | A+ | A+ | |
For the full report card, visit the Heal the Bay website.
Keep Pets Safe, Too!
Pet owners should limit their animals’ exposure to rain and wet conditions, because they are also more susceptible to sickness and disease, according to the Los Angeles County Department of Animal Care and Control. This includes making sure their food isn’t contaminated by stormwater runoff and providing alternatives if the dogs are unable to go outside to relieve themselves. The full article on this topic is available online.
Data Notes
Scoring Update: The Central Coast Regional Water Quality Control Board (Water Board) updated the scoring method for assessing the status and trends of waterbodies. The analyses look at all available data, some of it going back to the 1990s. More information on the methods of analysis and results for other areas on the California Central Coast are available at the Water Board website.
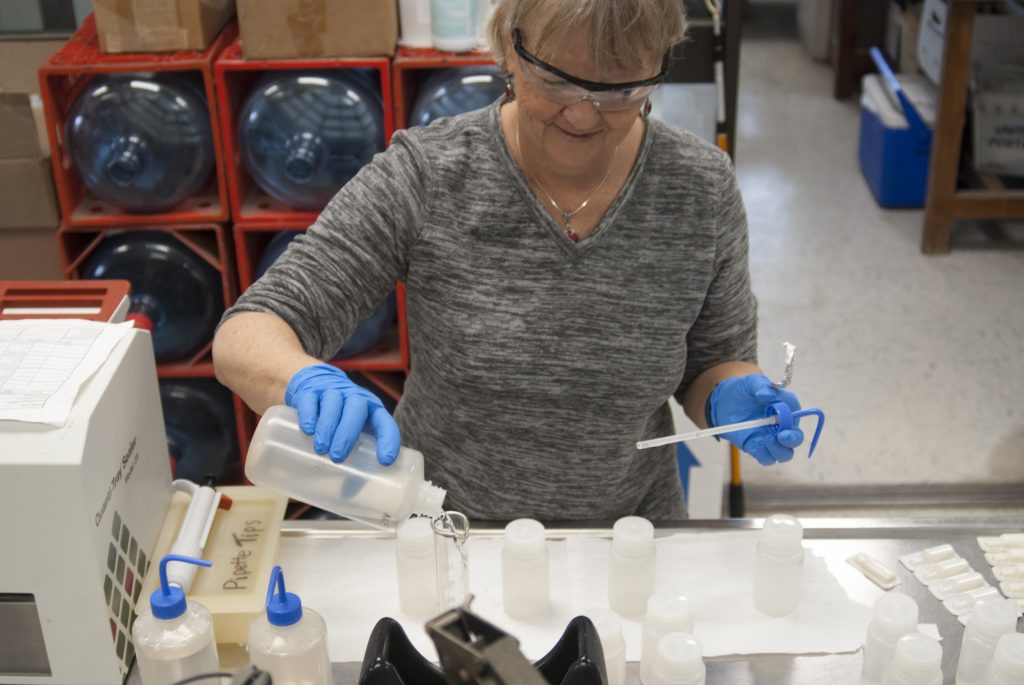
Bacteria: The bay bacteria results were collected by Estuary Program volunteers and staff. Samples were collected from shore using sterile technique. The samples were analyzed using the IDEXX Enterolert method and Quanti-tray 2000. For the 2020 report, the Magnitude Exceedance Quotient (MEQ) method was used and included all data going back to 2005 when data collection began. The trend for bacteria data was determined by calculating the MEQ analysis using data for all sites, both prior to January 1, 2014 and after that date for comparison. The bay wide trend was Stable (represented by a circle), meaning no real change from before as compared to after January 1, 2014. The overall bacteria condition was Good (represented by the color green of the symbol).
How to Read Estuary Health Symbols
The Estuary Health Symbols represent how the status of each question is changing over time. A round symbol indicates that the trend is stable. An arrow indicates an improving trend (up arrow) or a worsening trend (down arrow). The color of the base of the arrow indicates the status of historical data and the color of the triangular part of the arrow indicates the status of the newer data. The color of the symbol indicates the status as follows: Good/Very Good (green), Fair (yellow), Poor (orange), Very Poor (red), and Unknown (grey).
-

This symbol indicates that the water quality was Very Poor and has improved to Poor.
-

This symbol indicates that the trend is stable but we lack adequate data to assign a status.
-
Very Good/Good
-
Fair
-
Poor
-
Very Poor
-
Unknown