
Is water in the creeks and bay clean enough for fish and aquatic life?
Bay Oxygen Status

Morro Bay’s wildlife depends on clean water in order to thrive. Clean water means healthy habitats, which are places where wildlife can find food and shelter. The waters must have adequate oxygen levels to support marine life and be free of pollutants. The Estuary Program and its volunteers conduct monitoring throughout the bay and watershed to track the health of the waters and understand how they’re changing over time.
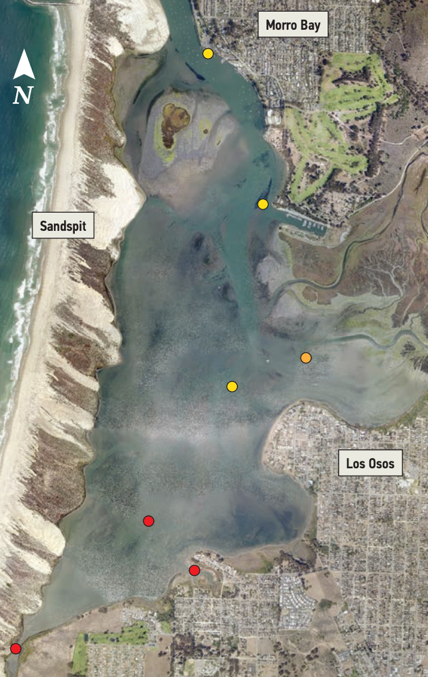
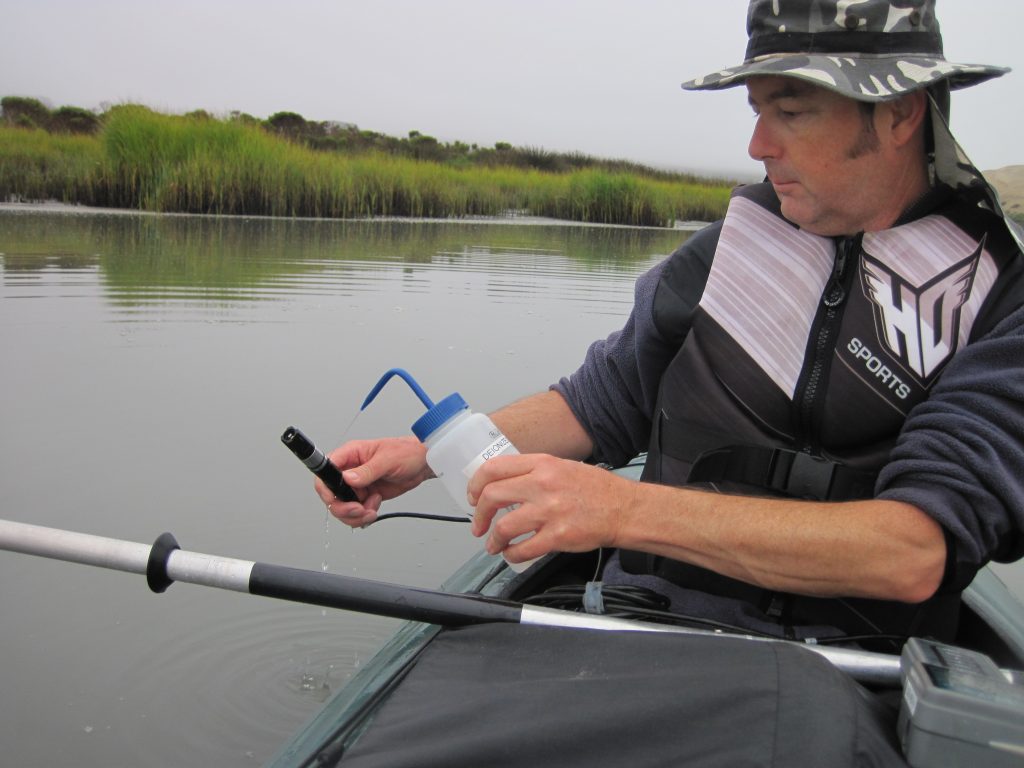
The map shows dissolved oxygen levels (the amount of oxygen available in the water for plants and animals) throughout the bay using monthly readings from 2002 through 2018. Estuary Program volunteers collect the data via kayak in the early morning hours to record the lowest oxygen levels of the day. The data consistently shows the trend of higher oxygen levels towards the front bay, where tidal flow in the deeper channels keeps the waters well-oxygenated. Towards the back bay, the shallow waters don’t experience as much tidal mixing. The water can be stagnant there during certain times of year. Without the influx of cold, well-oxygenated ocean waters, temperatures can increase and cause oxygen levels to decrease. Bay scores have been relatively stable over time, although data showed a decrease in score at one of the back bay sites from Poor to Very Poor.
Bay Oxygen Status
-

Very Good/Good
-

Fair
-

Poor
-

Very Poor
Video Presentation: Creek Health and Bioassessment
Learn how we assess creek health through a scientific survey called bioassessment in this video presentation by the Morro Bay National Estuary Program’s Assistant Director, Ann Kitajima.
How We Monitor Creek Health
Looking at the monthly readings from Water Year 2018 (October 1, 2017 through September 30, 2018) at the three sites furthest back in the bay, every reading was below 7 mg/L. This is the level determined by the Water Board to be protective of aquatic life. Throughout the year, these sites consistently had oxygen levels that were too low to be protective of the most sensitive aquatic species. At the three sites toward the front bay, the number of readings that were below 7 mg/L varied from 24 to 40% of the measurements. To see a summary of data for the year, visit the Estuary Program’s online library.
Other Morro Bay water quality data is available. The Central and Northern California Ocean Observing System (CeNCOOS) has a monitoring station at the north T-pier that collects near-real time data for conductivity, salinity, temperature, depth, dissolved oxygen, chlorophyll fluorescence, turbidity, and nitrate. The station has been maintained by Cal Poly since 2007, and data is available via the CeNCOOS website.
Nitrate Status in the Watershed

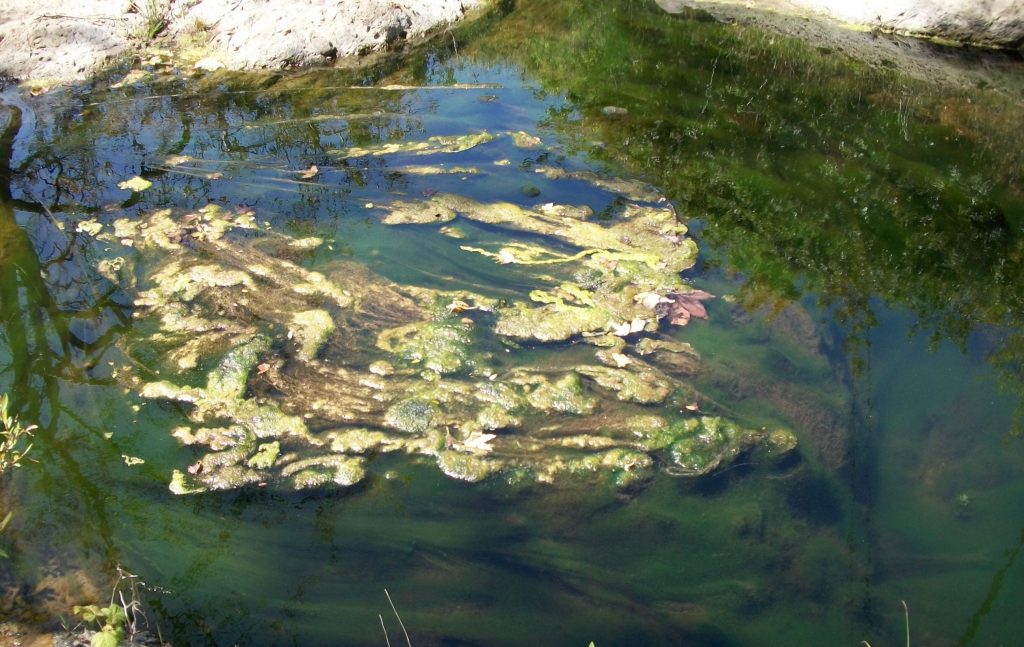
Nitrates are a form of nutrient necessary for plants, from house plants to large-scale crops, to grow. Nitrates can become a problem if too much is applied to plants, as rain can wash these nutrients off yards and fields and into nearby creeks or the bay. Nitrates can also come from decomposing plants, animal waste, and treated wastewater. If the nitrate levels are elevated in a waterbody such as a creek or the bay, those waters can become choked with excess algae that can deplete the oxygen in the water.
The Estuary Program conducts regular monitoring for nutrients throughout the watershed. A map summarizing data from 2001 through 2018 is shown below.
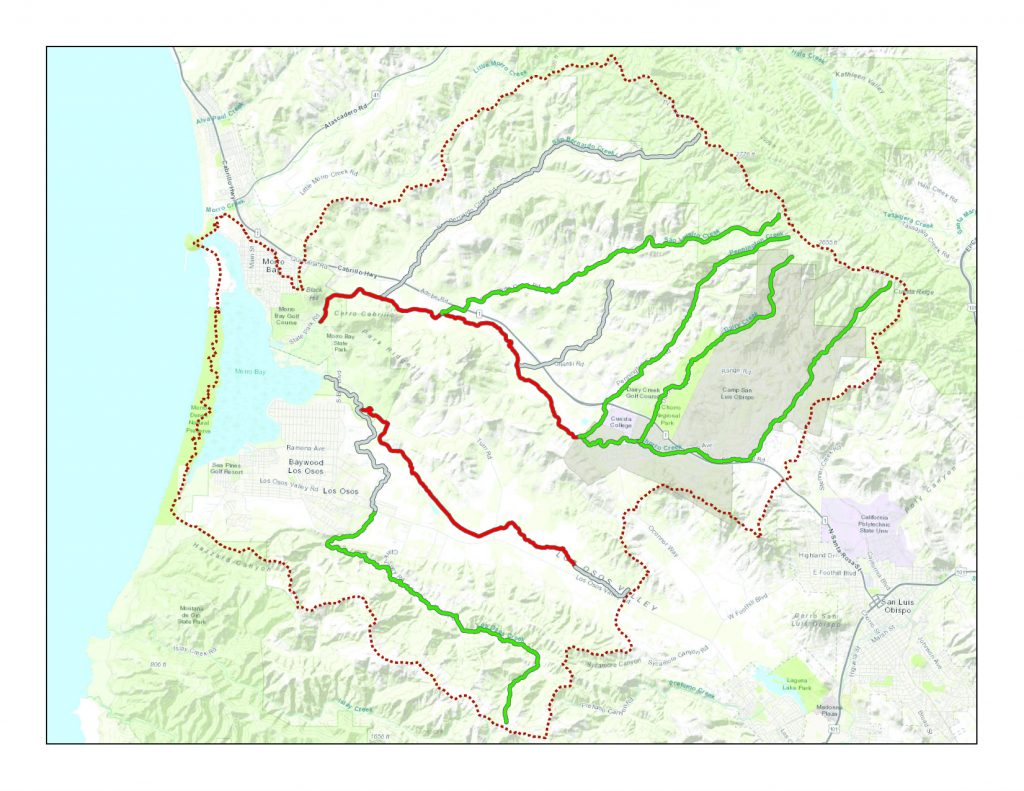
The map shows the nitrate scores for the creeks in the Morro Bay watershed. The green color indicates that the nitrate levels are Good (lower than levels that negatively impact aquatic life) in upper Los Osos Creek, upper Chorro Creek, and the tributaries to Chorro Creek. Middle and Lower Chorro and Warden Creeks have Very Poor nitrate levels (much higher than levels that can affect aquatic life). Some areas like Walters, San Bernardo, and lower Los Osos Creek lack adequate data to assign a score.
Nitrate Status
-
Very Good/Good
-
Fair
-
Poor
-
Very Poor
-

Unknown
-

Watershed Boundary
For more details on the Estuary Program’s nutrient analysis monitoring effort, visit our online library to see results from Water Year 2018.
What's Behind the Scores?
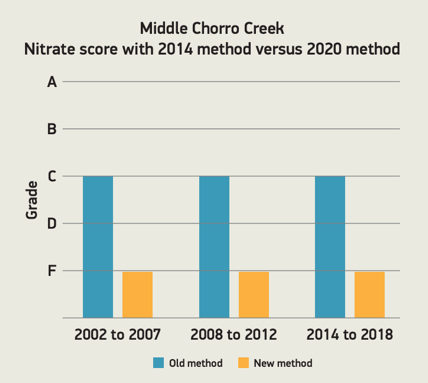
When comparing the nitrate scores from the 2020 State of the Bay Report (see previous map) to analyses from earlier reports, the nitrates appear to have degraded on middle and lower Chorro Creek. This is not due to worsening nitrate scores, but rather to Water Board (the state agency tasked with protecting California’s waters) efforts to update analysis methods. To demonstrate this shift in scoring, the Estuary Program analyzed data from different time periods using the new method and the old method, and scores have remained relatively stable over time with each method. So, while the creek continues to be impacted by nitrates, the apparent decrease in scores in 2020 is due to updates to the analysis approach.
The Water Board method of analysis utilized in the State of the Bay 2020 report is called the magnitude exceedance quotient (MEQ). Rather than using something more simple like the average of data over time, the MEQ method takes into account the magnitude of each measurement relative to the threshold (the level protective of human health, aquatic life, etc.) and the proportion of samples exceeding the threshold. This analysis is part of a Water Board effort to share data in meaningful ways with the public. A detailed description of the Water Board method is available online.
Creek Health in the Watershed
Trend status: Stable at all sites, with one site showing a slight improvement. No scores were available from areas that we expect are heavily impacted (Watden and lower Los Osos Creeks).
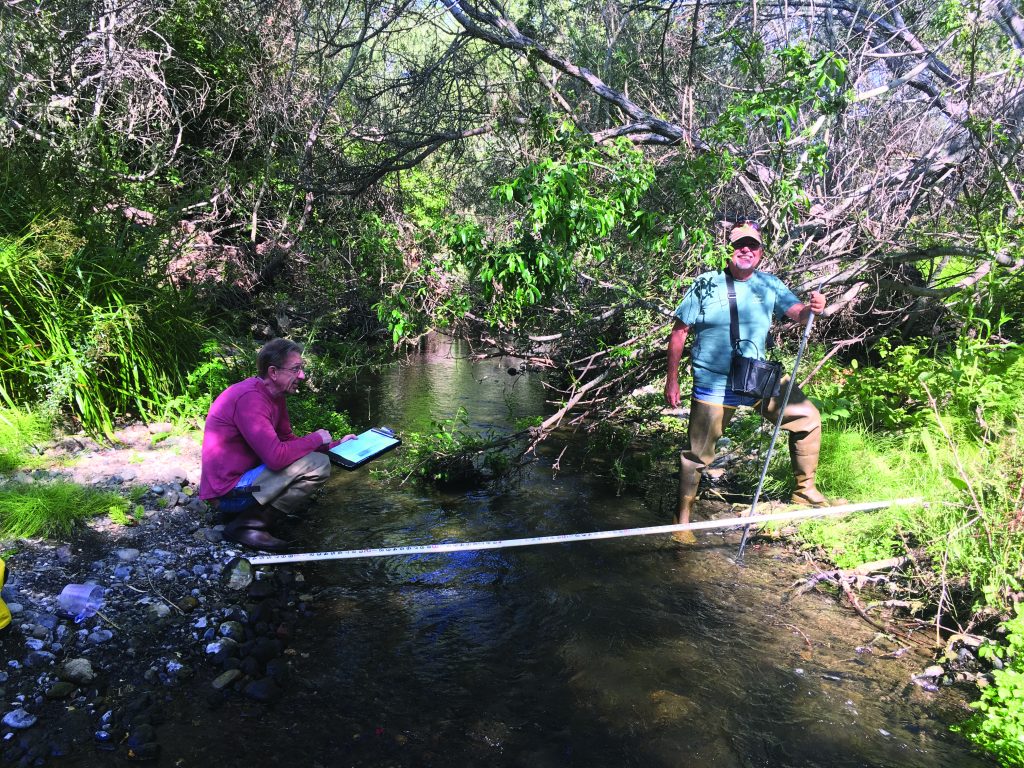
Creek health is important because these waters provide habitat for fish, plants, and other aquatic life. One of the ways we monitor creeks is to head out each spring to collect macroinvertebrates (including insects and snails) that spend at least a portion of their life cycle in the creek. Some of these species are extremely sensitive to pollution, so if we find them in a creek, the water quality is likely good. Other species are very tolerant of pollution, so if these are all that we find in a creek, the water quality is likely poor.
The sampling process is very labor intensive and has only been possible due to the support of many volunteers over the years. To learn more about the monitoring and how you can help, check out this Estuary Program blog post.
What Does the Data Show?
Upper Chorro Creek
Creek Health Score: Fair
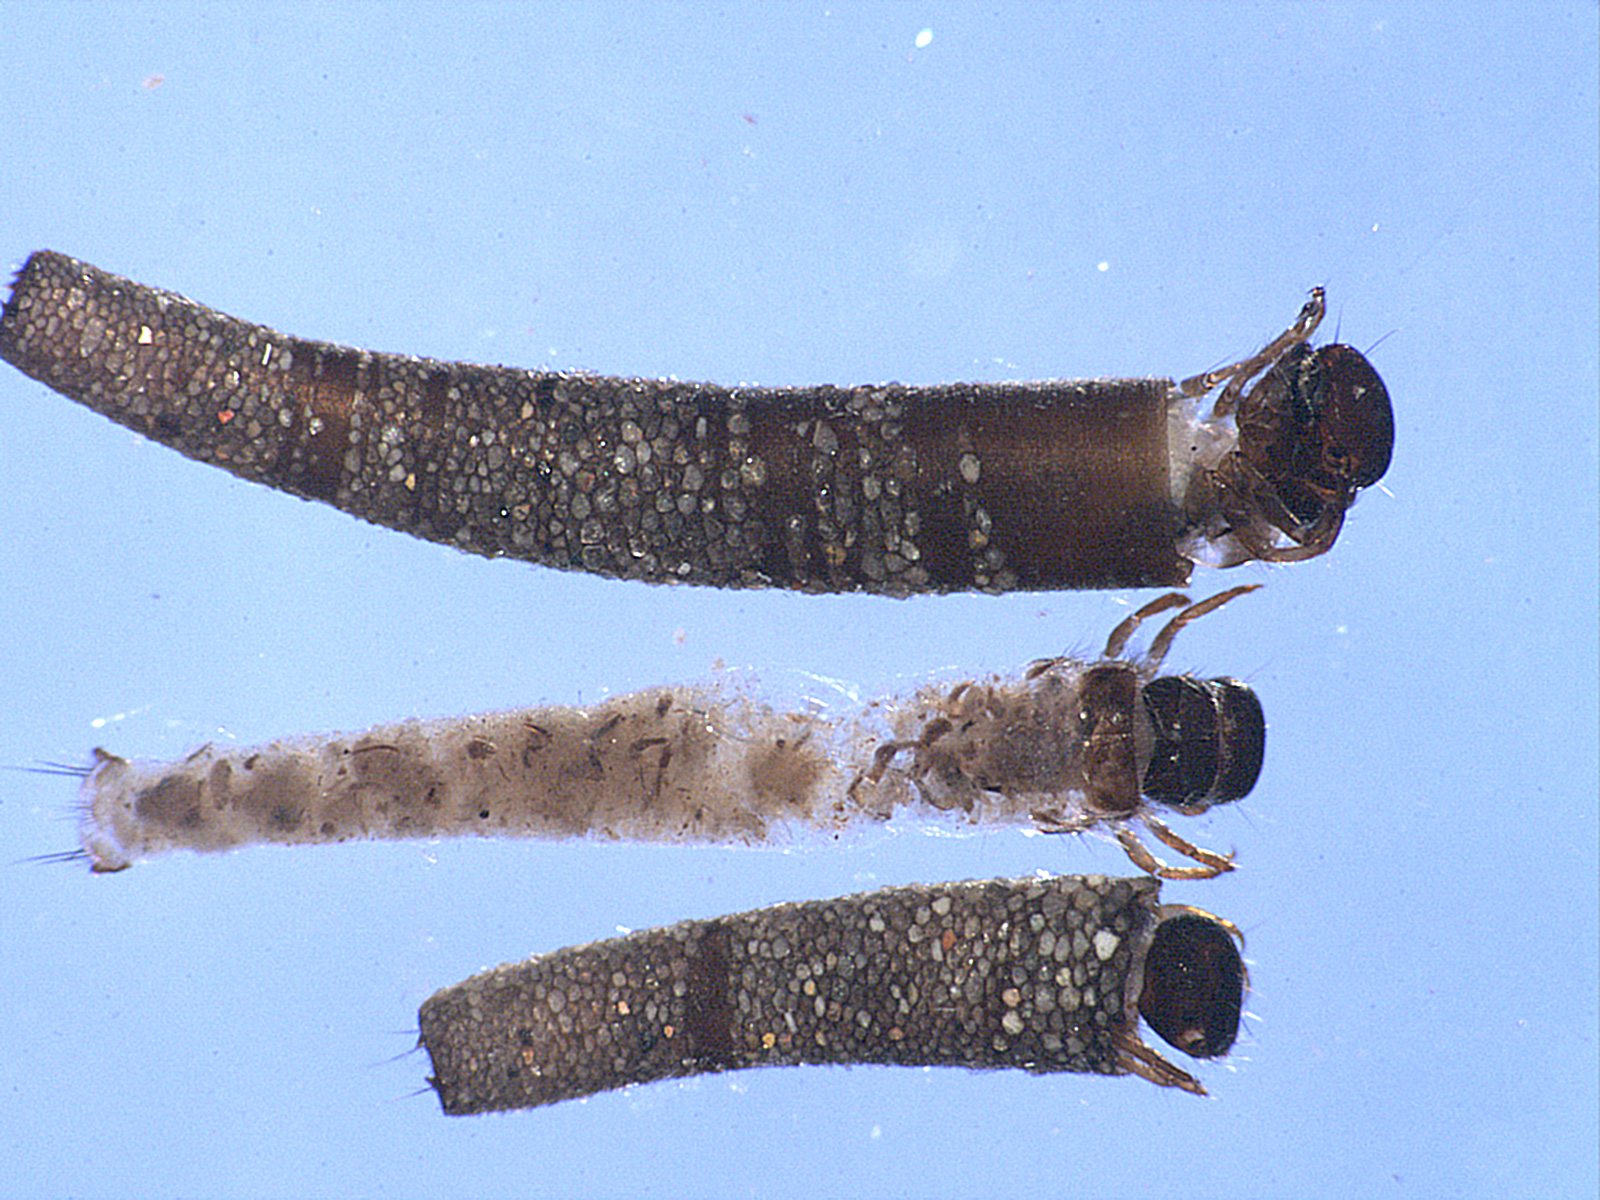
A Common Macro: Caddisfly (Trichoptera hydropsyche)
Fun Fact: Known as common netspinners, these caddisflies prefer to live in moving waters. They construct a structure called a catchnet that snags food from the water.
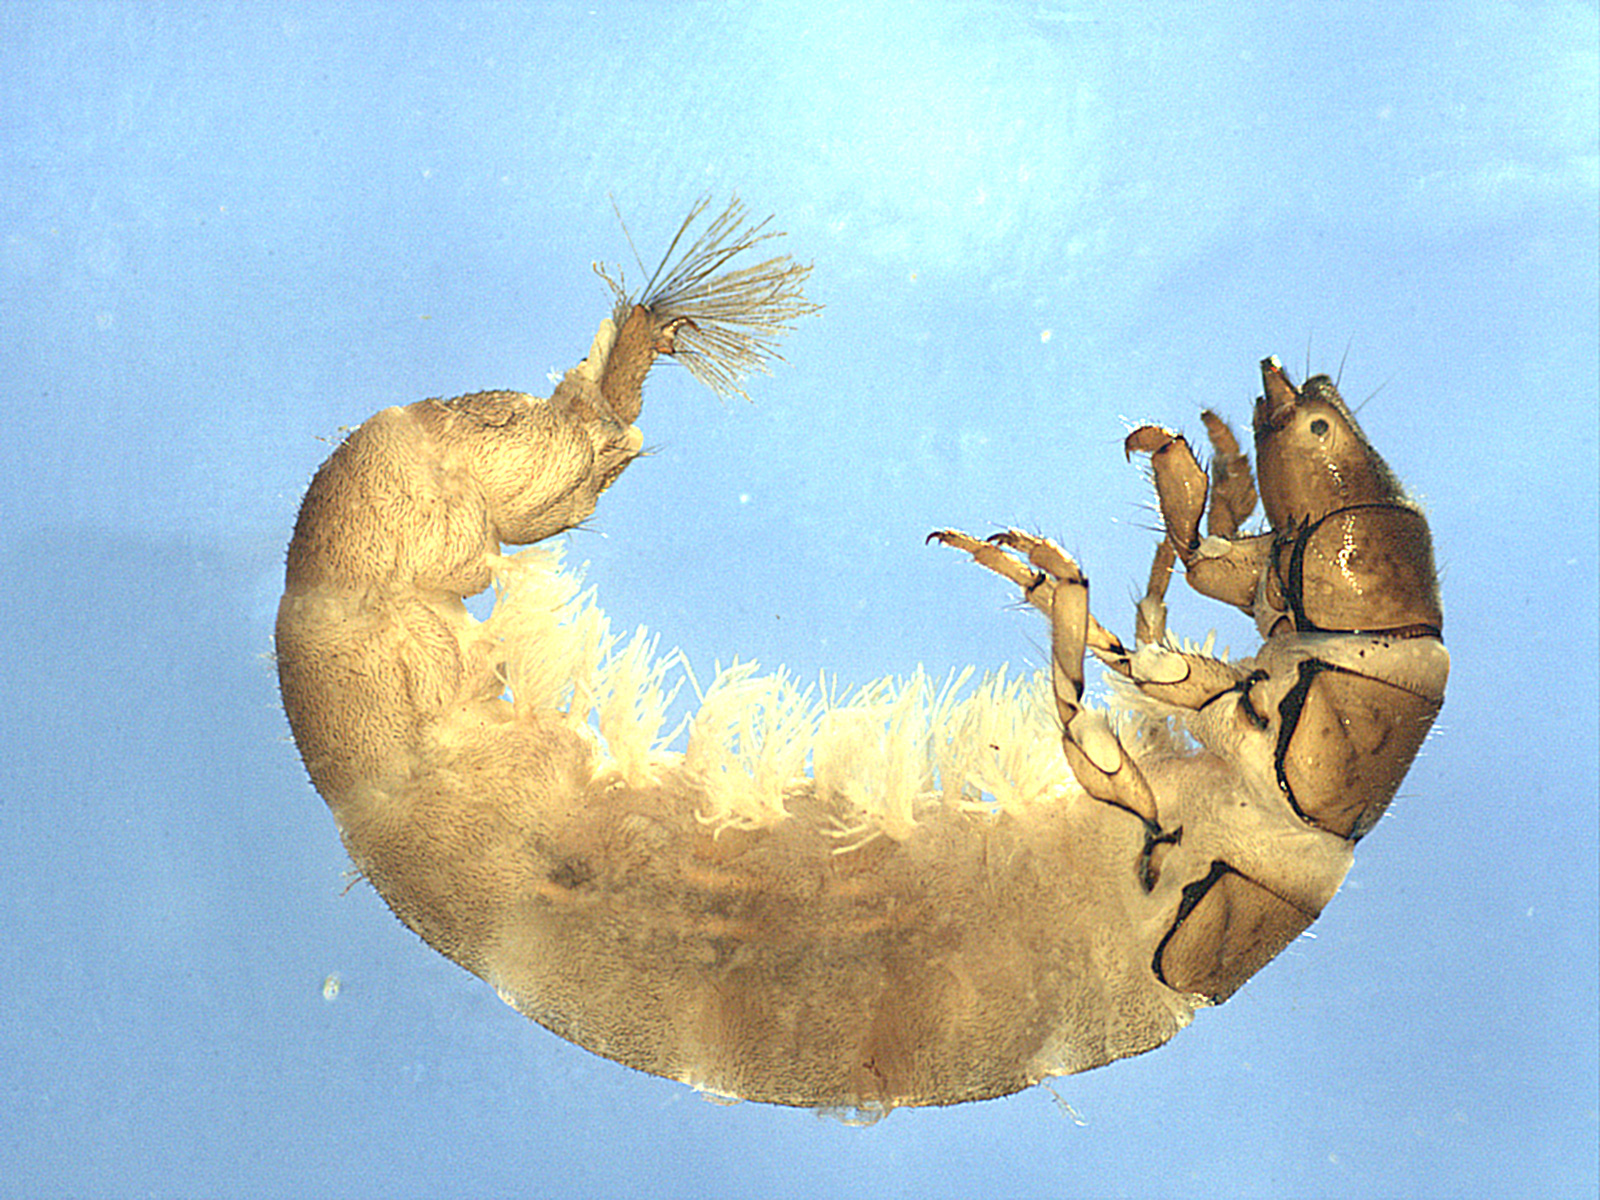
Middle Chorro Creek
Creek Health Score: Poor
A Common Macro: Caddisfly (Trichoptera hydropsyche)
Fun Fact: Common netspinners are the most abundant caddisfly in many parts of North America. Many types occur in waters where trout live, and flyfishers use fly tie patterns based on common netspinner larvae to attract fish.
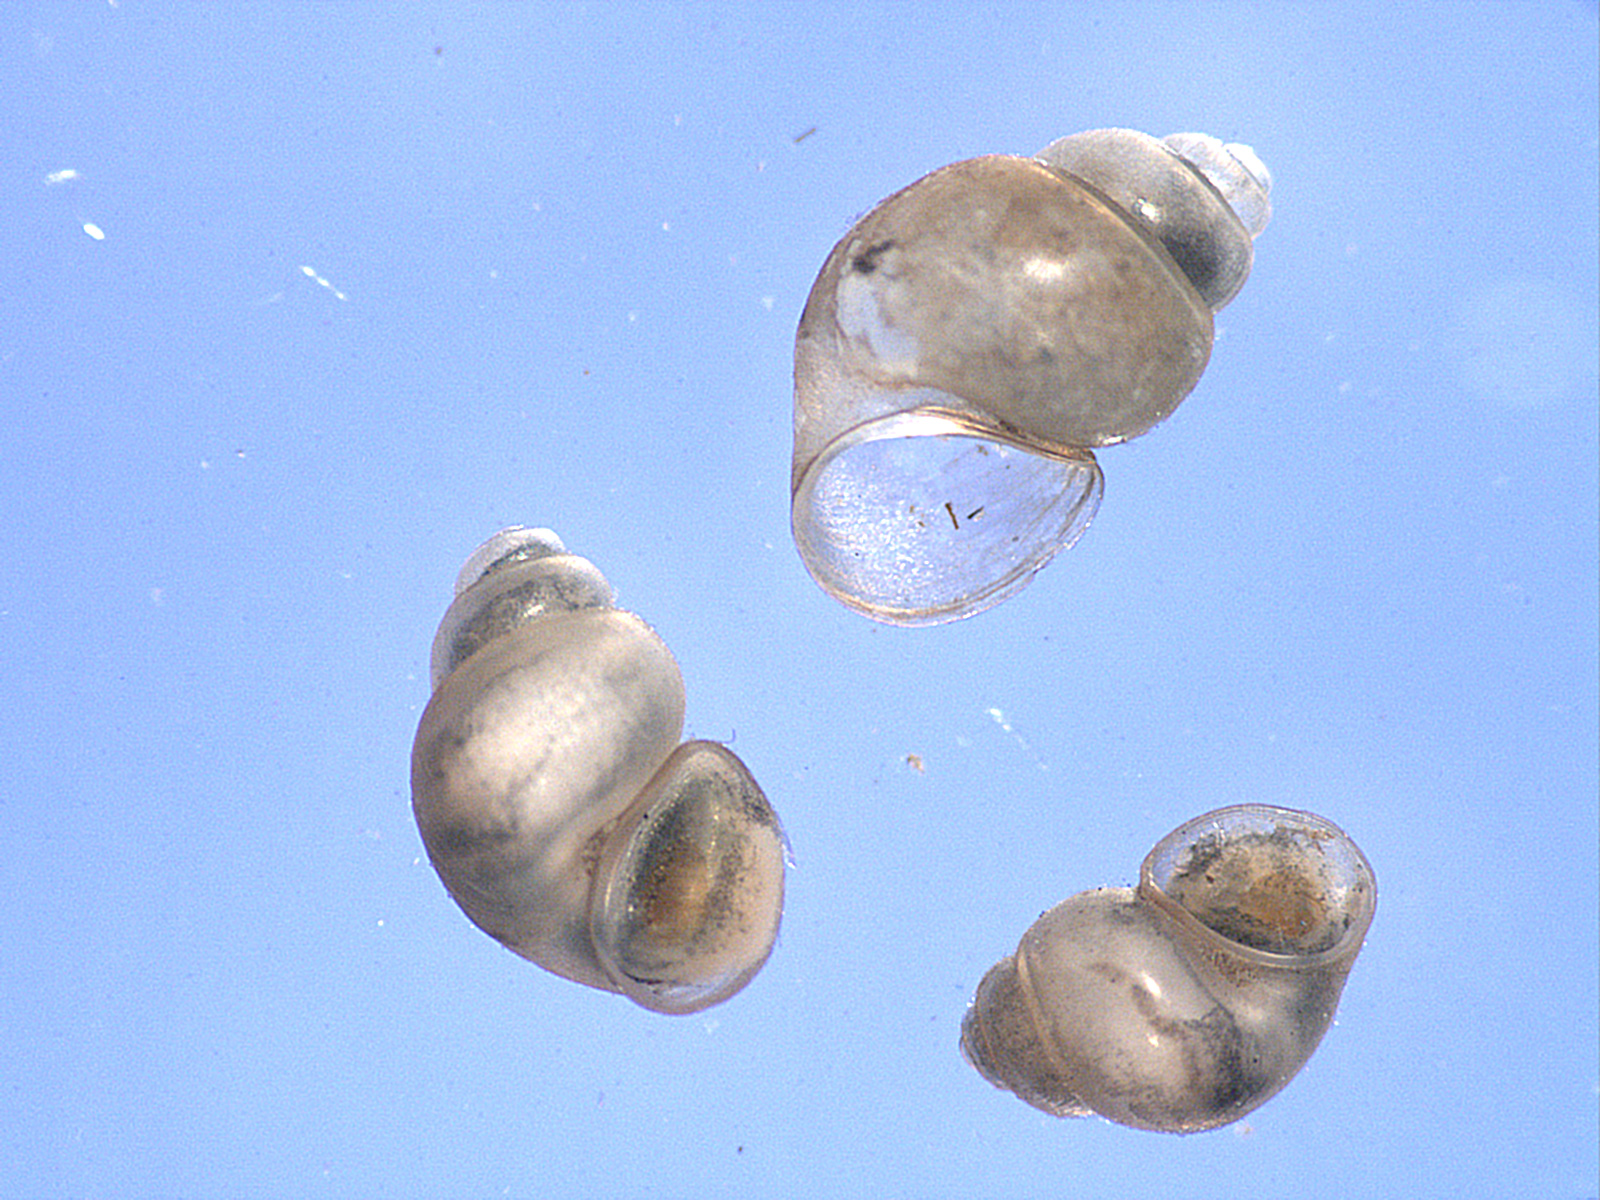
Lower Chorro Creek
Creek Health Score: Fair
A Common Macro: Snail (Gastropoda physa)
Fun Fact: These freshwater snails have lungs for breathing rather than gills. A high population of these snails indicates the presence of pollution.
Dairy Creek
Creek Health Score: Good
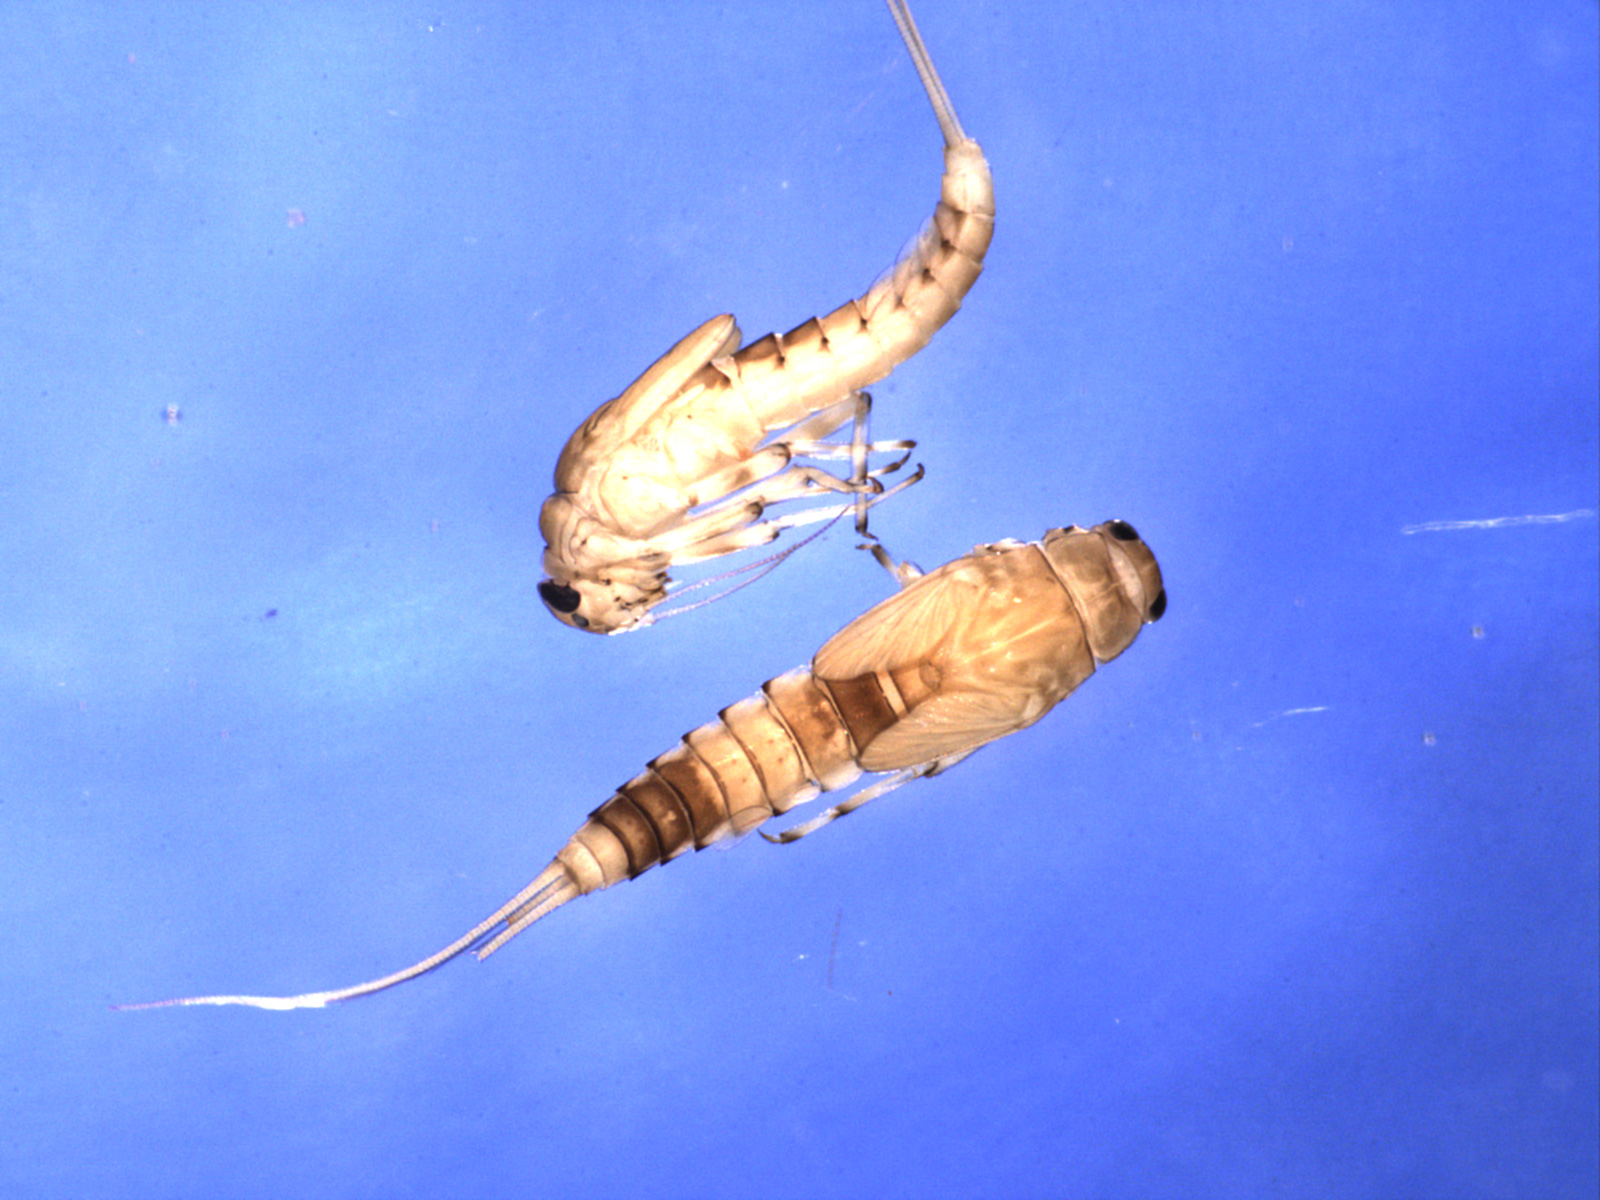
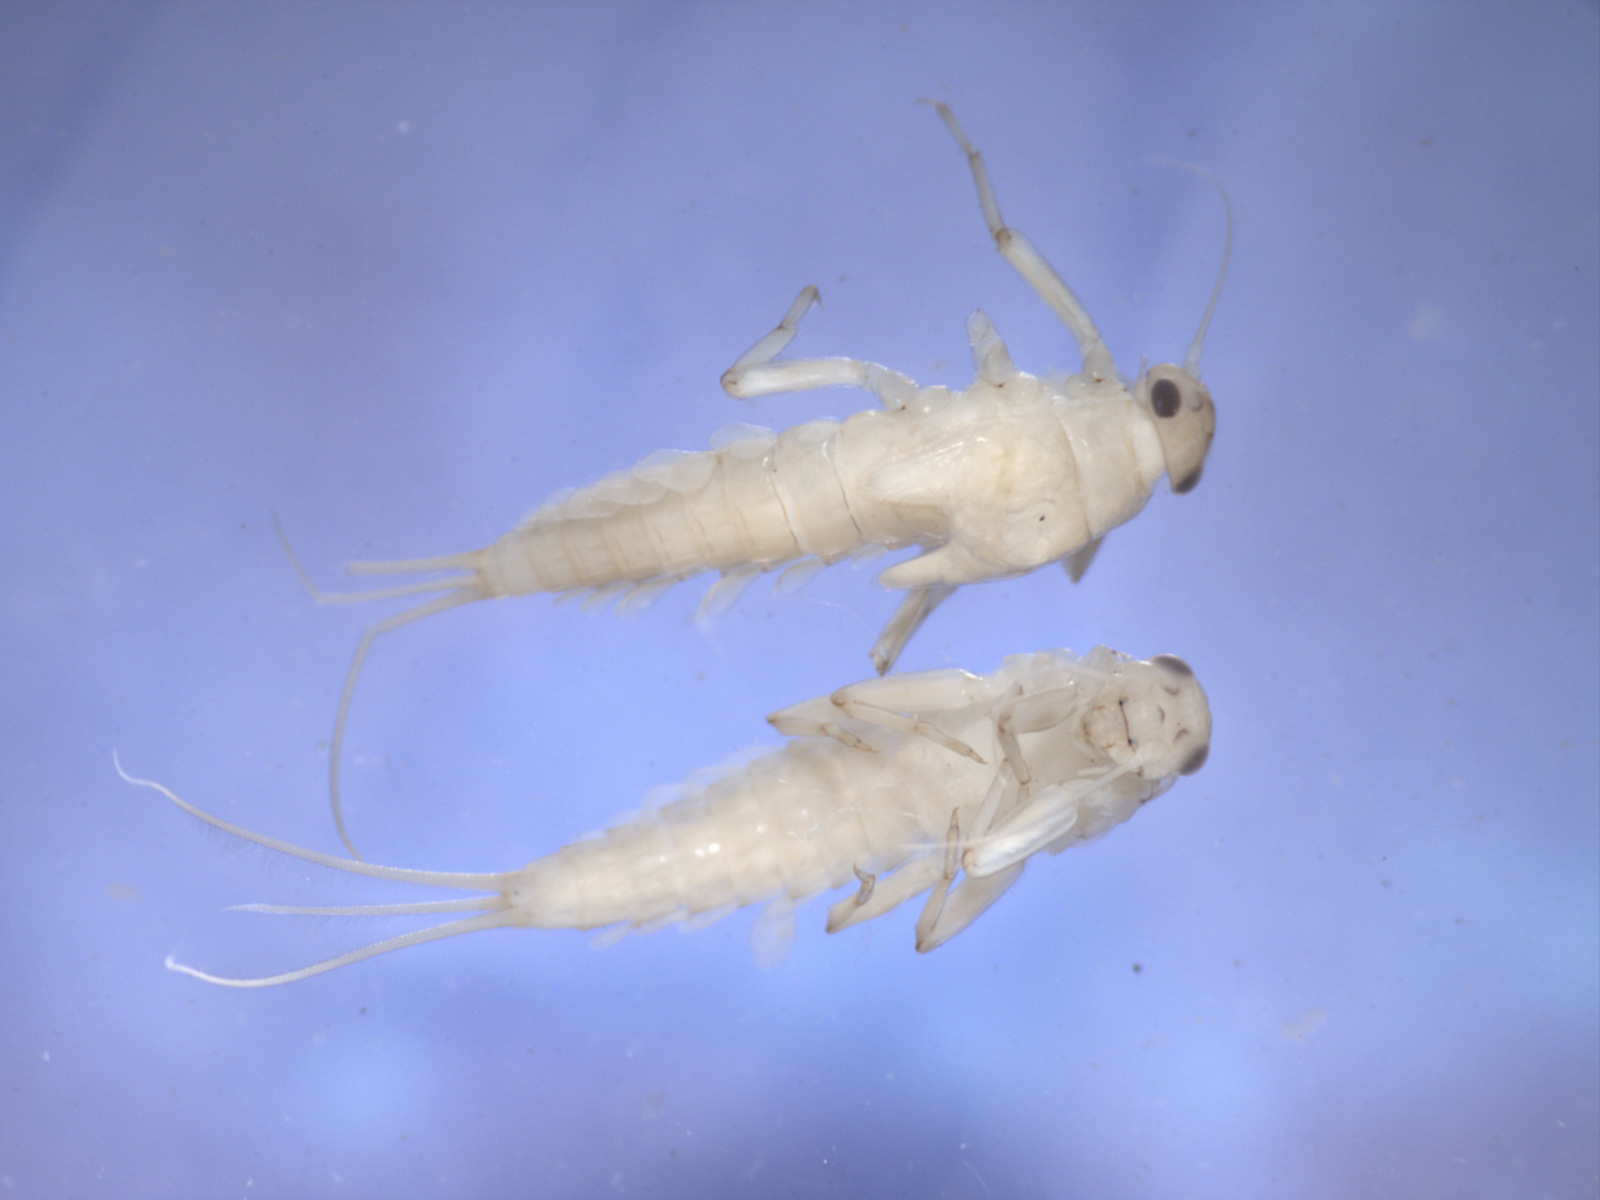
A Common Macro: Small Minnow Mayflies (Baetis spp.)
Fun Fact: Baetis orient themselves head first into the current and can swim in strong currents. They are the most fishlike of the aquatic insects.
Pennington Creek
Creek Health Score: Good
A Common Macro: Caddisfly (Trichoptera micrasema sp.)
Fun Fact: Known as humpless case makers, these caddisflies prefer to live in flowing water. They excrete a silk material from salivary glands near their mouth that binds together materials like rocks and twigs to create a protective case.
Walters Creek
Creek Health Score: Fair
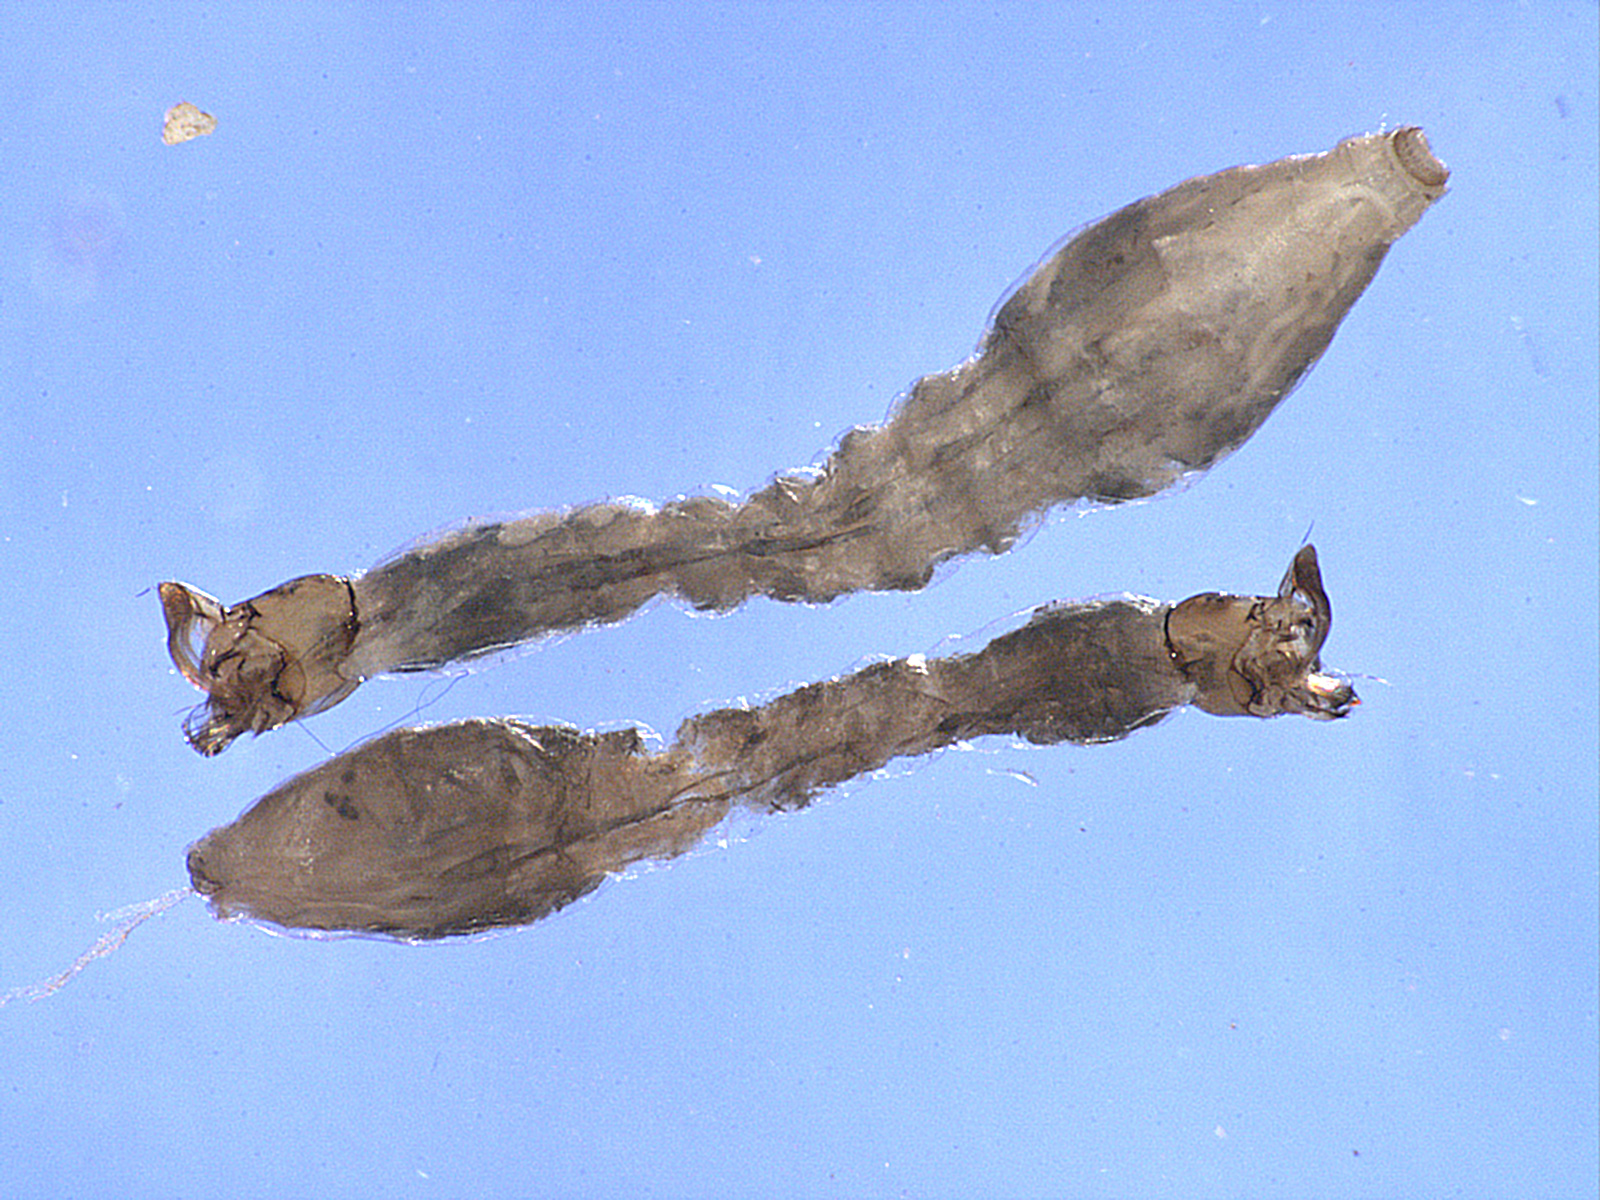
A Common Macro: Black Fly (Simulium spp.)
Fun Fact: Easily identified by their swollen abdomen, black fly larvae attach by the ends of their abdomens to rocks or vegetation. They hang with their heads facing downstream and filter food from the flowing water with their mouth brushes.
San Luisito Creek
Creek Health Score: Good
A Common Macro: Mayfly (Baetis tricaudatus)
Fun Fact: Many species of Baetis are parthenogenetic, which means their eggs can develop without fertilization. In some northern populations, scientists have documented only females.
San Bernardo Creek
Creek Health Score: Good
A Common Macro: Mayfly (Baetis tricaudatus)
Fun Fact: Over 100 species of this mayfly occur in North America. Fly fishing lures based on this mayfly are popular on trout streams throughout North America.
Upper Los Osos Creek
Creek Health Score: Good
A Common Macro: Small Minnow Mayflies (Baetis spp.)
Fun Fact: Fishermen often distinguish adult insects by the way their wings appear at rest. You might hear adult mayflies referred to as upwings. This is because their triangular wings stretch straight up above their bodies when they are at rest.
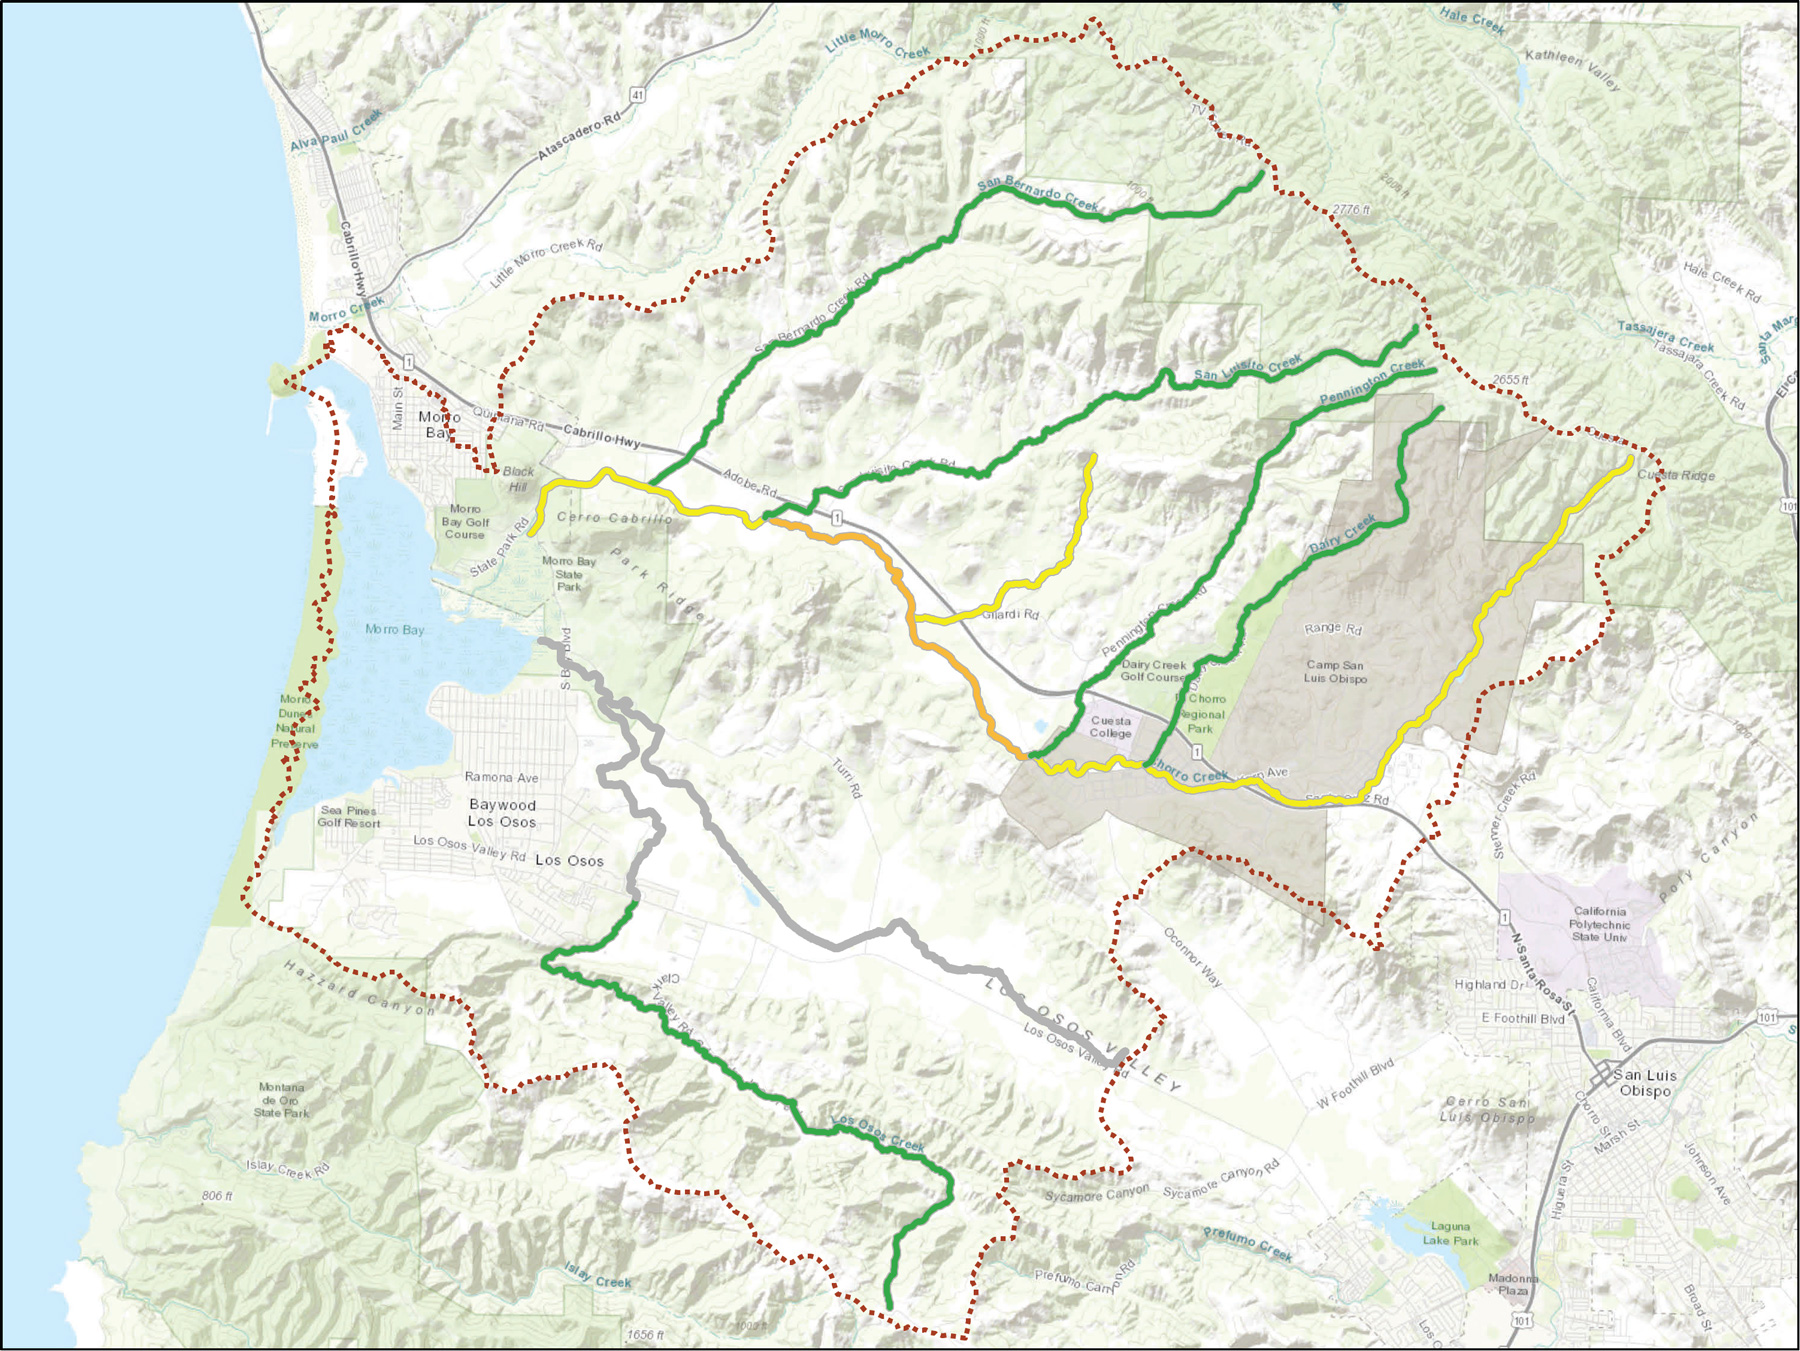
This map shows the average of index scores for each creek or stretch of creek in the watershed with data going back to the 1990s. Those colored green have Good scores and can support sensitive species of macroinvertebrates. Those colored yellow have Fair scores, meaning that the most sensitive species are unlikely to thrive. And those colored orange have Poor scores, where sensitive species are unlikely to be found. Upper Chorro, lower Chorro, and Walters Creek have Fair scores. This represents an improvement on Walters Creek. Scores are Good on the tributaries to Chorro Creek and in the Los Osos Valley above Los Osos Valley Road.
Creek Health
-
Very Good/Good
-
Fair
-
Poor
-
Very Poor
-
Unknown
-
Watershed Boundary
We thank the Harold J. Miossi Charitable Trust for their generous support of this bioassessment survey effort over the years.
Data Notes
Scoring: The Central Coast Regional Water Quality Control Board (Water Board) updated the scoring method for assessing the status and trends of waterbodies. The analyses look at all available data, some of it going back to the 1990s. More information on the methods of analysis and results for other areas on the California Central Coast are available at the Water Board website.
Bay Oxygen: The bay oxygen readings were collected by Estuary Program volunteers via kayak using handheld meters by YSI, either the model 85 or the model 2030. For the 2020 report, the Magnitude Exceedance Quotient (MEQ) method was used and included all data going back to 2002. The trend for bay oxygen data was determined by calculating the MEQ analysis using data for all sites, both prior to January 1, 2014 and after that date for comparison. The bay wide trend was Stable (represented by a circle), meaning no real change from before as compared to after January 1, 2014. The overall bay dissolved oxygen condition was Poor (represented by the color orange of the symbol).
Nitrates: The creek nitrate scores for the 2020 report differed greatly from the 2014 report, which is the last time the Estuary Program conducted the analysis. The difference was due to changes in the Water Board method of analysis, rather than a change in nitrate conditions on local creeks. For the 2020 report, the Magnitude Exceedance Quotient (MEQ) method was used and included all data going back to 2001. For the 2014 report, the analysis included five years of data (2008 to 2012) and determined whether a certain percent of the data was above or below the thresholds of 1 mg/L (protective of aquatic life) and 10 mg/L (protective of human health). The Water Board is adopting the MEQ method because it takes into account by how much a reading exceeds the threshold target value and how many of the readings exceed the threshold target value. This revised approach provides better information on the health of a water body.
In determining the trend in nitrate data, it was difficult to distill the status for the entire watershed down to just one symbol. We decided that the best approach would be to represent the watershed nitrate status with the conditions on the sites lowest down (closest to the bay) on our two main creeks, Chorro and Los Osos. Because we lacked adequate data from lower Los Osos Creek due to tidal influence (bay water is pushed up the creek by the tides, making it difficult to measure the nitrates in the freshwater coming downstream), we decided to represent the trend in nitrate data with our most downstream monitoring site on Chorro Creek, which is located at the site known as Twin Bridges. This is where Chorro Creek passes under the South Bay Boulevard bridge. Using the Twin Bridges nitrate data, the results were divided into two groups: data before January 1, 2014 and data after that date. The status was calculated for each group of data, and the readings since the cut-off date have shown some improvement. Thus, the trend went from Very Poor nitrate results to Poor and the indicator symbol was an upward pointing arrow. The symbol has a red square (representing Very Poor conditions of data before January 2014) and an orange triangle (representing Improving but Poor conditions in data since January 2014).
If we had multiple sites on a creek, we combined the data to create a single score for each creek and that score was extrapolated to apply to the entire creek. The exception is Chorro Creek, where the creek was divided into upper, middle, and lower segments based on hydrological characteristics, inputs, and other factors.
Creek Health: The bioassessment data is collected following a detailed technical protocol developed by the state of California. The bioassessment samples are sent to a taxonomy lab for sorting, counting, and identification. The lab provides raw scores (how many of each family or genus was present) as well as metrics calculated with the raw data. One of these metrics is the Southern California Index of Biotic Integrity (IBI) score, and this is the metric that the Estuary Program used for our analysis. We calculated the average of all available data, some going back to the 1990s, and compared it to the scoring criteria for the IBI scores which are as follows: Very Good (80 to 100), Good (60 to 79), Fair (40 to 59), Poor (20 to 39), and Very Poor (0 to 19). The indicator symbol for Creek Health is a circle because the trend has been Stable over time. The color is grey indicating Unknown status, because we lack data from areas that we expect are heavily impacted, specifically lower Los Osos and Warden Creeks.
In creating the map, if we had multiple sites on a creek, we combined the data to create a single score for each creek and that score was extrapolated to apply to the entire creek. The exception is Chorro Creek, where the creek was divided into upper, middle, and lower segments based on hydrological characteristics, inputs, and other factors.
How to Read Estuary Health Symbols
The Estuary Health Symbols represent how the status of each question is changing over time. A round symbol indicates that the trend is stable. An arrow indicates an improving trend (up arrow) or a worsening trend (down arrow). The color of the base of the arrow indicates the status of historical data and the color of the triangular part of the arrow indicates the status of the newer data. The color of the symbol indicates the status as follows: Good/Very Good (green), Fair (yellow), Poor (orange), Very Poor (red), and Unknown (grey).
-
This symbol indicates that the water quality was Very Poor and has improved to Poor.
-
This symbol indicates that the trend is stable but we lack adequate data to assign a status.
-
Very Good/Good
-
Fair
-
Poor
-
Very Poor
-
Unknown