Does Morro Bay support healthy eelgrass beds?
Yes, the amount of eelgrass in the bay has increased rapidly over the last few years, with acreage surpassing pre-decline levels and likely exceeding the maximum levels that can be sustainably supported in the bay.
Eelgrass Status in the Estuary
If you’ve spent any time on the bay lately, you’ve seen the long blades of eelgrass that are now abundant in our waters. This seagrass puts down roots in the bay floor, helping to reduce erosion and improve water quality. This plant also sequesters carbon and serves as habitat and a food source for wildlife. After the near total loss of eelgrass in Morro Bay, its current abundance is remarkable.
For over two decades, the Estuary Program has worked with partners to study and monitor eelgrass. Mapping efforts indicated an increase from just 13 acres in 2017 to 750 acres in 2023. The reasons for the decline and rapid recovery are complex and likely include many factors such as changes in water quality and elevation. The 2023 acreage likely exceeds what the bay can sustain long-term. Work on an updated eelgrass map is currently underway, and we expect eelgrass acreage to decline slightly to a more sustainable level.
Eelgrass Acreage: 2007, 2017, and 2023
Tracking Morro Bay's Eelgrass Acreage
Estimating the total acreage of eelgrass in the estuary is no small feat, and the mapping method has changed over time. Early surveys in the 1960s involved triangulation with a compass to create hand-drawn maps. More recently, aerial imagery collection is the technique most commonly used. The 2023 eelgrass map indicating 750 acres of eelgrass was created with a combination of drone imagery to capture intertidal eelgrass and sonar data to map the deeper beds.
In an effort to create a low cost and easily repeatable method of mapping, we have partnered with Cal Poly researchers to collect drone imagery at the lowest tides of the year, when the majority of intertidal eelgrass is exposed. While the task of annotating imagery has historically been conducted manually, it can take hundreds of hours to delineate the eelgrass beds. To automate this mapping process, a team of Cal Poly and Stanford researchers created a machine learning network, which is a type of artificial intelligence that is trained using data. By using past eelgrass maps, the team was able to train the AI to identify eelgrass in bay imagery to obtain reliable acreage estimates. They published the results of their work in 2023.
Machine learning is most effective when there is ample data available to train the network to recognize the nuances and unusual cases that might otherwise be missed in a smaller, simpler dataset. To improve upon their first classification network, the team combined four years of imagery (2018 to 2021) to train an updated network. They also compared multiple machine learning algorithms to identify the one that provided the highest accuracy when classifying eelgrass acreage on the 2022 drone map. Preliminary findings indicate that the new networks trained on four years of data are outperforming the old network, especially when it comes to consistently identifying eelgrass across density gradients and bed sizes. A full publication describing this process is expected soon.
Bay Elevation and Eelgrass
The Estuary Program partnered with Dr. Ryan Walter of Cal Poly’s Physics Department to better understand the relationship between eelgrass and bay elevation change. The figure on the left shows the differences in elevation from 2010 (pre-eelgrass decline) to 2019 (start of eelgrass recovery). Following eelgrass loss, the areas shown in red indicate where erosion occurred and the bay floor became deeper. This is a common result of eelgrass loss since the plant’s root structure stabilizes sediment on the bay floor, and the floating eelgrass blades help dampen the erosive effects of the currents and waves. This analysis showed erosion occurring at over 90% of the locations where eelgrass was lost (Walter et al. 2020).
It’s possible that the erosion and deepening of large areas that had previously supported eelgrass was key in driving the plant’s recovery. Eelgrass thrives in a “Goldilocks” depth range. If the waters are too deep, the plants can’t get enough light for photosynthesis. But if the waters are too shallow, eelgrass may be dried out when exposed at low tides. It is possible that the erosion and subsequent deepening returned parts of the bay to the right depth for eelgrass to survive and thrive.
In areas where eelgrass returned to the bay, the analysis from 2019 to 2022 (illustrated in the figure on the right) shows that these parts of the bay (shown in blue) trapped sediment (became shallower) since eelgrass was once again stabilizing the bay floor.
Improving Our Understanding of Potential Threats to Eelgrass
Eelgrass and other seagrasses around the world face many challenges, including warming ocean temperatures and degrading water quality. Another of these potential threats is wasting disease, which caused massive eelgrass die-offs in the Atlantic Ocean nearly a hundred years ago. Since 2018, students and faculty from Cuesta College have been studying Morro Bay eelgrass and the occurrence of the slime mold Labyrinthula zosterae. that causes eelgrass wasting disease. Led by Drs. Laurie McConnico and Silvio Favoreto, this project is focused on studying the distribution of L. zosterae throughout the estuary and understanding its role in eelgrass wasting disease.
The latest research from the Cuesta lab has shown that L. zosterae in Morro Bay is not a single uniform organism but rather a diverse group of strains. Using a molecular technique called RAPD (Random Amplified Polymorphic DNA), researchers generated “DNA fingerprints” of different L. zosterae isolates from Morro Bay. The figure above shows the full process of isolating L. zosterae from eelgrass blades and running the RAPD analysis, while the image below shows how the DNA fingerprints vary from isolate to isolate, revealing substantial genetic diversity within the pathogen community. This diversity may help explain why some eelgrass meadows experience more severe disease outbreaks than others and underscores the importance of monitoring both the eelgrass host and the L. zosterae pathogen in maintaining healthy coastal ecosystems.
Bay Fish Populations Shift with Eelgrass Abundance
Morro Bay’s eelgrass beds provide essential shelter and nursery grounds for many species of fish. Monitoring efforts have assessed fish communities at different stages of eelgrass abundance, illustrating how fish species respond to changes in habitat. In 2006 and 2007, Dr. John Stephens of Occidental College conducted a baywide fish study when eelgrass covered approximately 344 acres of the bay. Nearly a decade later, Dr. Jennifer O’Leary of Cal Poly repeated this work when eelgrass had declined to only 13 acres. In 2023 and 2024, the Estuary Program completed similar monitoring when eelgrass was at a record-high of nearly 750 acres.
During the most recent monitoring effort, over 8,000 fish representing 24 unique species were sampled near the shoreline, within the intertidal flats, and in Morro Bay’s open channels. Bay pipefish, a slender green fish that resembles eelgrass, were the most abundant species. In contrast, during periods of low eelgrass acreage, species that prefer bare mud and sand like speckled sanddab and staghorn sculpin were much more common. These results highlight how eelgrass coverage has a direct influence on fish communities.
To see more data from our bay fisheries monitoring work, see the State of the Bay data dashboard.
Monitoring Bay Fish Biodiversity with DNA
Traditional fish monitoring requires capturing fish with large nets, identifying and measuring them, then releasing them back into the water unharmed. In recent years, techniques have emerged that can detect species without any physical handling. For the past three years, the Estuary Program has participated in the Pacific eDNA Coastal Observatory (PECO), a collaborative effort to use environmental DNA to monitor fish biodiversity in seagrass beds. This project includes participants from Alaska to Southern California and was piloted by the Hakai Institute in collaboration with the Sunday Lab at McGill University. The project aims to understand how near-shore fish communities are shifting across geographical regions over time.
Monitoring fish biodiversity in seagrass beds ranging over such a wide range is no small feat. To capture an annual snapshot of fish species on a reasonable budget, PECO uses environmental DNA (eDNA). This refers to genetic material that organisms naturally shed into their environment through skin, scales, mucus, waste, or other biological processes. We can detect eDNA by collecting water samples, then filtering the water through a filter to capture very small fragments of DNA left behind by fish and other organisms. The filter is then preserved and analyzed to determine which species were present in the water sample.
Preliminary results from this study suggest that Morro Bay is an important transition point for fish species along the Pacific Coast, providing a natural boundary where northern and southern fish species overlap. This transition zone creates a unique biodiversity hotspot for a variety of species and might also provide insight into how fish species may shift in response under changing climates.
Exploring Eelgrass and Macroalgae Interactions
In addition to drone flights, the Estuary Program has been conducting field surveys to monitor eelgrass beds since 2005. These surveys provide an up-close look at eelgrass health and a way to track physical changes at our monitoring sites. In 2020 and 2021, these surveys picked up a notable increase in macroalgae, commonly called “seaweed,” at multiple monitoring sites. While macroalgae is a natural part of the estuarine ecosystem, this uptick in abundance raised concerns for the health of recently recovered eelgrass. Both eelgrass and macroalgae need adequate space and sunlight to thrive. Certain types of macroalgae, such as the prolific Ulva or “sea lettuce,” can form large mats that cover entire eelgrass beds and smother them by preventing light from reaching the eelgrass (Gustafsson & Bostrom 2014). Research on the east coast has also shown that the thickness of algal mats can be a useful indicator for their impact on eelgrass health (Hauxwell et al. 2001).
To better understand the interactions between eelgrass and macroalgae within the estuary, a new monitoring effort was initiated in 2023. In the field, we identify the different types of macroalgae present and the extent of coverage within survey areas. We also collect algae samples that are cleaned and dried upon returning to land to obtain the biomass of algal material. Several eelgrass health metrics are recorded so they can be compared with macroalgae abundance.
In the first two years of the project, surveys were conducted three times a year to track the seasonality of algae growth. So far, we have found that macroalgae biomass peaks in the summer, and despite our expectations, eelgrass density and macroalgae abundance are positively correlated (at least for now). It appears that as eelgrass has returned to the estuary, it has been “capturing” more macroalgae within its tangled network of blades as the algae drifts back and forth with the tides. This is further supported by our observations of notably higher accumulation of algae within eelgrass beds as opposed to unvegetated patches of sand nearby. Currently, eelgrass and macroalgae seem to be coexisting, but summer monitoring will continue to track how this relationship progresses over time.
Data Notes
The eelgrass maps from 2007 and 2017 were created using multi-spectral imagery collected in the fall and an automated classification scheme. The map for 2023 was created using drone imagery and sonar data collected in the spring and an enhanced classification scheme. All three maps were ground-truthed by Estuary Program staff. The 2019 baywide topobathy lidar survey and 2022 lidar survey were conducted in partnership with NOAA’s Office of Coastal Management. Analysis of the elevation changes in conjunction with eelgrass loss was conducted by Dr. Ryan Walter of Cal Poly. The results from the baywide fish studies utilize data collected by Occidental College, Cal Poly/Sea Grant, and the Estuary Program. The bars in the graph represent two particular species caught as a percent of total fish captured in that habitat type.
References
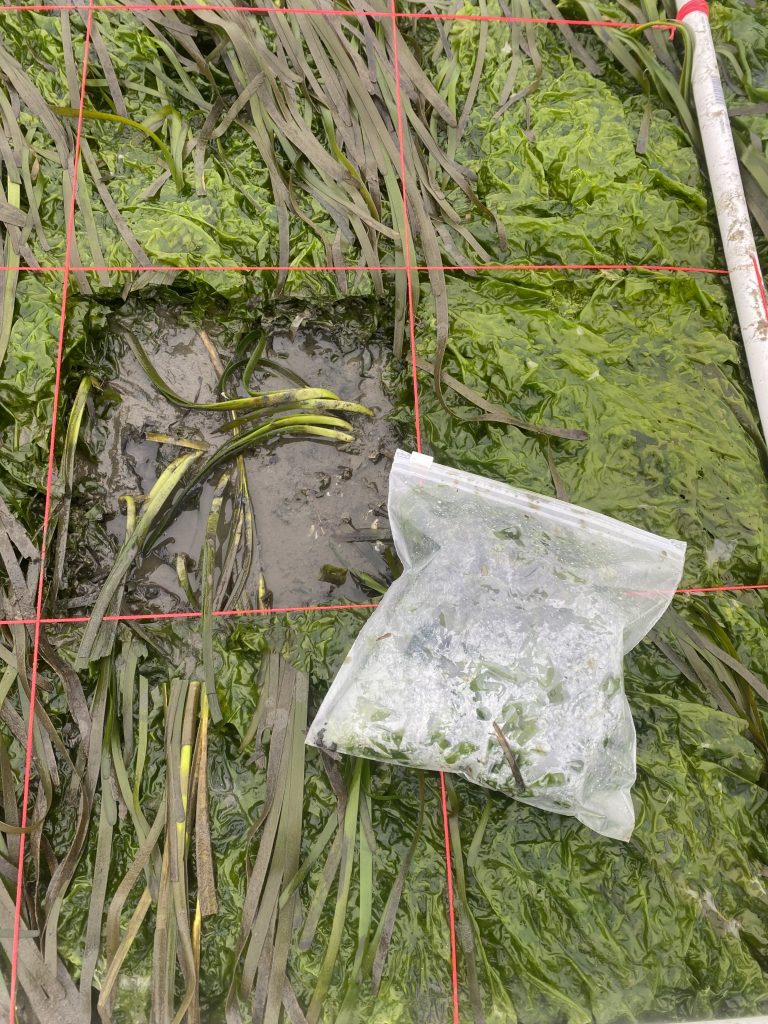
Field Updates Blog Post (Taking a Closer Look at Macroalgae Within the Estuary): https://www.mbnep.org/2023/06/09/field-updates-may-2023-taking-a-closer-look-at-macroalgae-within-the-estuary/
Field Updates Blog Post (Examining the Driving Factors Behind Trends in Algae Abundance): https://www.mbnep.org/2024/04/12/field-updates-march-2024-examining-the-driving-factors-behind-trends-in-algae-abundance/
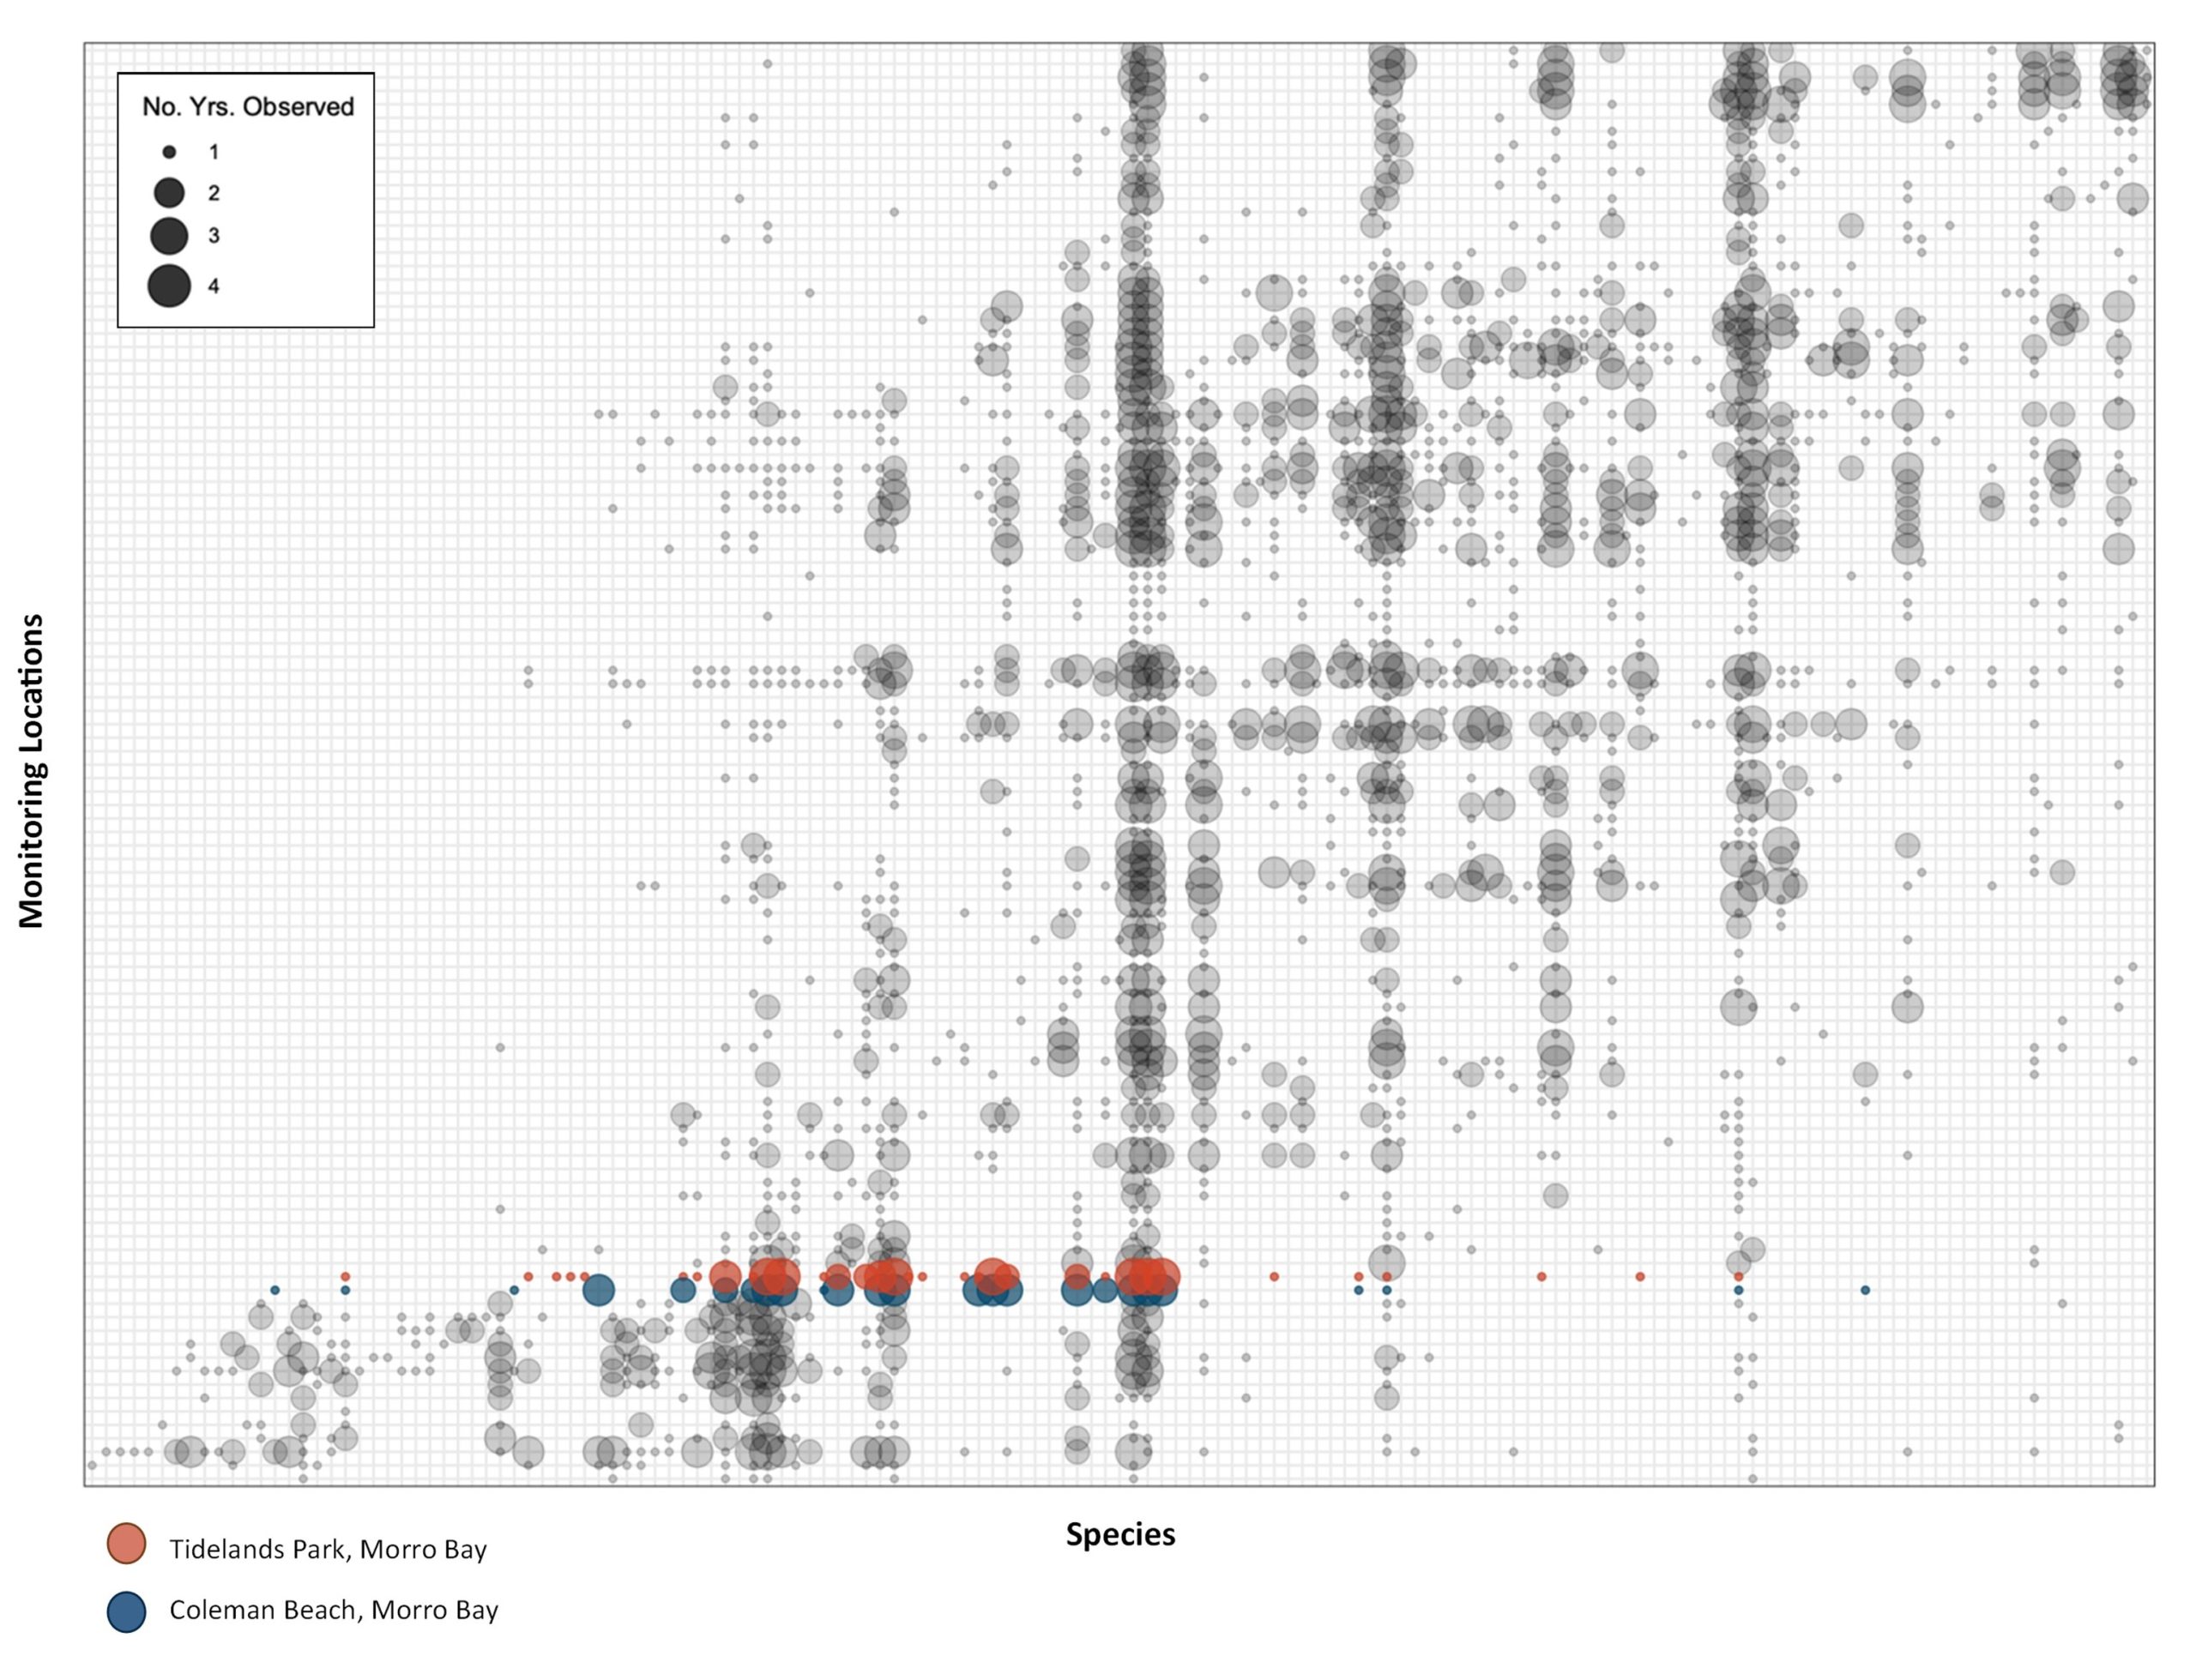
Field Updates Blog Post (Insights from Two Years of Macroalgae Monitoring): https://www.mbnep.org/2025/07/11/field-updates-july-2025-insights-from-two-years-of-macroalgae-monitoring/
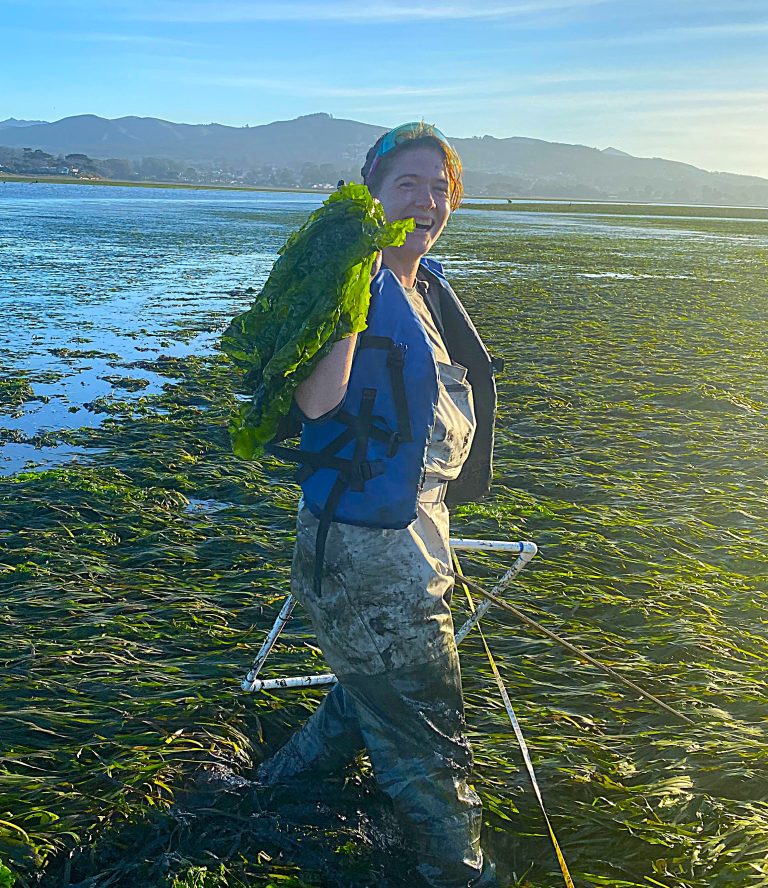
Field Updates Blog Post (Fish Response to Eelgrass Recovery in Morro Bay): https://www.mbnep.org/2025/03/14/field-updates-fish-response-to-eelgrass-recovery-in-morro-bay/
Gustafsson, C. & Bostrom, C. 2014. Algal mats reduce eelgrass (Zostera marina L.) growth in mixed and monospecific meadows. Journal of Experimental Marine Biology and Ecology. https://doi.org/10.1016/j.jembe.2014.07.020
Hauxwell, J., Cebrian, J., Furlong, C., Valiela, I. 2001. Macroalgal Caonopies Contribute to Eelgrass (Zostera marina) Decline in Temperate Estuarine Ecosystems. Ecology. https://doi.org/10.1890/0012-9658(2001)082[1007:MCCTEZ]2.0.CO;2
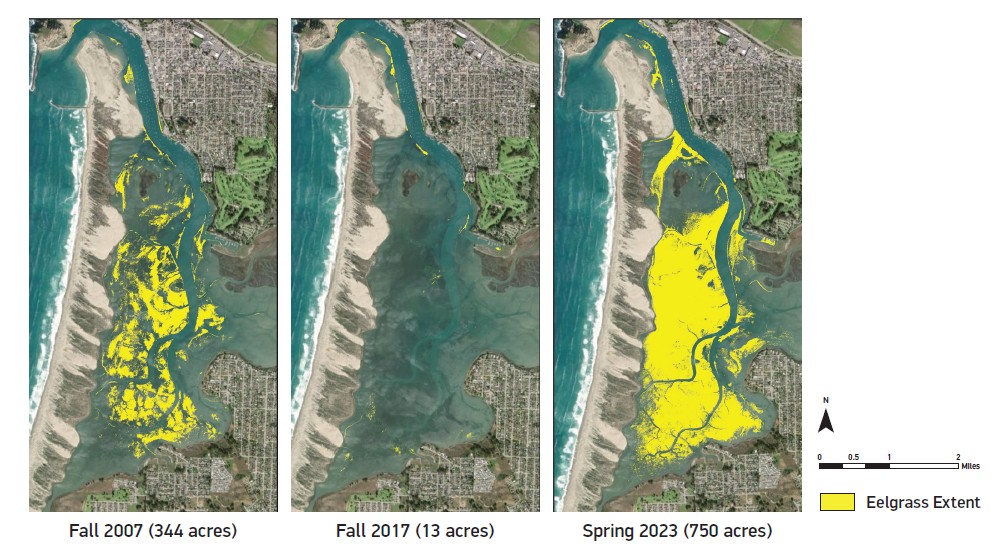
Morro Bay Eelgrass Report 2023: https://library.mbnep.org/wp-content/uploads/2024/10/2023-Eelgrass-Report_FINAL.pdf
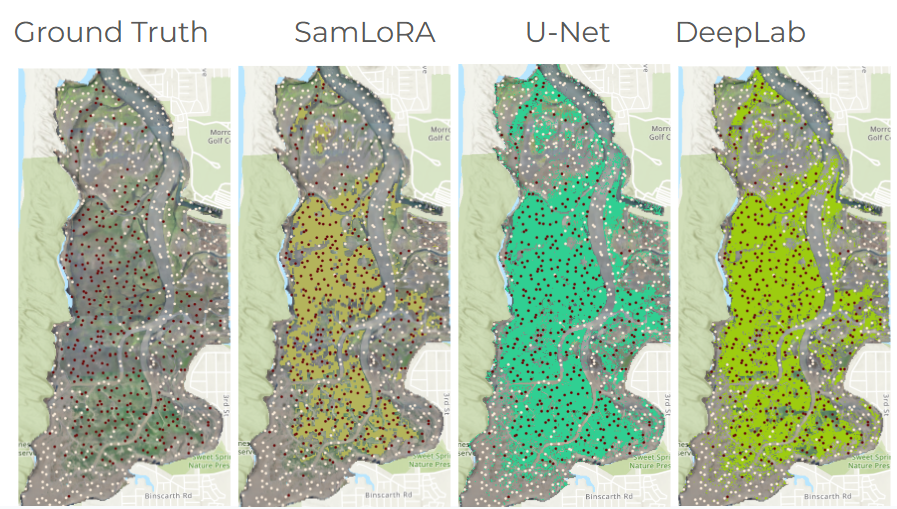
Tallam, K., Nguyen, N., Ventura, J., Fricker, A., Calhoun, S., O’Leary, J., Fitzgibbons, M., Robbins, I., Walter, R. K. 2023. Application of Deep Learning for Classification of Intertidal Eelgrass from Drone-Acquired Imagery. Remote Sensing. https://doi.org/10.3390/rs15092321
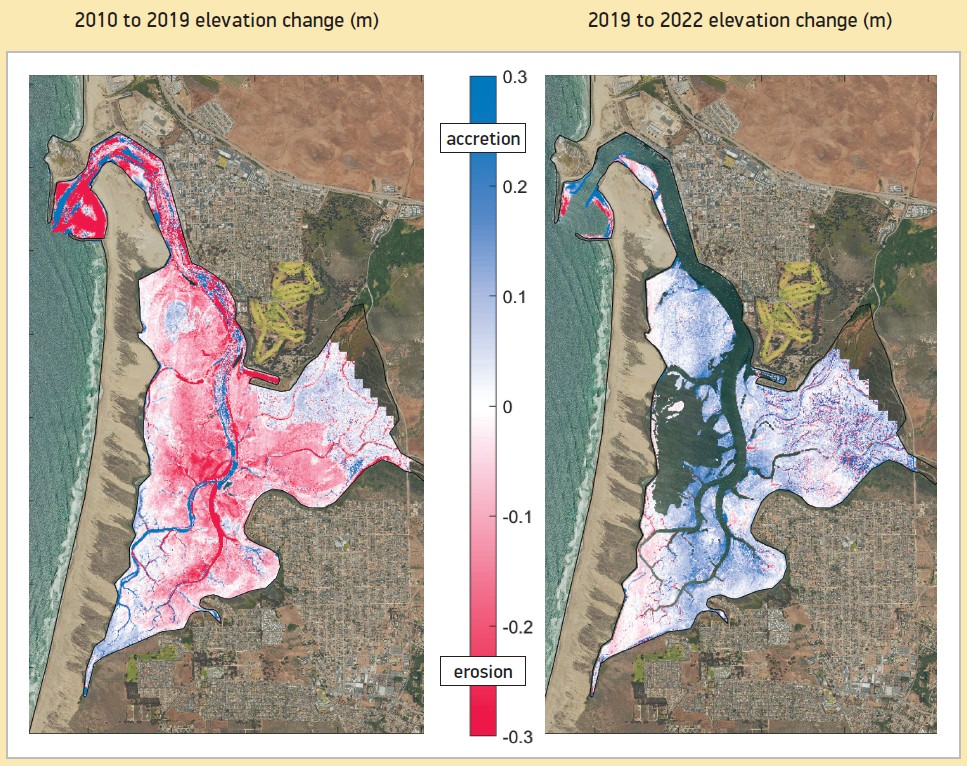
Walter, R. K., O’Leary, J. K., Vitousek, S., Taherkhani, M., Geraghty, C., Kitajima, A. 2020. Large-scale erosion driven by intertidal eelgrass loss in an estuarine environment. Estuarine, Coastal and Shelf Science. https://doi.org/10.1016/j.ecss.2020.106910