A Year of Algae Monitoring
Eelgrass is a flowering plant that serves as an ecosystem engineer within the Morro Bay estuary. It provides habitat, stabilizes the sediment, and sequesters carbon. After experiencing a major decline from 2007 to 2017, eelgrass has made a remarkable recovery in Morro Bay. However, since 2020 we’ve also noticed an uptick in the amount of macroalgae present throughout the bay. Numerous studies have shown that large mats of macroalgae can smother eelgrass beds. They can also prevent them from getting the sunlight they need to photosynthesize. Thus resulting in decreased eelgrass shoot density and reduced growth rates (Gustafsson & Bostrom 2014, Hauxwell et al. 2001, Huntington & Boyer 2008, Rasmussen et al. 2012). While we have monitored eelgrass in the field since 2005, the potential for algae to interrupt the recent recovery prompted a separate effort dedicated specifically to tracking algae abundance.
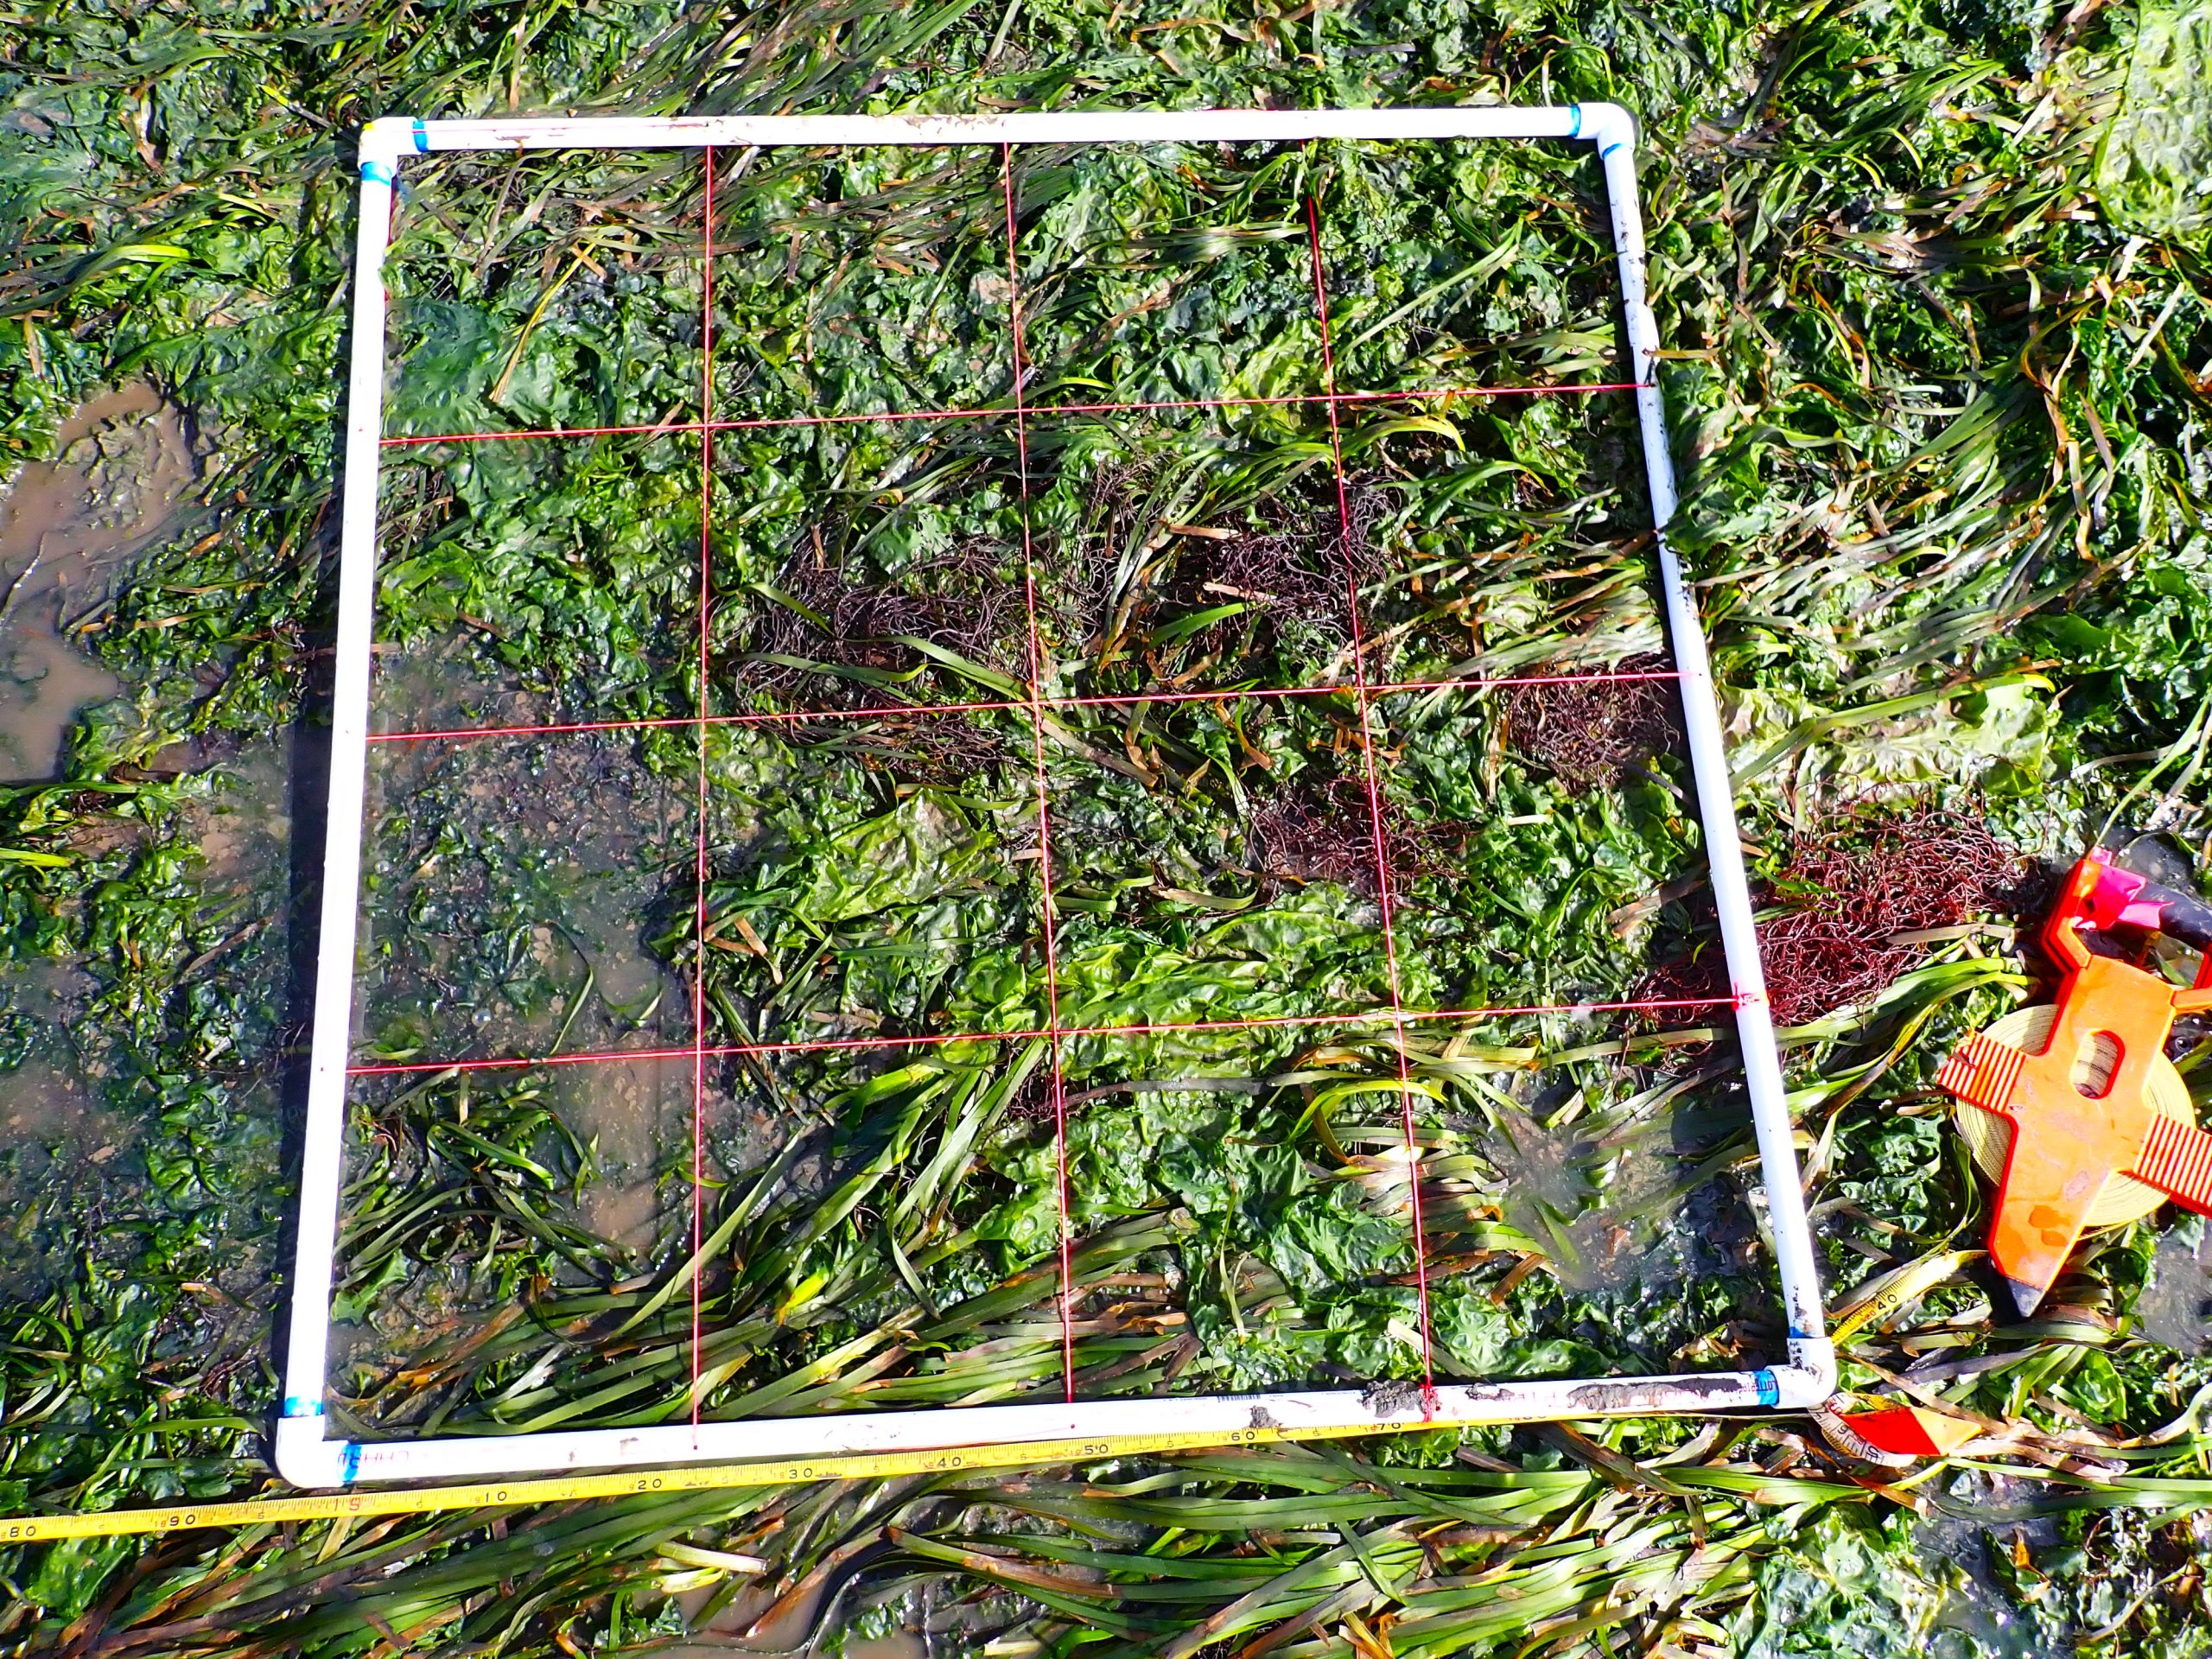
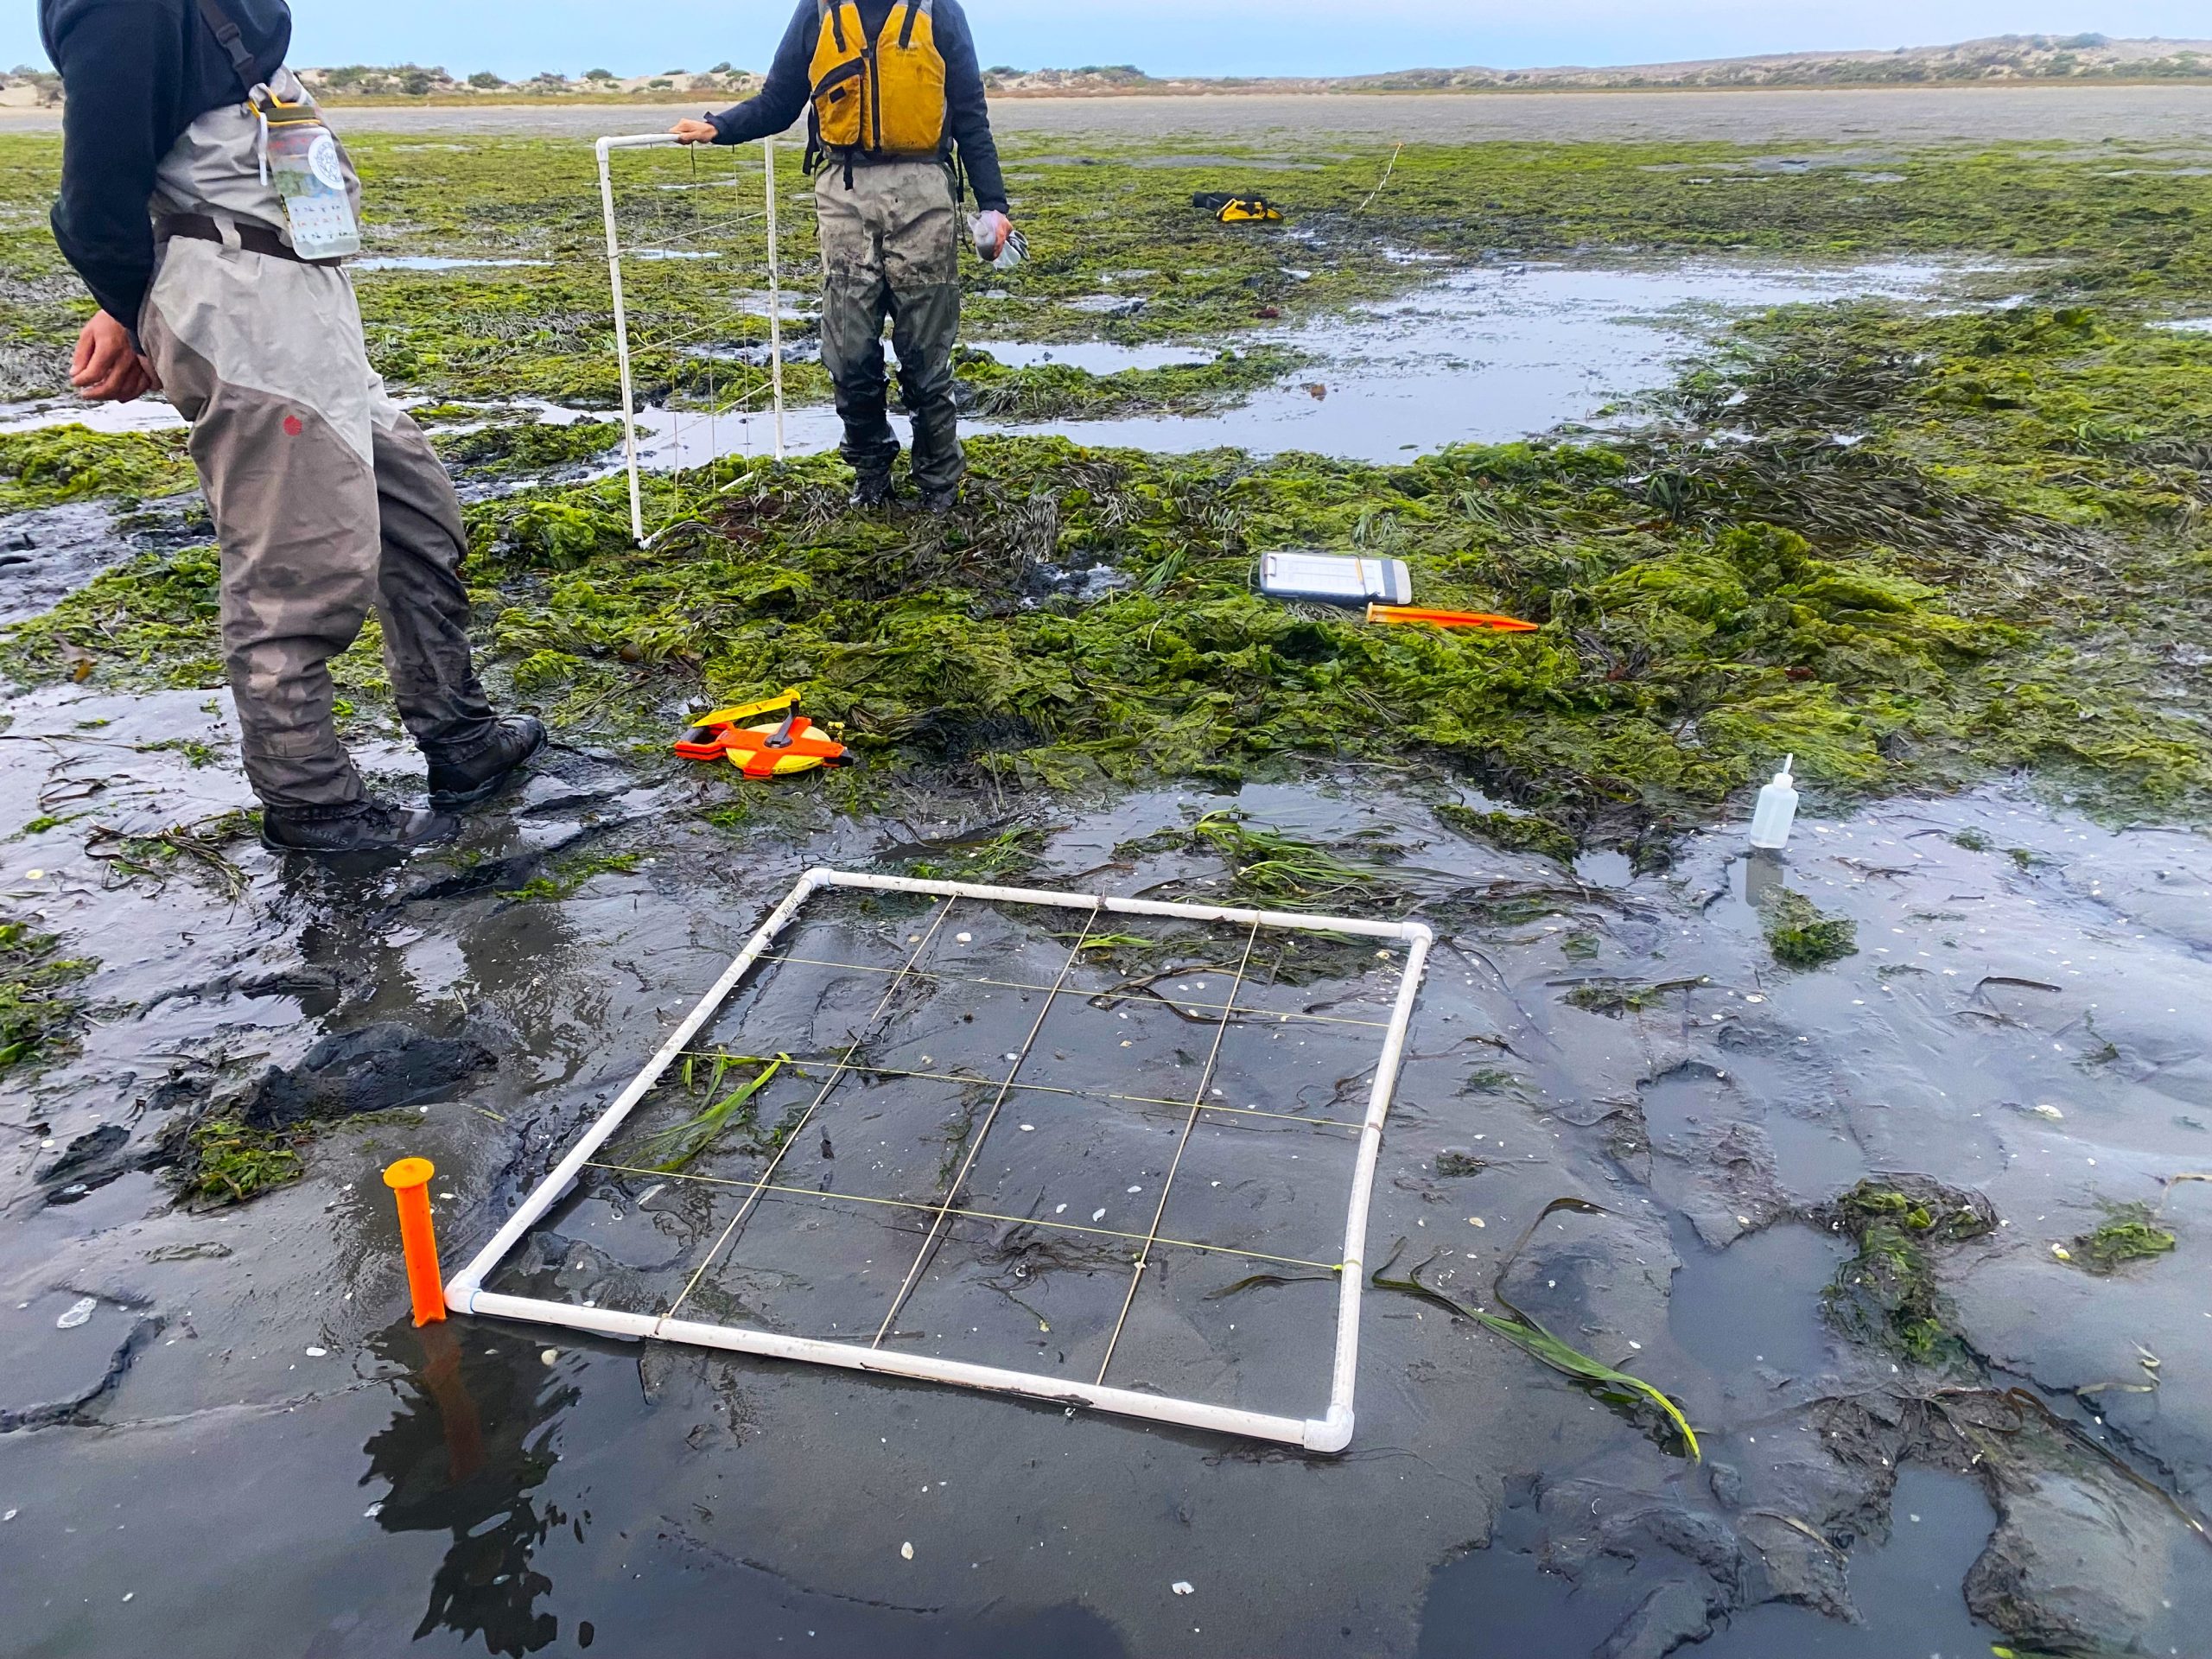
In May 2023, the Estuary Program embarked on its first round of macroalgae surveys. The goal of this project was developing a better understanding of how eelgrass and algae interact. Since the first round of algae monitoring, two additional sets of surveys have been conducted to explore the seasonality of algae abundance in the bay. Now that we’ve completed three rounds of surveys, we have enough data to begin exploring some of the trends we’ve observed in the field. While this post will focus more on the preliminary results of this project, we have a blog post from last year that covers the study design and fieldwork in greater detail.
How Nutrient Availability Influences Algae
In the blog post referenced above, we briefly touched on a process called upwelling. Upwelling is a seasonal phenomenon that brings nutrient-rich water from the ocean depths to the coastline. This process is driven by a combination of alongshore winds and the earth’s rotation. This promotes the movement of surface water masses offshore. Then, like a conveyor belt, those masses are replaced by colder, deeper water masses from below. These rising water masses seed the coastline with nutrients like nitrate, an essential component of algal growth.
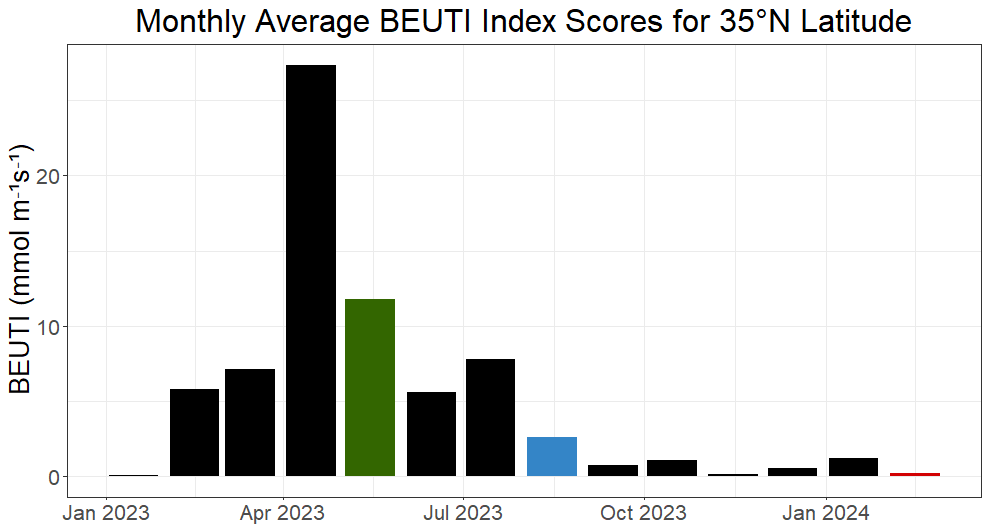
Scientists can keep track of upwelling intensity by using indices like the Biologically Effective Upwelling Transport Index (BEUTI). This index quantifies the movement of nitrate to the surface during upwelling. As seen in the figure below, upwelling is strongest in the spring. It then quiets down in the summer, and becomes virtually nonexistent in the winter. While the overall intensity of upwelling changes between years, the seasonality is remarkably consistent. This seasonality plays an integral role in algae abundance across the entire coast of California.
Moving With the Wind and Waves
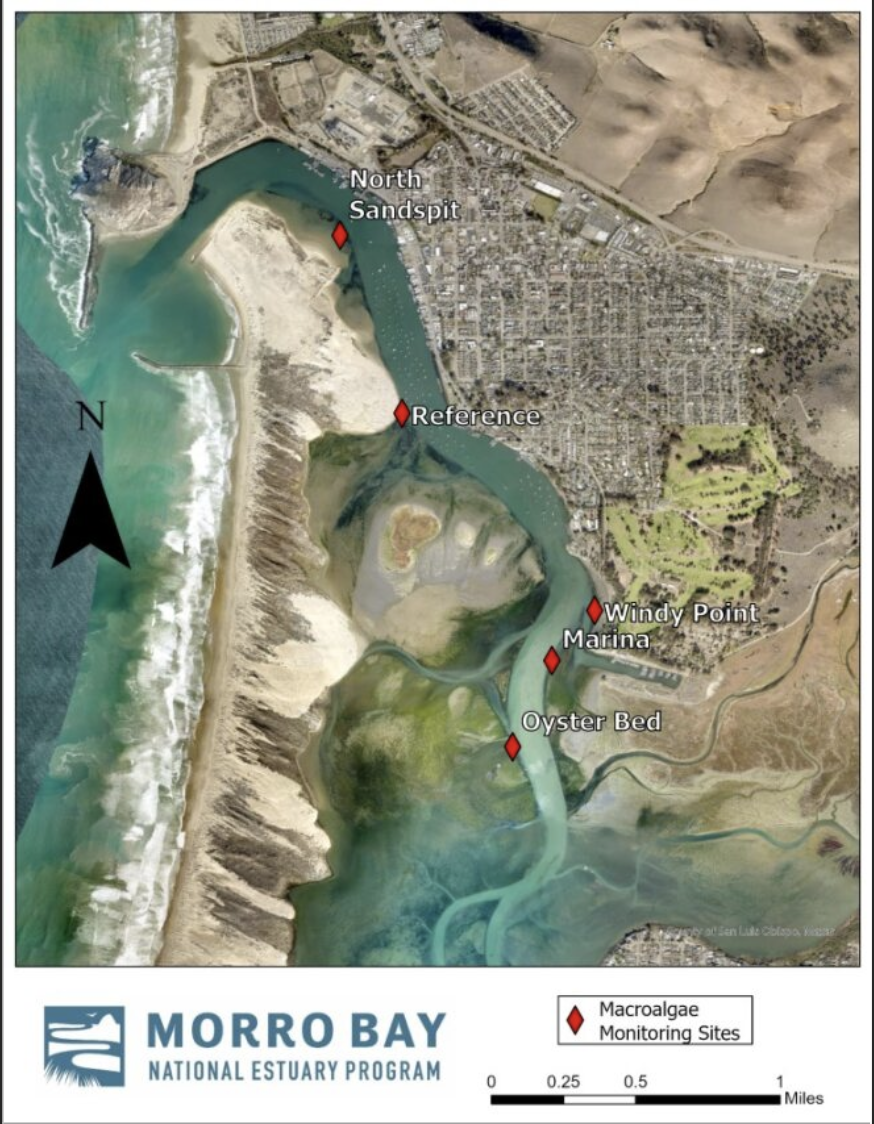
Much of the algae seen in the estuary did not originate here. Rather, it drifted in with the movement of ocean currents and tides. When upwelling begins in the early spring, the sudden surge of nutrients initiates algal blooms. Then, pockets of macroalgae float in from the ocean and begin accumulating near the bay mouth. This is exemplified by the results from our spring surveys conducted in May 2023, as shown in the boxplots below. These results depict high algae biomass at the mouth of the bay, then a steady decline as we moved towards the back of the bay.
In the summer, upwelling intensity decreases as the strong winds that drove this process become calmer. Even though upwelling has stalled, a combination of lighter winds and currents likely promotes the accumulation of algae throughout the bay while the transport of algae settles down. In addition, abundant sunlight during the summer months also promotes high rates of photosynthesis and growth. This can be seen in the figure below, as algae biomass peaked during our August 2023 surveys and was widely dispersed throughout the estuary.
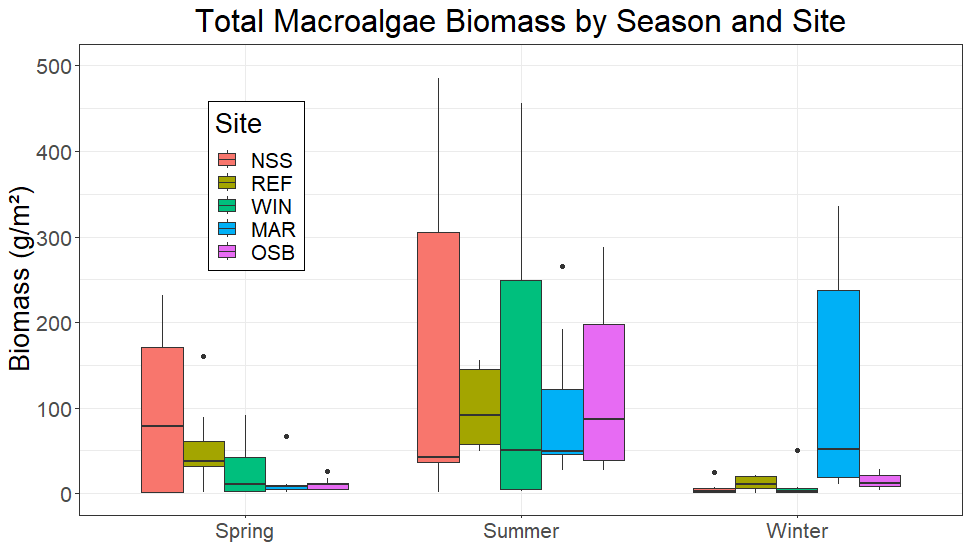
And finally in the winter, represented by our February 2024 surveys, we observed reduced algae biomass due to several factors. These factors include the reduction of upwelling intensity, a sequence of winter storms flushing algae out of the estuary, and the reduced hours of daylight inhibiting photosynthesis. All these factors contributed to low biomass at most sites, except for the site near State Park Marina (MAR).
Eelgrass and Algae are Intertwined (Literally)
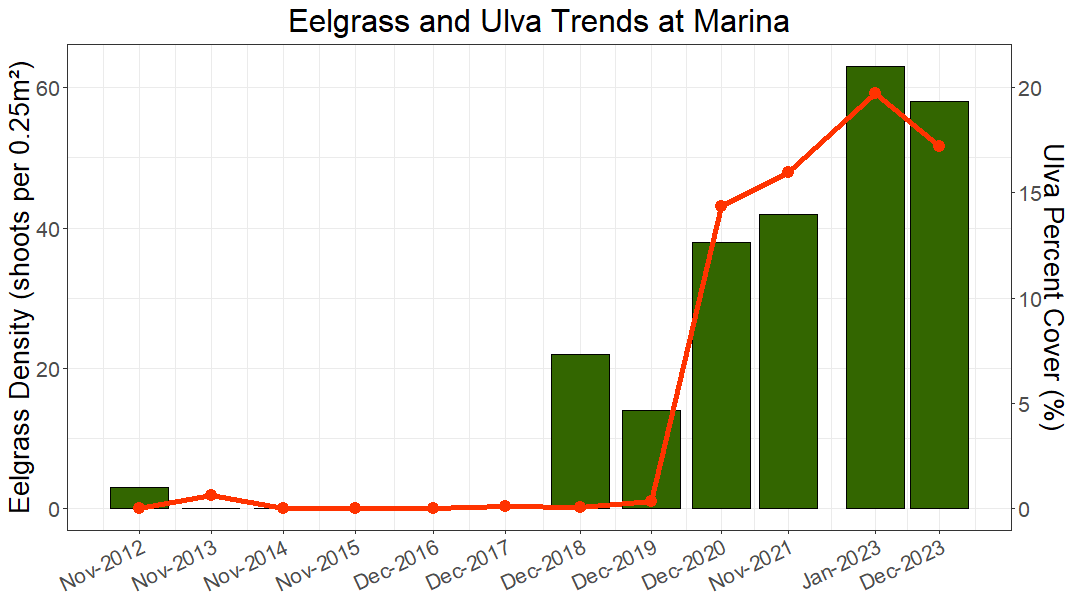
One of the main takeaways from our first year of surveys relates back to our original question: “How do eelgrass and macroalgae interact?”. Despite competing for light and nutrients, data from our long-term eelgrass monitoring projects have shown that algae abundance is increasing along with the resurgence of eelgrass. While this seemed counterintuitive at first, the macroalgae monitoring project helped us uncover one of the reasons behind this trend.
It turns out that having abundant eelgrass within the estuary contributes to the retention of algae. This is because algae tend to get tangled up within eelgrass beds. We compared quadrats sampled during our field surveys that had a higher proportion of eelgrass cover with those that had a higher proportion of bare ground. We found that average algae biomass was more than four times higher at the quadrats containing proportionally more eelgrass. This essentially means that algae are much more likely to accumulate within eelgrass beds than in patches of bare sand. This is consistent with results from similar studies, which found that eelgrass beds dampen current velocity and promote algae accumulation (Bell & Hall, 1997).
Unfortunately, we can’t yet answer all our algae-related questions with one year of results. However, this project is set to continue for the next few years. This will provide replicates for each season and offer insight into inter-annual trends. In addition, eelgrass health metrics collected while at each site will aid in our understanding of how algae abundance impacts the condition of eelgrass beds. Thus far, eelgrass health does not appear to be significantly impacted by large algae mats. However, more data is required to draw formal conclusions.
Help us protect and restore the Morro Bay estuary!
- Donate to the Estuary Program today and support our work in the field, the lab, and beyond.
The Estuary Program is a 501(c)3 nonprofit. We depend on funding from grants and generous donors to continue our work. - Support us by purchasing estuary-themed gear from ESTERO. This locally owned and operated company donates 20% of proceeds from its Estuary clothing line and 100% of Estuary decal proceeds to the Estuary Program. Thank you, ESTERO!
- Purchase items from the Estuary Program’s store on Zazzle. Zazzle prints and ships your items, and the Estuary Program receives 10% of the proceeds.
- Subscribe to our seasonal newsletter: Between the Tides!
- We want to hear from you! Please take a few minutes to fill out this short surveyabout what type of events you’d like to see from the Estuary Program. We appreciate your input!