How will extreme weather events likely affect the Morro Bay watershed and estuary?
How will extreme weather events likely affect the Morro Bay watershed and estuary?
More severe storms, flooding, extended periods of drought, increased wildfire risk, and other extreme weather events could have major impacts on humans, wildlife, and habitats in the watershed and estuary.
Floods, drought, heat waves, torrential rains — extreme weather events are becoming increasingly common around the globe. Changes in these types of weather events are not predictable, with expected shifts in the frequency and magnitude of the extremes. A year with record rainfall can be followed by several years of drought. Studying as well as planning and developing adaptation strategies for these extreme events is crucial to improving resiliency. The Estuary Program works with partners to improve understanding of these potential changes and develop adaptations to protect both human infrastructure and natural habitats.
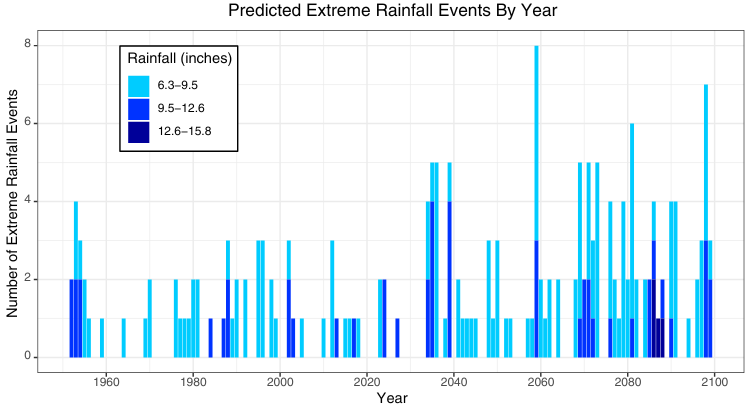
Extreme Rainfall Events
Extreme precipitation events are expected to increase in frequency throughout the rest of the century. An extreme precipitation event is a four-day period with exceptionally high rainfall totals compared to historical data. The colors in the graph indicate the projected inches of rainfall per year for a four-day event, and the height of each bar indicates the number of extreme rainfall events per year in the Morro Bay area.
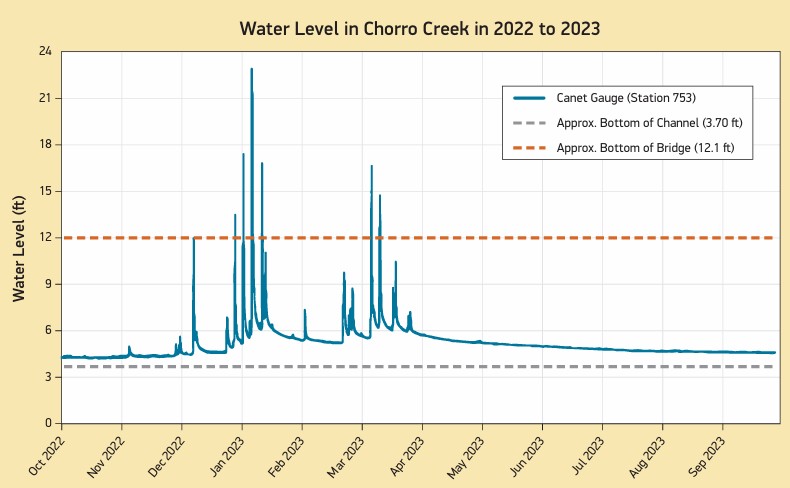
Local Impacts of Winter 2023
The winter of 2023 is still fresh in the minds of local residents. The graph below shows the water levels in Chorro Creek at Canet Road, the site of a San Luis Obispo County water level gauge. A bridge over the creek provides access for residents living across the creek from Highway 1. When waters reach twelve feet, they hit the bottom of the bridge (represented by the yellow dotted line). During the winter of 2022 to 2023, there were several storms that caused creek flow to overtop the bridge.
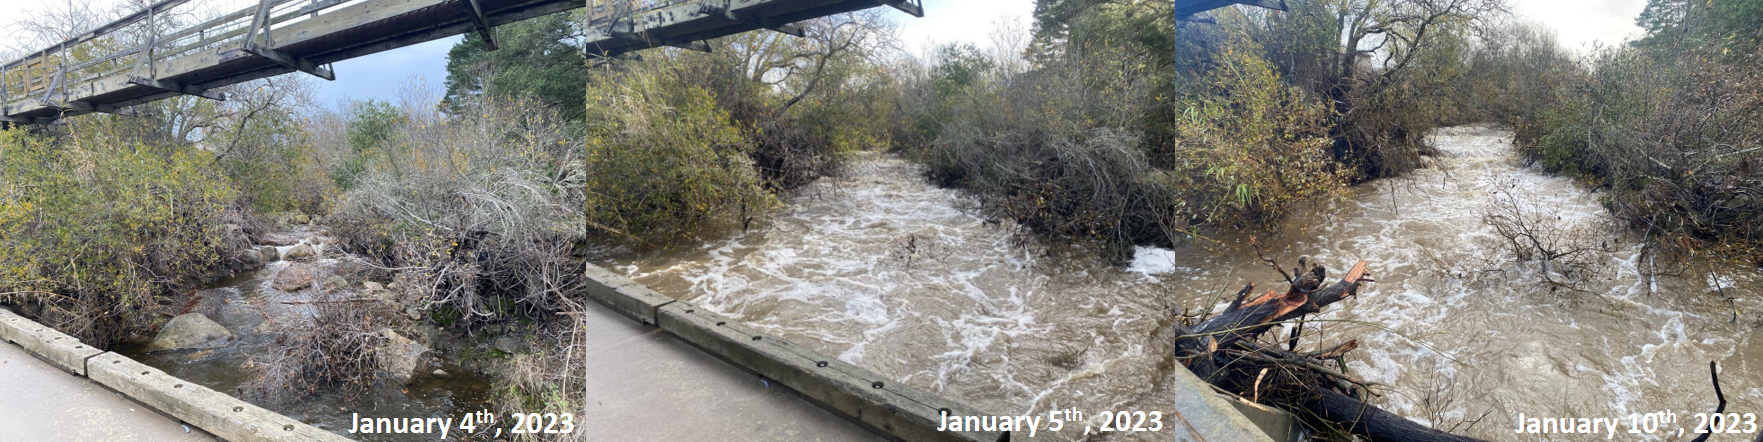
This series of photos shows changes in creek flows at Chorro Creek in January 2023. Between January 5 and January 10, the water level reached 23 feet, with the bridge under about ten feet of water. In the photo on the right, debris from the severe storm can be seen piled up against the bridge. A total of 5.35 inches of rain fell on January 9, the highest rainfall since historic flooding in March 1995 when 6.77 inches of rainfall were recorded.
Chorro Creek at Canet Road in January 2023.
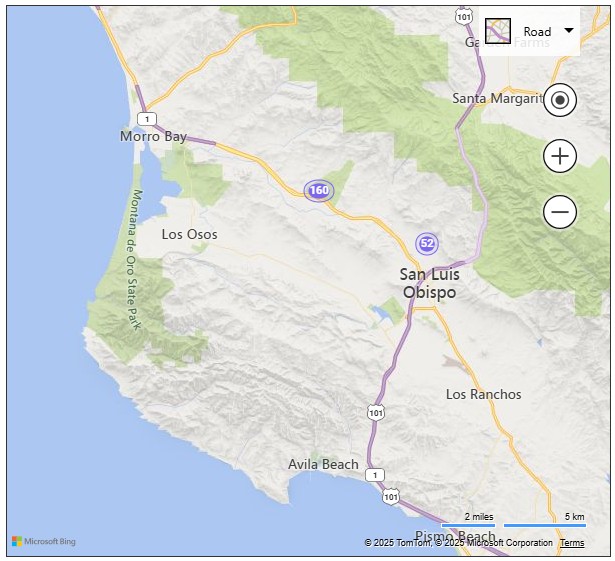
Local Resources for Staying Informed
When heading out to spend a day in nature, it can be a good idea to know what to expect, and there are several easily accessible resources that can help you be prepared. The SLO County Public Works Department maintains a network of stream gauges throughout the County, including the one highlighted above on Chorro Creek. To view a map of stream gauges across the county that provide real-time water level and precipitation readings, visit the Current Stream Stage Map.
Additionally, the California Irrigation Management Information System (CIMIS) is a program run by the Department of Water Resources that manages a network of almost 150 weather stations across the state. We regularly use precipitation readings from the San Luis Obispo station (Station ID #052) to track the amount of rainfall during fieldwork. Limited reports can be accessed without an account, but a free account provides access to all available data and customizable reports.
The Station Location Map on the CIMIS site lets you search for the closest weather stations. The stations closest to the Morro Bay watershed are Station #052 and Station #160.
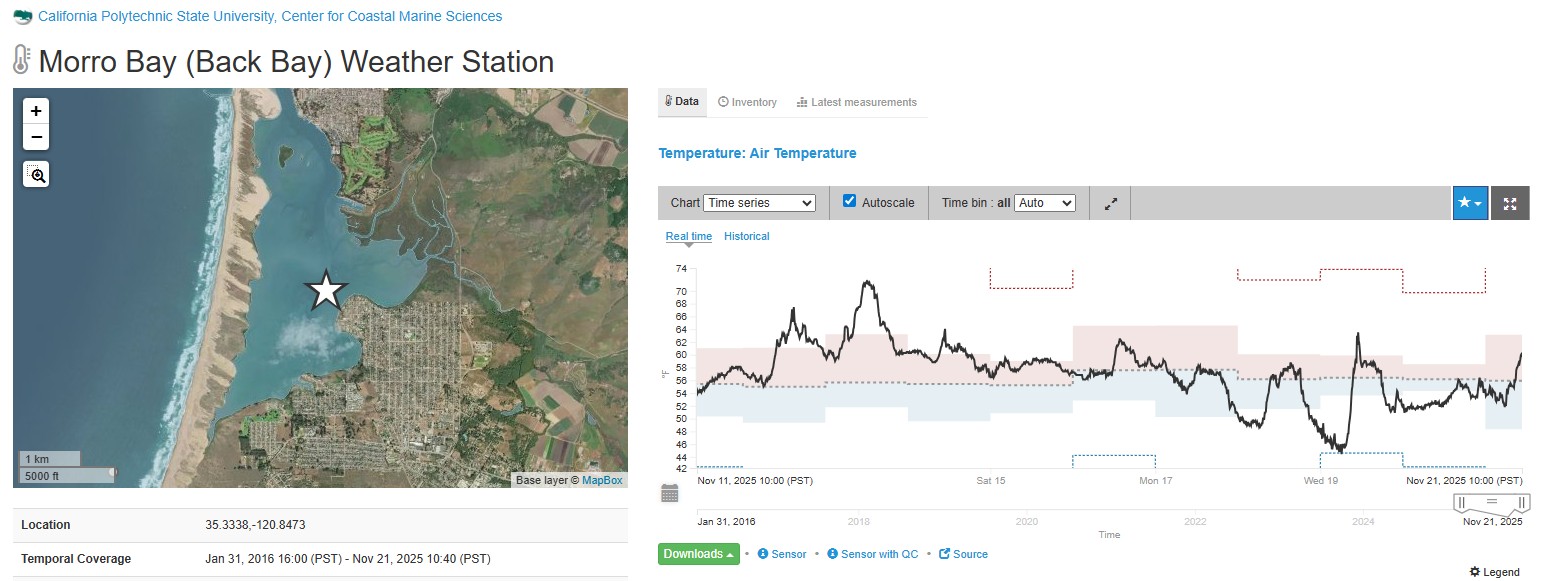
If you’re preparing to go out on the water and are interested in weather conditions in the Morro Bay estuary, the Central and Northern California Ocean Observing System (CeNCOOS) operates a weather station in the back bay, which uploads real-time data to an online dashboard. The weather station is co-located with a suite of water quality sensors that are maintained by researchers at Cal Poly, which are covered in further detail in our Water Quality indicator section.
This screenshot from the CeNCOOS Morro Bay Weather Station dashboard displays its location within the bay and a time series of air temperature. Users can also view the latest readings of wind speed, precipitation, air pressure, humidity, and solar radiation.
Safeguarding Infrastructure
With intense rainfall comes an increased risk of flooding. Low-lying infrastructure and natural habitats can be vulnerable when waters rise. The storms of 2023 highlighted the vulnerability of transportation corridors in the watershed when the community of Los Osos was temporarily cut off due to flooded roads. These vital roadways are central to community life, underscoring the need for analysis and the development of adaptations to protect them.
The San Luis Obispo Council of Governments (SLOCOG) launched a program with funding from Caltrans to develop solutions to improve car and bicycle transportation between Morro Bay and Los Osos and protect natural habitats. The project created an inventory of transportation infrastructure and habitats and developed a model to predict water movement and flow patterns. SLOCOG will create a summary of coastal hazards and vulnerability assessments to better understand risks in this area.
This is the parking area at Windy Cove during an extreme high tide. If sea levels rise to the higher end of the predicted range, portions of South Bay Boulevard and State Park Road near Windy Cove could face daily tidal flooding like this by 2060.
The Virtual Planet tool shows potential flood impacts. The top image shows State Park Road during current high tide conditions, while the bottom image shows the same area under 1.8 feet of sea level rise. Tools like this help visualize future impacts to infrastructure and habitats.
The Virtual Planet tool highlights the impacts of potential sea level rise on South Bay Boulevard, a vital transportation corridor for the communities of Morro Bay and Los Osos.
The Virtual Planet tool also describes possible solutions to protect transportation infrastructure and habitats. This example shows the construction of a causeway to elevate the road, which would allow rising waters, wildlife, and wetland habitat to move freely beneath the road.
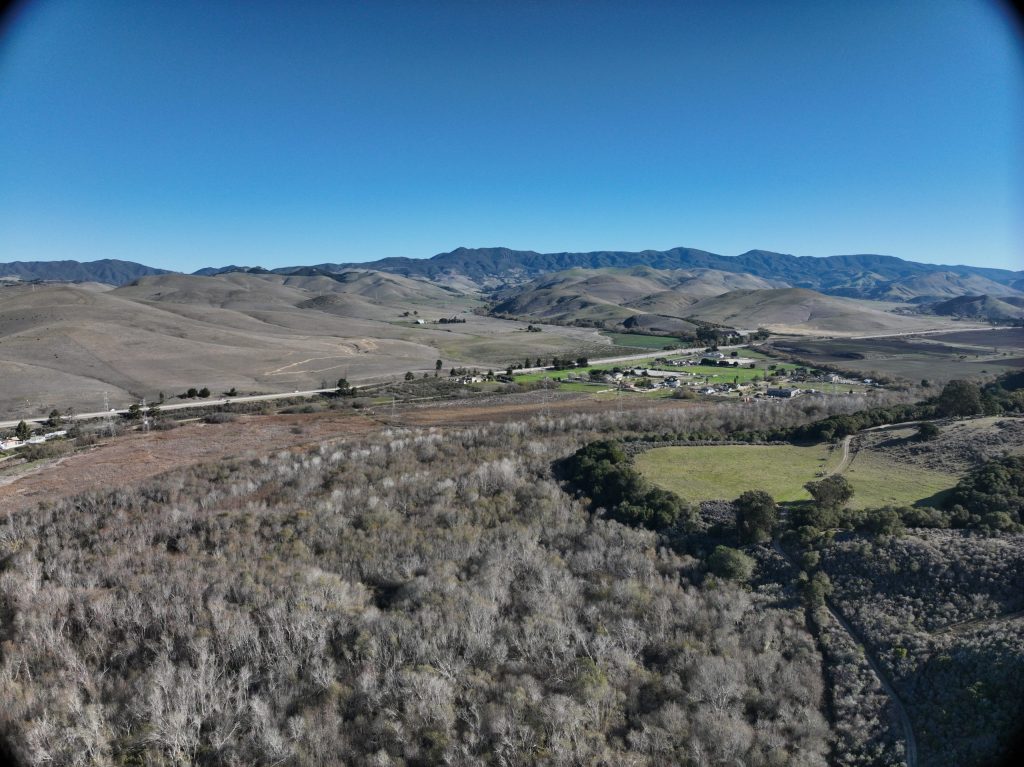
View of lower Chorro Creek and Chorro Flats from Black Hill.
The Coastal San Luis Resource Conservation District (CSLRCD) leads another effort to address flooding. This organization owns the Chorro Flats area, the floodplain adjacent to lower Chorro Creek (pictured above) that flooded during the January storms. The floodplain is thought to be close to its capacity for retaining sediment and reducing flooding. The CSLRCD is looking at nature-based solutions to increase floodplain capacity, including land acquisition and floodplain restoration.
Protecting Habitats for the Future
The 400-acre tidal marsh where Los Osos and Chorro Creeks enter the estuary provides a unique habitat for wildlife and plants adapted to saltwater inundation from incoming tides. Rising sea levels and coastal flooding threaten this area as higher water levels may drown marsh plants and reduce the habitat available for wildlife. The Estuary Program has partnered with USGS to develop strategies to help preserve the marsh and transition habitats for the wildlife that live there. This work involves using sediment and water-level monitoring data to model how water might move across the estuary with the tides as sea levels rise over time. The work helps identify potential ways to reduce damage to fragile ecosystems, such as providing upland space where the marsh could expand or adding sediment to raise marsh elevation.
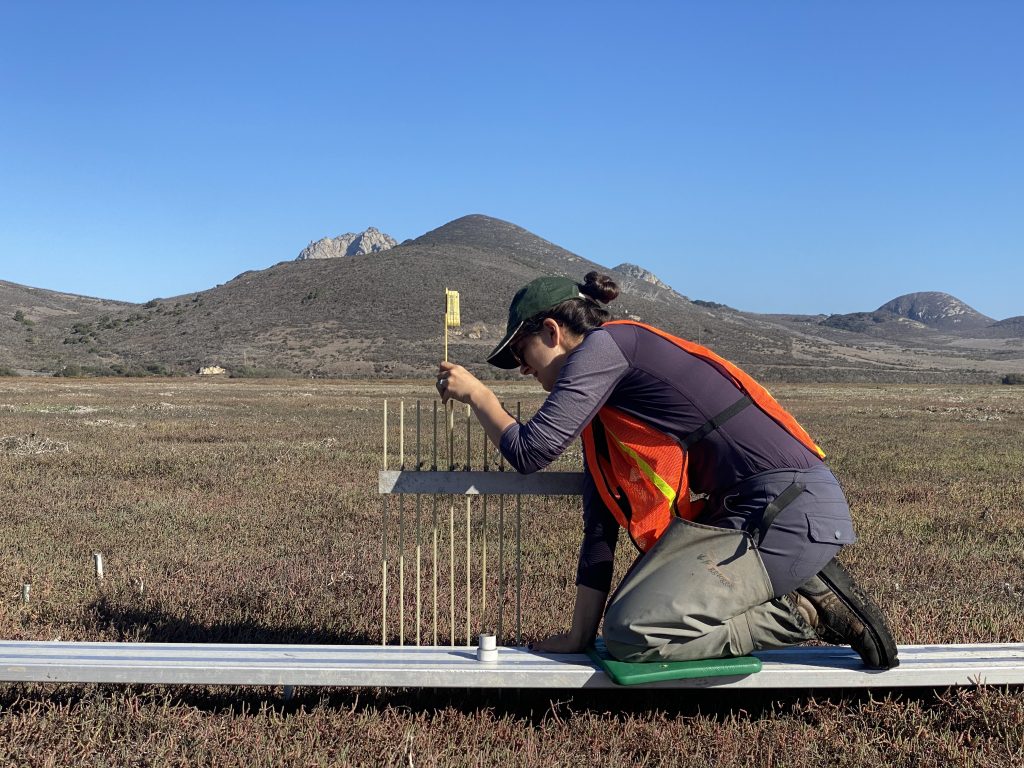
USGS staff use surface elevation tables to measure elevation changes of the marsh surface. In general, the salt marsh is gaining in elevation as sediment is deposited from Chorro and Los Osos Creeks. But if the rate of sea level rise accelerates in the future, this sensitive marsh habitat may eventually transition into mudflats.
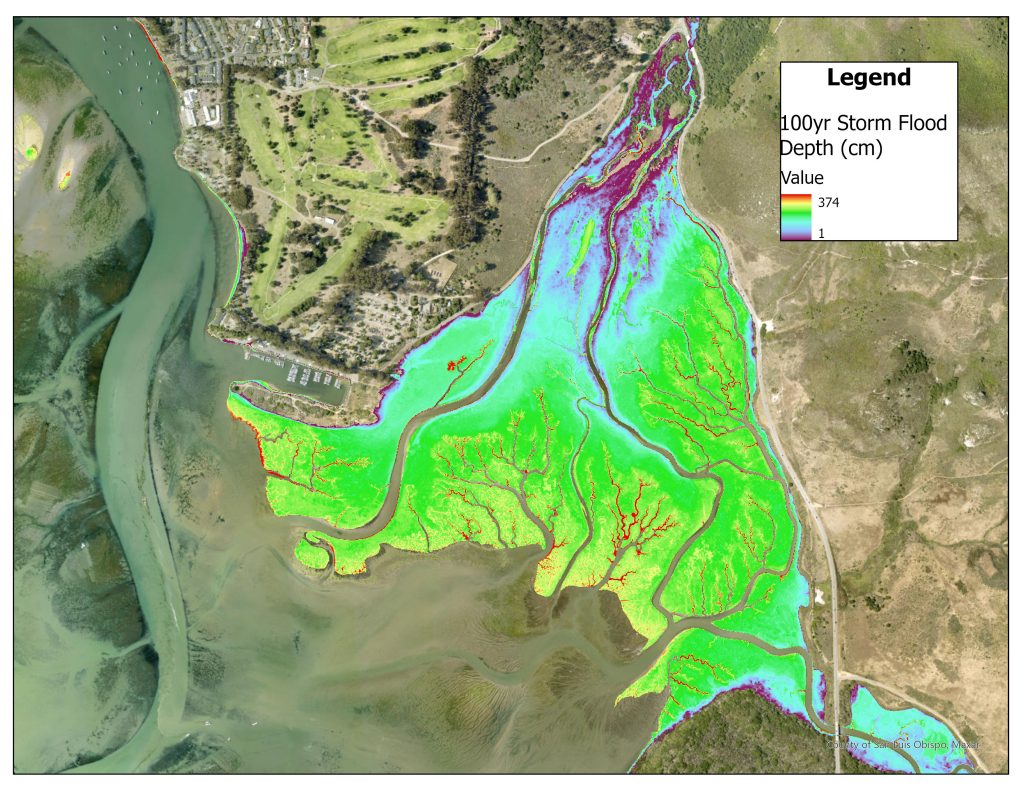
The Coastal Storm Modeling System (CoSMoS) is another product of the USGS that maps projected sea level rise and coastal flooding impacts across California. The imagery above depicts the depth of flooding (in centimeters) throughout the salt marsh during a 100-year storm event. Depth ranges from shallow (shown in blue) to over three meters deep (shown in red). Projected flooding encroaches on South Bay Boulevard and overtops the bridge over Chorro Creek near the intersection with State Park Road. To explore the CoSMoS model, visit the Our Coast Our Future (OCOF) Hazard Map.
How Extreme Weather Events Take Shape
When predicting the future of extreme weather events, scientists are calling for both extended droughts and more severe storms. At first, the idea seems contradictory – how can we predict both more rain and less rain at the same time? According to Dr. Daniel Swain, renowned climate scientist, wildfire advisor, and founder of the popular Weather West blog, the key is the atmosphere’s ability to hold on to evaporated water.
This illustration of the expanding atmospheric sponge illustrates the point that as the earth’s temperature increases, the atmosphere (represented by a sponge) can hold more water, so it will release more during a storm. Illustration courtesy of Dr. Swain.
In a recent publication, Swain and fellow researchers explored the concept of “hydroclimate volatility,” or the rapid and intense swing between very dry and very wet conditions (Swain et al. 2025). The article outlined a simplified model in which the atmosphere is represented by a large sponge. As the atmosphere warms, the capacity for it to hold more water vapor increases, therefore our hypothetical sponge becomes “thirstier.” Following the analogy, our thirsty sponge takes longer to become fully saturated with water and when it is wrung out, significantly more water is released all at once. In other words, longer droughts emerge because the atmosphere holds onto water vapor for longer periods of time and small rain events are less frequent. By the time the atmosphere has become saturated with water vapor and the time has finally come to release it, the resulting deluge can be fairly extreme and cause extensive flooding.
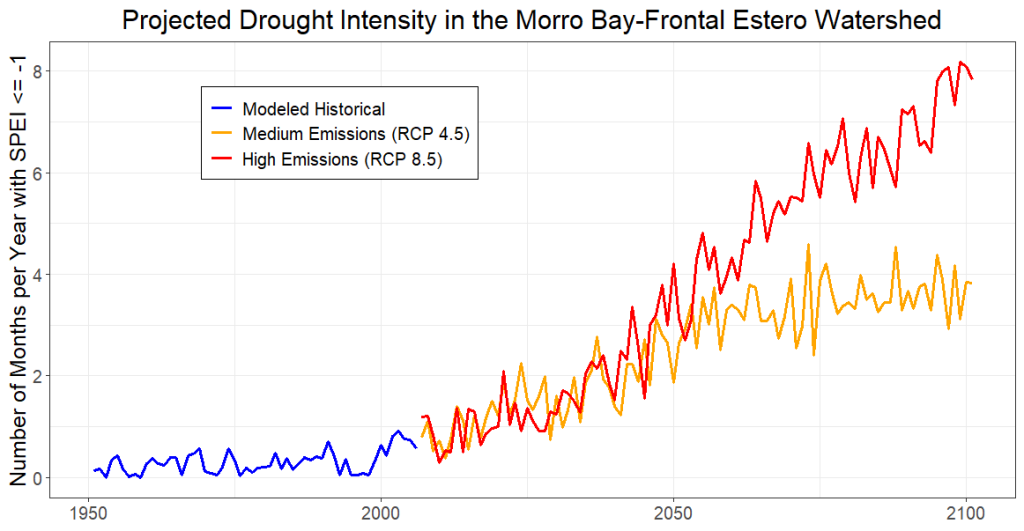
The Standardized Precipitation-Evapotranspiration Index (SPEI) is a metric of drought intensity, with negative values corresponding to more severe drought conditions. The number of months per year with an SPEI below negative one (drought level) is projected to increase under both medium and high emissions scenarios. Extended droughts mean drier vegetation, which in turn increases the likelihood of wildfires. Projected SPEI data for the Morro Bay-Frontal Estero Watershed comes from Cal-Adapt's public data catalog (https://cmip5.cal-adapt.org/data/download/)
Swain, D. L., Prein, A. F., Abatzoglou, J. T., Albano, C. M., Brunner, M., Diffenbaugh, N. S., Singh, D., Skinner, C. B., Touma, D. 2025. Hydroclimate volatility on a warming Earth. Nature Reviews: Earth & Environment.https://doi.org/10.1038/s43017-024-00624-z