How will climate change likely affect the Morro Bay watershed and estuary?
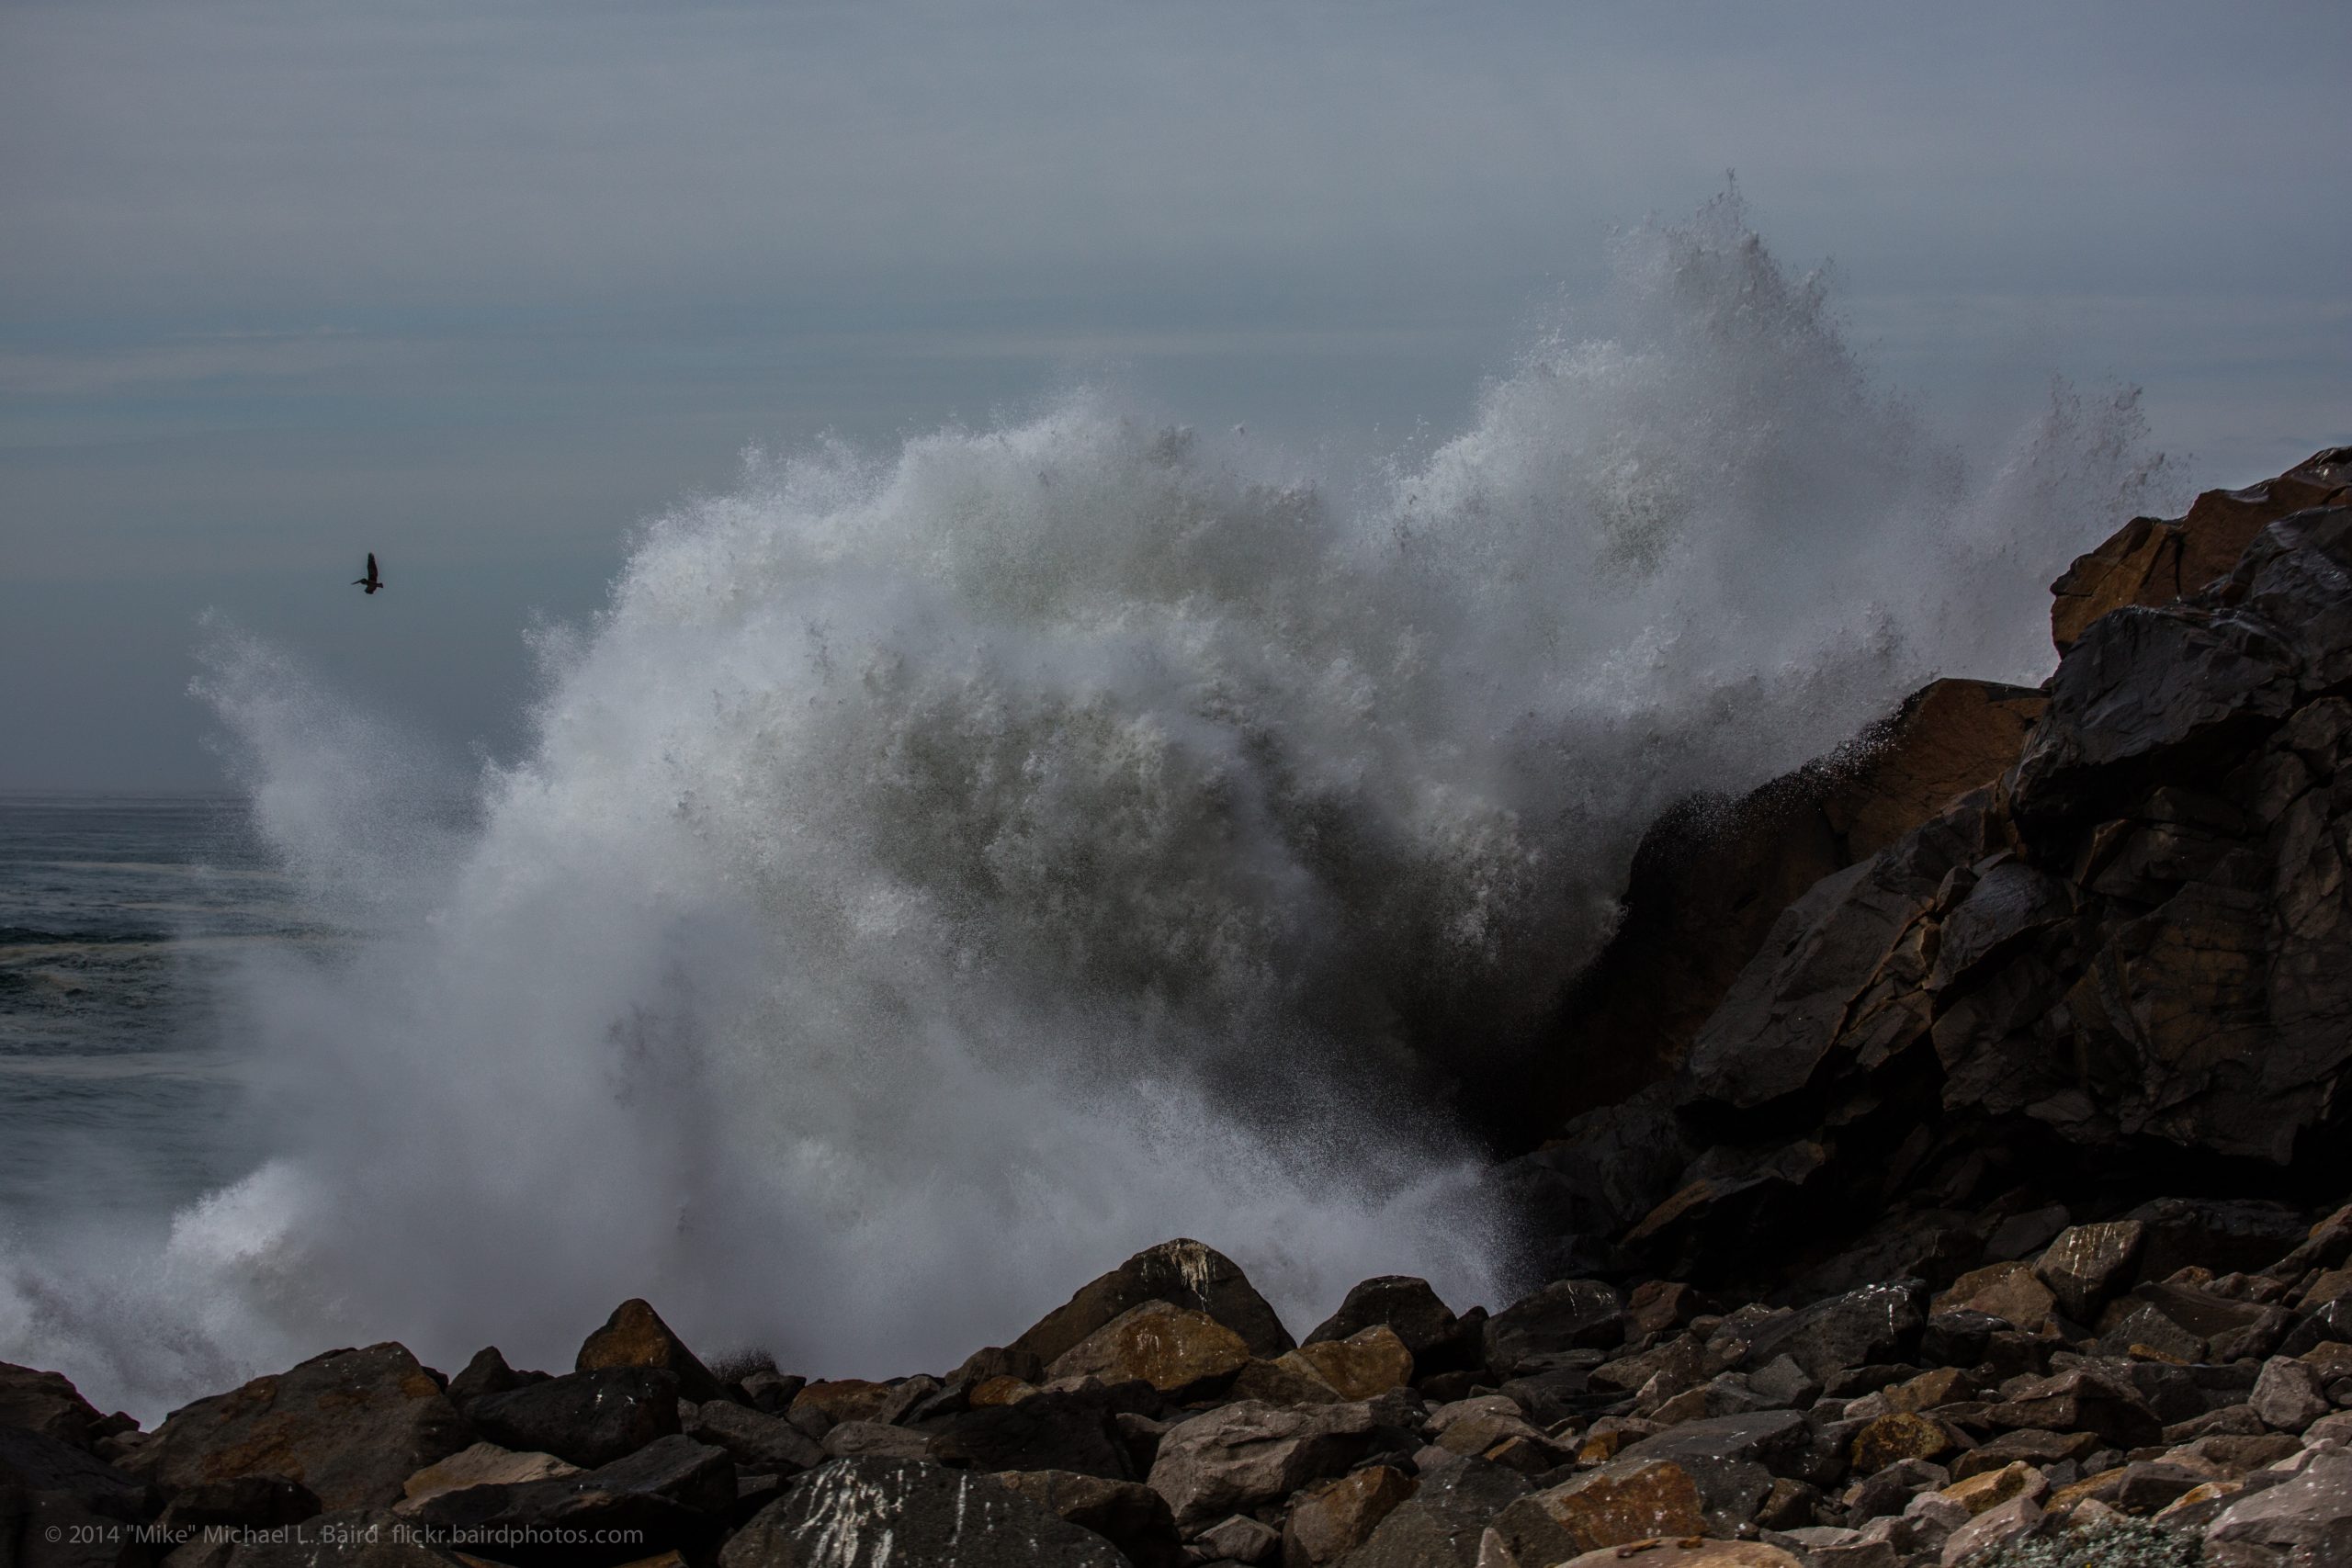
A changing climate has far-reaching implications for our lives. Drought, more intense storms, and wildfires are a few examples of potential impacts. In an effort to understand how global climate change might affect Morro Bay and the lands that surround it, the Estuary Program has examined new climate models. Results from these tools indicate that the local climate will likely shift toward greater volatility in all types of weather conditions, including warmer surface temperatures, drier conditions, more intense storms, and continued sea level rise.
The Estuary Program works to stay abreast of evolving climate science, to understand the impacts of projected changes, and to implement on-the-ground projects to increase the resiliency of natural areas around the estuary.
The Estuary Program used publicly available climate data and modeling programs through Cal Adapt and the Coastal Storm Modeling System (CoSMoS) in order to assess how these changes could affect the estuary and watershed in the future.
Video Presentation: How will Climate Change Affect the Morro Bay Estuary and Surrounding Lands?
Learn what an estuary is and why they are important. Meet the Morro Bay estuary, one of the best preserved estuaries on the California coast, and learn whether or not it’s clean enough to swim in. Video Presentation by Ann Kitajima, Morro Bay National Estuary Program Assistant Director.
Cal Adapt Model
Developed collaboratively by faculty across the University of California system in conjunction with the California Energy Commission, Cal Adapt is a publicly available tool that provides localized information on how climate change might affect California, including impacts such as extended drought, sea level rise, and intense storm conditions.
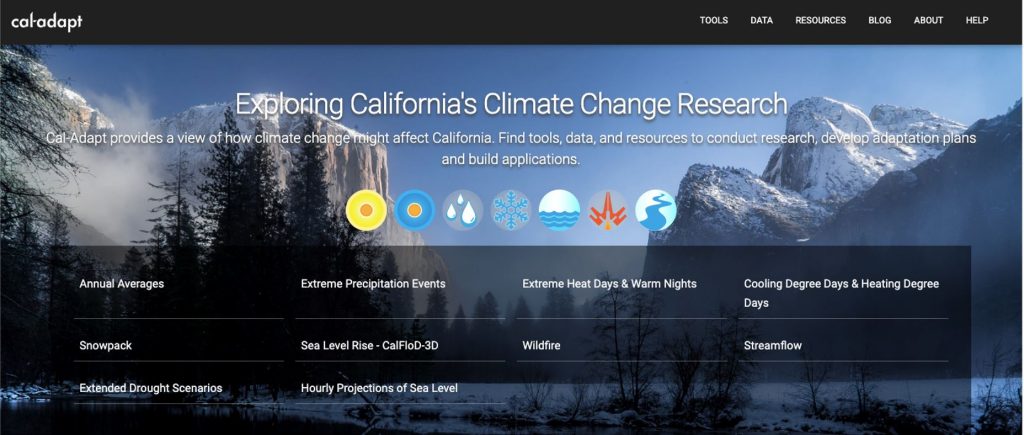
One of the strengths of the Cal Adapt system is its ability to visualize how climate change will impact places on a local and in-depth scale.
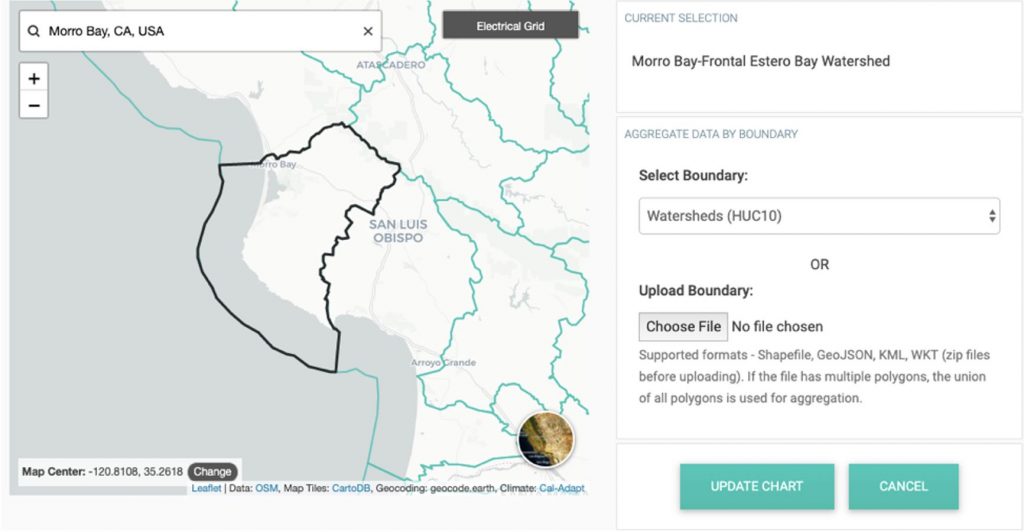
The website allows you to specify a geographic area for the analysis. We focused in on watershed boundary Hydrologic Unit HUC10 to give us results for the Morro Bay estuary and watershed.
Cal Adapt Climate Models
Cal Adapt utilizes different modeling scenarios and regimes that inform model results for the climate impacts for the Cal Adapt tools. All of the modeling scenarios utilized in Cal Adapt modeling and analysis are part of the CMIP5 family of models, which are standardized climate models used to support the work of the Intergovernmental Panel on Climate Change (IPCC). The models utilized in the Cal Adapt tool are accepted by a broad section of the scientific community and are used in other climate modeling tools as well as academic literature and study. Modeled data available on Cal Adapt represents statistically downscaled global climate models using the localized constructed analogs (LOCA) method developed by the Scripps Institute of Oceanography as part of California’s 4th Climate Change Assessment (Geospatial Innovation Facility at UC Berkeley, n.d.). Results from three models are presented in Cal Adapt:
- HadGEM2-ES * (Warm/Drier): HadGEM2-ES stands for the Hadley Centre Global Environment Model version 2 – Earth System.
- CNRM-CM5 * (Cooler/Wetter): A joint development project by French climate scientists.
- CanESM2 * (Average): CanESM2 stands for the Canadian Earth System Model.
For this State of the Bay Report, the Estuary Program chose to focus primarily on the results simulated from the CanESM2 model as it represented a more average scenario.
Cal Adapt Emissions Scenarios
Another consideration in developing this report are the specific emissions scenarios selected for analysis. Due to uncertainties in future emissions of greenhouse gases, each tool in Cal Adapt utilizes the two greenhouse gas and climate scenarios in California’s 4th Climate Assessment. These scenarios are called Representative Concentration Pathways (RCPs).
- RCP 4.5 is a “medium” emissions scenario that models a future where greenhouse gas emissions peak around 2040 and then decline to lower than 1990 levels by the end of the century. This moderate scenario assumes that society will make significant strides in reduction of greenhouse gas emissions.
- RCP 8.5 represents more of a “business as usual” scenario where emissions continue to rise strongly though 2050 and plateau around 2100.
The Estuary Program used modeled data for both the RCP 4.5 and RCP 8.5 scenarios.
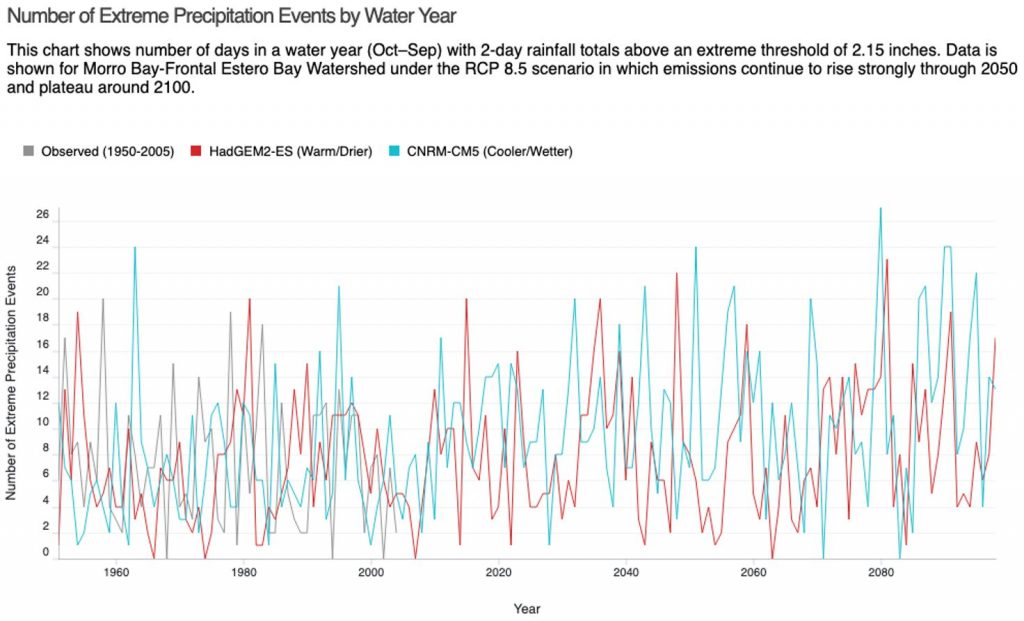
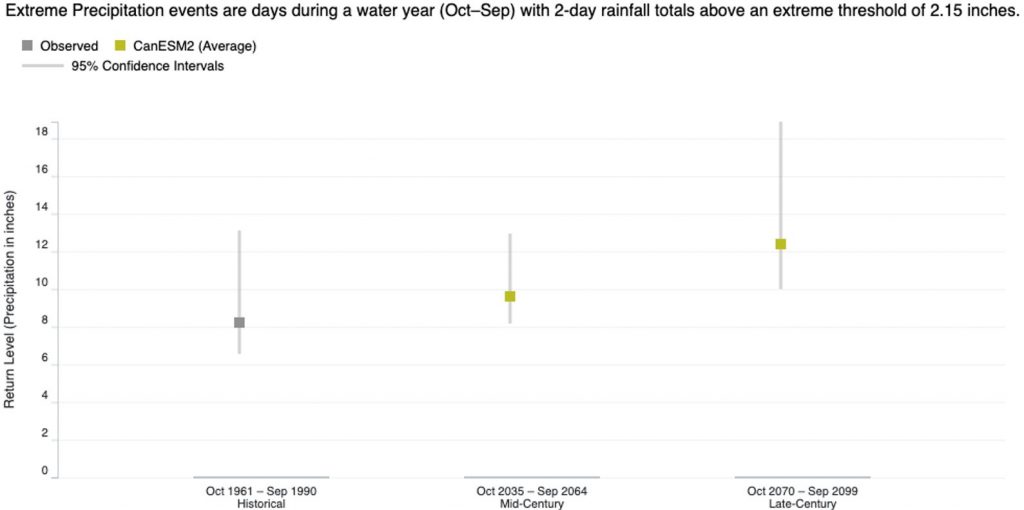
Cal Adapt Extreme Precipitation Results
This tool shows estimated intensity of precipitation events and how these trends change through the year 2100. The analyses provide results of precipitation events in terms of two different metrics: count (number of extreme rainy days) and return levels (estimated intensity in inches). These metrics are found in the y axis of the visualized results, while the x axis represents years. The count and return levels are calculated for a return period, which is a 20-year scenario for this analysis. This can also be thought of as a one in twenty-year event.
Under warming climate regimes, extreme precipitation events will be more common as compared to historical trends (1961-1990). Extreme precipitation events are days during the rainy season with two-day rainfall totals above an extreme threshold of 0.9 inches. As emissions continue to rise and eventually plateau around 2100, extreme precipitation events will be more common.
Number of Extreme Precipitation Results
Although extended drought conditions are expected to become more frequent, increased storminess (more intense storms) will also occur as a result of climate change. Under warming climate, all models predict more volatile storms with greater amounts of rainfall and increased flood potential. Warming climate also influences large scale circulation patterns, influencing the intensity of hurricanes around the world.
Changes in Intensity of Extreme Precipitation Events
Climate Impacts on Wildfire
All climate change models agree that as the climate becomes warmer and drier, wildfire will continue to remain a significant threat. Under the business as usual emissions scenario (RCP 8.5) coupled with a warmer/drier climate model (HadGEM2-ES), there is a predicted 48.6% increase in the potential of acres burned between the observed historical period and the future 30-year period of 2070 to 2099. Some of the variables used to develop this metric in Cal Adapt include historical records of fire, climate, and land surface characteristics including population, development footprint, and statistics for human influences on fire in non-urban areas. Extreme fire events are defined as those where greater than 988 acres are affected. (Westerling, 2018).

Annual Mean Hectares Burned for 1961 – 1990: 464.6 acres
Annual Mean Hectares for 2070 – 2099: 690.6 acres
To further explore the wildfire risk results from Cal Adapt, go to https://cal-adapt.org/tools/wildfire/#climatevar=fire&scenario=rcp45&population=bau_mu&lat=34.28125&lng=-118.78125&boundary=locagrid&units=ha
Impacts of Extended Drought
Those living in the west are already familiar with the concept of drought. Recent research indicates that extended droughts (“mega-droughts”) could become more common in the future.
The following charts illustrate data for two 20-year drought scenarios derived from LOCA downscaled meteorological and hydrological simulations: one for the earlier part of the 21st century, and one for the latter part.
The data illustrated in each chart is for maximum temperatures and precipitation, all under an extended drought scenario. The area modeled is the Morro Bay – Frontal Estero Bay. The grey area in each of the charts represent the range of annual average values from all 32 LOCA downscaled climate models. LOCA, which stands for Localized Constructed Analogs, is a technique for downscaling climate model projections of the future climate (Pierce, n.d.). This technique allows for data to be visualized and projected at a local level.
Note that the Cal Adapt tool only generates results under the more extreme RCP 8.5 (Business as Usual) emissions scenario for this data set.
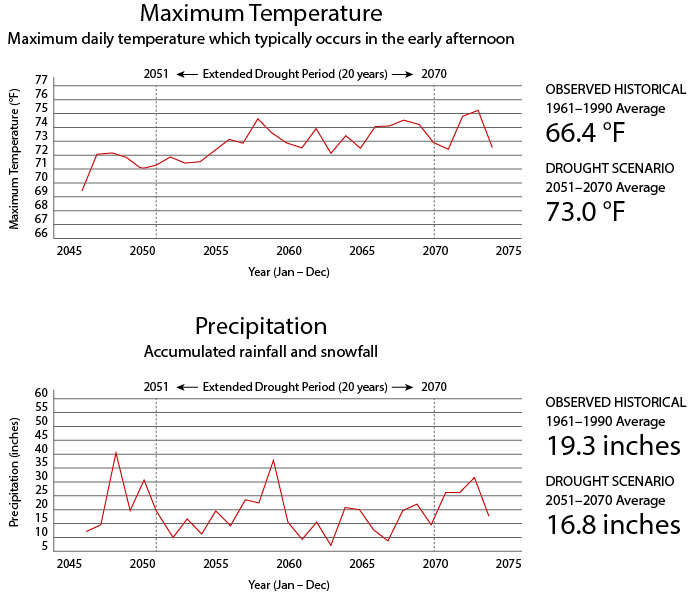
These graphs depict the impacts of drought on temperature and precipitation. The data for the future (2051 to 2070) has been projected based on a warmer/drier climate model and “business as usual” greenhouse gas emissions, which assumes that emissions will continue to rise strongly through 2050 and plateau around 2100. This model predicts an increase of 6.6°F (3.68°C) in maximum temperature and a 2.5 inch (6.35 cm) decrease in precipitation in the Morro Bay watershed.
To explore the modeled extended drought results from Cal Adapt, visit https://cal-adapt.org/tools/extended-drought/
Cal Adapt modeled results for sea level rise along the California coast but did not include analysis within estuaries such as Morro Bay. Thus, Cal Adapt sea level rise analyses they were not included in this SOTB report.
Impacts of Sea Level Rise and Storm Surge in Morro Bay
Sea level rise gets a lot of attention in coastal communities, where it threatens low-lying habitats and could damage roadways, seaside buildings, and other infrastructure. To better understand these future changes on the Central Coast, the United States Geological Survey (USGS) developed a localized model called the Coastal Storm Modeling System (CoSMoS), which predicts storm-induced coastal flooding, erosion, and cliff failures.
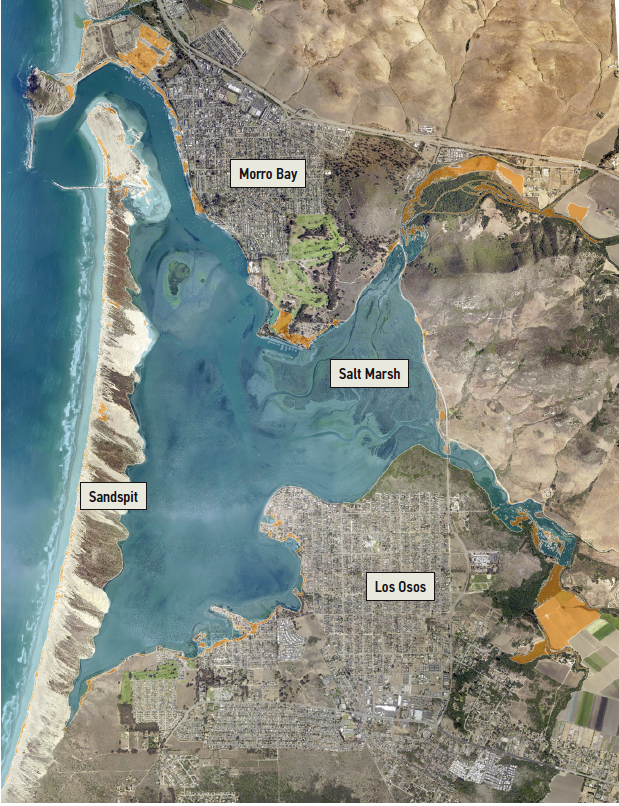
The map shows the model results given two meters (6.6 feet) of sea level rise, pictured in blue, resulting in significant impacts to both infrastructure and habitats, such as the salt marsh. The orange on the map indicates areas that might be impacted by two meters of sea level rise coupled with a 100-year storm, which is a storm so large that it has a one-percent chance of occurring in any given year. The warming climate is expected to bring more volatile storms, meaning that 100-year storm events could become more frequent.
Legend
-

2 meters of sea level rise
-

2 meters of sea level rise with a 100-year storm event
CoSMoS model
Part of the Our Coast, Our Future project, the CoSMoS model makes detailed predictions of storm-induced coastal flooding, erosion, and cliff failures over large geographic scales.
What is a 100-year storm?
A 100-year storm refers to the estimated probability of a storm event happening in any given year. Another way to look at it is with probability: an event has a 1 in 100 chance of occurring. But that doesn’t mean that a 100-year storm happens only once every 100 years. In fact, although not likely, two 100-year storms can even occur within a week of each other. 100-year storm events are often considered in terms of the subsequent precipitation and flooding that results. The flood events and storm surge that occur as a result of these extreme precipitation events is typically the result of a long-lasting rainfall over a watershed, intense rainfall, or rainfall that causes rapid snow melt. Data shows that 100-year storm events will be more frequent as wetter climate systems continue to become more prominent and volatile.
Increasing Coastal Resiliency: Project Spotlights
In the face of a changing climate, communities must focus on building resiliency, which is the capacity to survive, adapt, and grow. The Estuary Program implements on-the-ground projects to increase resiliency in the estuary and the Morro Bay watershed.
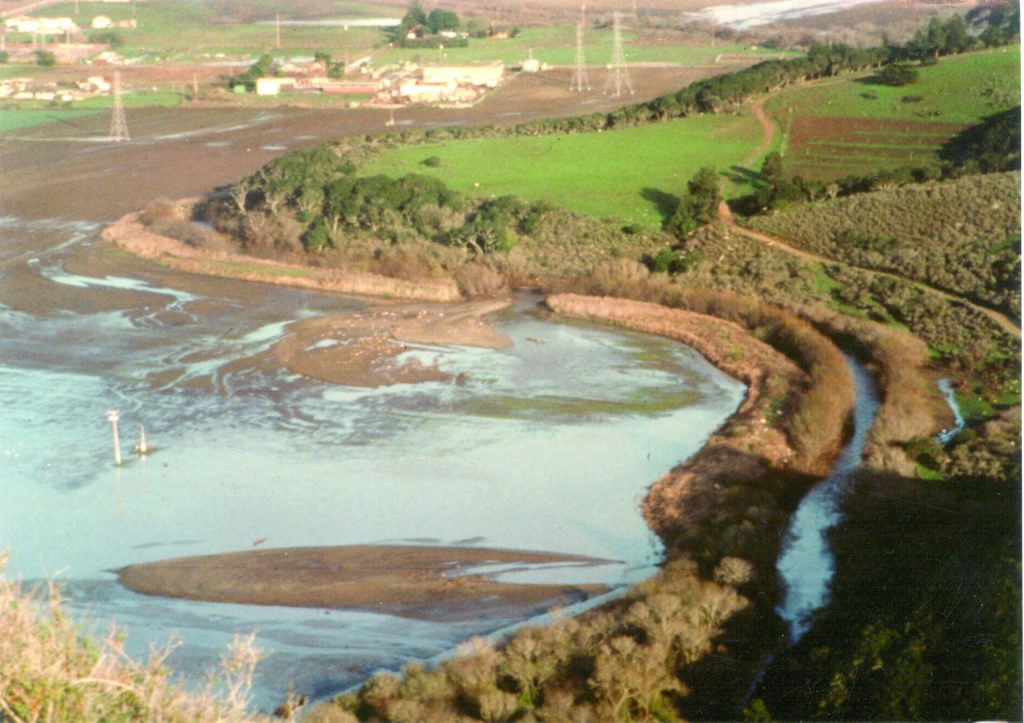
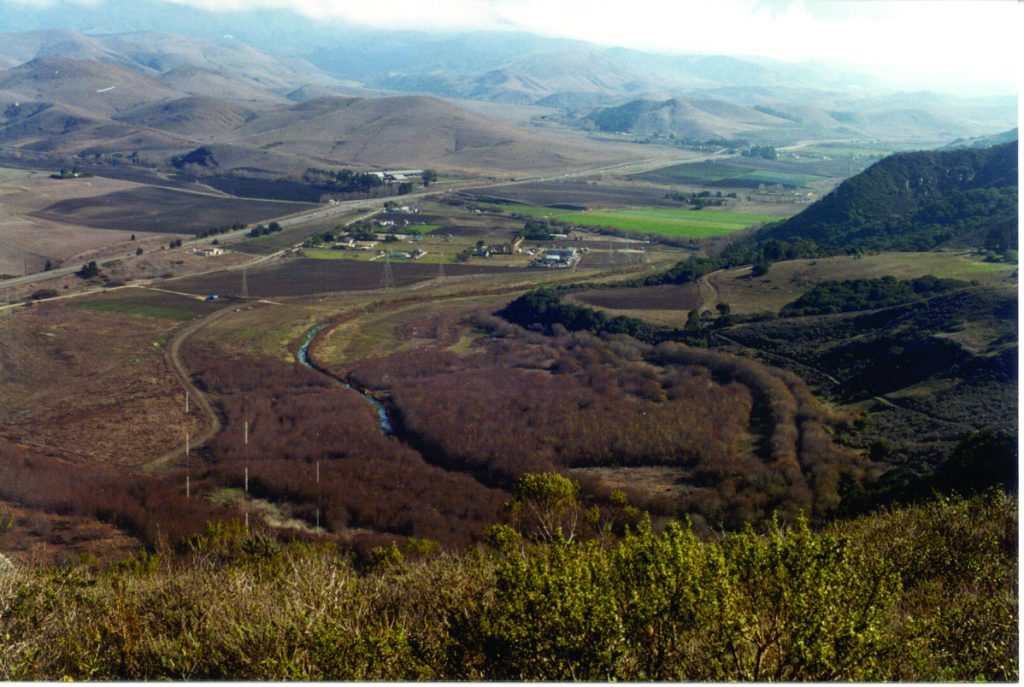
Floodplain Restoration: Historically, creeks were often restricted to narrow channels to prevent flooding of nearby fields and buildings. Unfortunately, this resulted in erosion, reduced water quality, and less habitat for aquatic wildlife. Floodplain restoration reconnects creeks to these low-lying adjacent areas, allowing them to flood during storm events. This creates habitat for fish, improves water quality, and allows water to percolate into the ground to recharge groundwater storage to increase resiliency in water supply and flood control.
These photos were taken before and after a successful floodplain restoration along Chorro Creek, called the Chorro Flats Enhancement Project. This project contributes to climate resiliency by allowing stormwater to spill over into the floodplain where it can slow, spread, sink, and nourish plants rather than rushing downstream and bringing excess sediment into the bay.
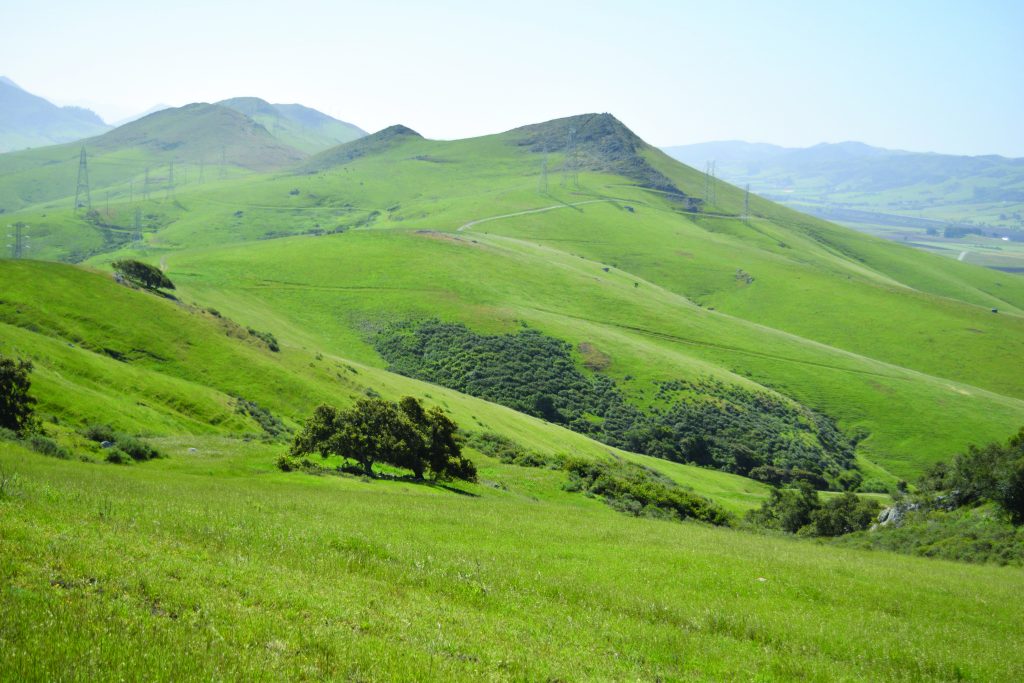
Land Protection: Strategies such as land preservation, acquisition, and easements create a land buffer to give habitats room to migrate as climates change and to protect migration corridors. For humans, these local planning efforts encourage development and climate-smart growth that allows coastal communities to be more responsive to the impacts of a changing climate. An easement in the Los Osos Valley (pictured here) protects a 540-acre ranch, which keeps the land in agriculture and prevents subdivision of the property for development.
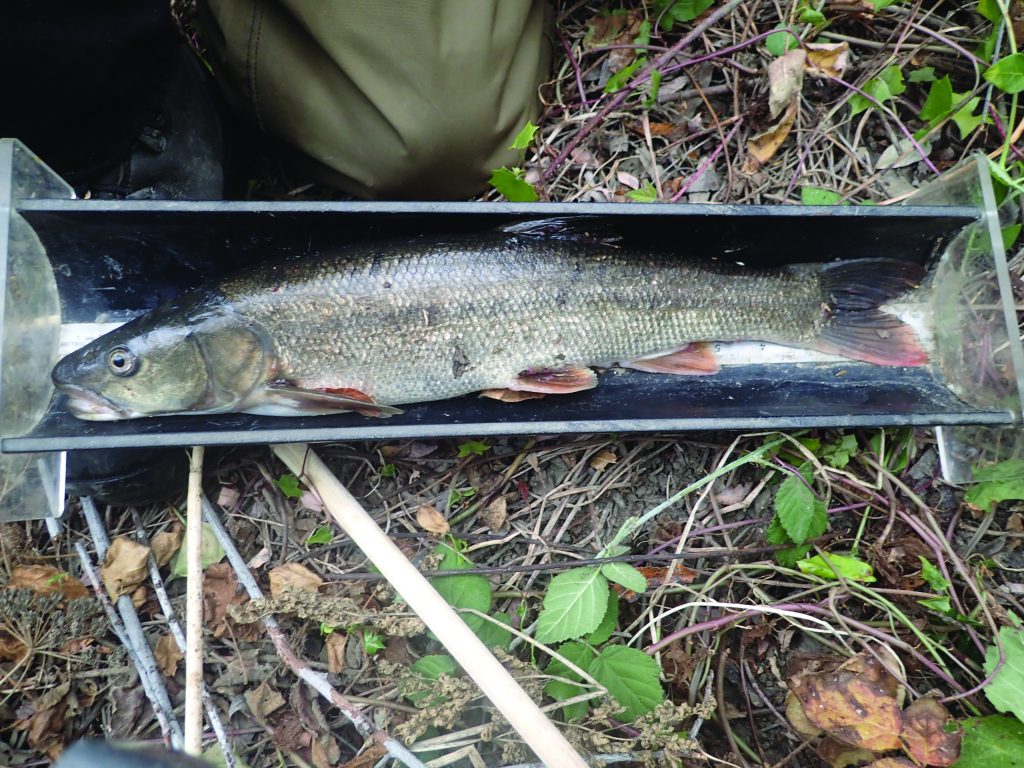
Invasive Species Management: Shifting climates sometimes favor invasive species to the detriment of native species. In our local creeks, climate change conditions such as warmer waters benefit invasive Sacramento pikeminnow (pictured here) over the native trout. The Estuary Program will continue to work with partners to manage invasive species and protect native species.
Data Notes
Coastal San Luis Resource Conservation District. (2002). Chorro Flats Enhancement Project Final Report to the California State Coastal Conservancy. Retrieved from http://www.coastalrcd.org/images/cms/files/Chorro%20Flats%20final%20report%20smaller.pdf
Geospatial Innovation Facility at UC Berkeley. (n.d.). Extreme Precipitation. Retrieved from https://cal-adapt.org/tools/extreme-precipitation/
Governor’s Office of Planning and Research, State of California Energy Commission, & California Natural Resources Agency. California’s Fourth Climate Change Assessment Statewide Summary Report, California’s Fourth Climate Change Assessment Statewide Summary Report (n.d.). Retrieved from https://www.energy.ca.gov/sites/default/files/2019-07/Statewide Reports- SUM-CCCA4-2018-013 Statewide Summary Report.pdf
Morro Bay National Estuary Program (2016). Climate Vulnerability Assessment Report. Retrieved from https://www.mbnep.org/wp-content/uploads/2016/11/Climate_Report_FINAL_11-30-2016_for-web.pdf
100 Resilient Cities. (n.d.). Urban Resilience. Retrieved from http://www.100resilientcities.org/resources/
Pierce, D. (n.d.). What is LOCA? Retrieved from http://loca.ucsd.edu/what-is-loca/
Radke, J. D., & Biging, G. S. (2017). Assessment of California’s Natural Gas Pipeline Vulnerability to Climate Change. California Energy Commission’s Climate Change Center. Retrieved from https://ww2.energy.ca.gov/2017publications/CEC-500-2017-008/CEC-500-2017-008.pdf
University of Wisconsin, Department of Atmospheric and Oceanic Sciences. (2018, August 28) http://wxguys.ssec.wisc.edu/2018/08/28/100yr-storm/
U.S. Department of Agriculture, Natural Resources Conservation Service, Wisconsin. (n.d.) https://www.nrcs.usda.gov/wps/portal/nrcs/detail/wi/programs/?cid=nrcs142p2_020752
U.S. Geological Survey. (2019, June 26). Hydrologic Unit Maps. Retrieved from https://water.usgs.gov/GIS/huc.html
Westerling, Anthony Leroy. (University of California, Merced). 2018. Wildfire Simulations for California’s Fourth Climate Change Assessment: Projecting Changes in Extreme Wildfire Events with a Warming Climate. California’s Fourth Climate Change Assessment, California Energy Commission. Publication Number: CCCA4-CEC-2018-014. https://www.energy.ca.gov/sites/default/files/2019-07/Projections_CCCA4-CEC-2018-014.pdf
Whitney, C. K., N. J. Bennett, N. C. Ban, E. H. Allison, D. Armitage, J. L. Blythe, J. M. Burt, W. Cheung, E. M. Finkbeiner, M. Kaplan-Hallam, I. Perry, N. J. Turner, and L. Yumagulova. 2017. Adaptive capacity: from assessment to action in coastal social-ecological systems. Ecology and Society 22(2):22 https://www.ecologyandsociety.org/vol22/iss2/art22/
How to Read Estuary Health Symbols
The Estuary Health Symbols represent how the status of each question is changing over time. A round symbol indicates that the trend is stable. An arrow indicates an improving trend (up arrow) or a worsening trend (down arrow). The color of the base of the arrow indicates the status of historical data and the color of the triangular part of the arrow indicates the status of the newer data. The color of the symbol indicates the status as follows: Good/Very Good (green), Fair (yellow), Poor (orange), Very Poor (red), and Unknown (grey).
-

This symbol indicates that the water quality was Very Poor and has improved to Poor.
-

This symbol indicates that the trend is stable but we lack adequate data to assign a status.
-

Very Good/Good
-

Fair
-

Poor
-

Very Poor
-
Unknown