Is water in the creeks and bay clean enough for fish and aquatic life?
Is water in the creeks and bay clean enough for fish and aquatic life?
Some areas are healthy and others are degraded.
The Estuary Program has been able to establish a long-running data set on bay and creek conditions thanks for to the dedication of its many volunteers and partners.
Clean water is important not only for humans but also for the wildlife that call those waters home. To provide healthy habitat, the water must be well-oxygenated and free of pollutants. Estuary Program staff and volunteers have been monitoring the creeks and bay for over twenty years to track long-term conditions.
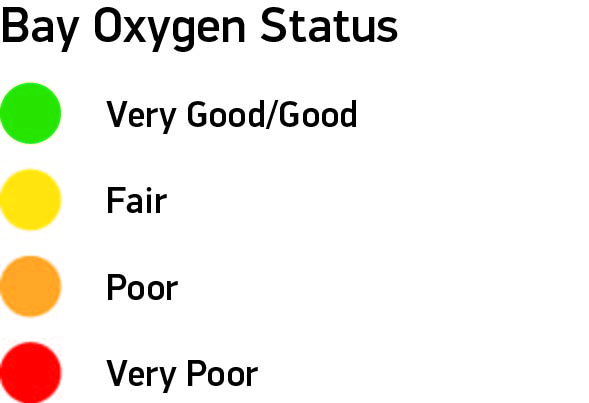
Bay Oxygen Status
Indicator symbol: Poor
Hover symbol for indicator information
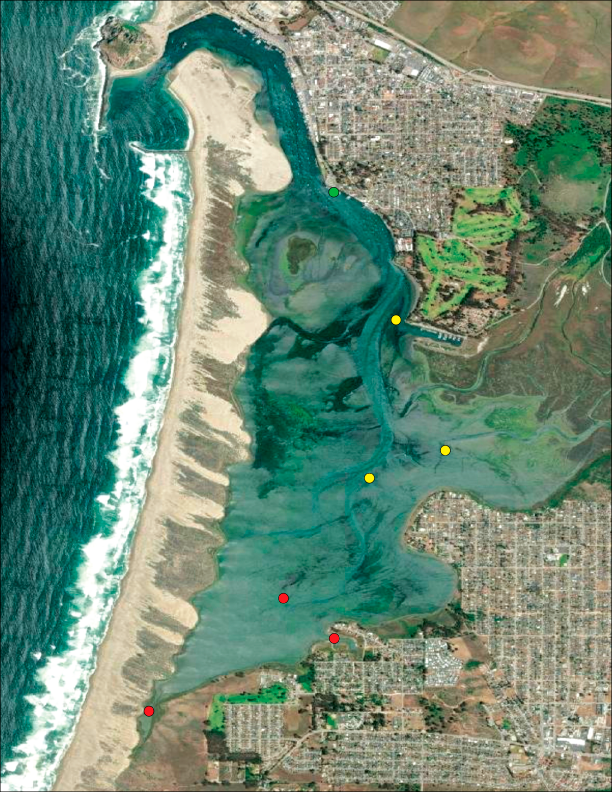
Fish and other aquatic life need adequate levels of oxygen to thrive. Typically, the lowest oxygen values of the day occur around sunrise. To track the minimum oxygen levels around the bay each month, Estuary Program volunteers paddle to seven sites in the early morning hours to measure the levels of oxygen in the water. The data, which goes back to 2002, shows a consistent trend of higher oxygen levels toward the front of the bay and lower levels toward the back of the bay. This is thought to be due at least in part to the shallowness of the back bay waters. The incoming tide easily pushes colder well-oxygenated water from Estero Bay through the deeper channels in the front bay, but these waters don’t always make it to the southern-most part of the bay. The shallower waters also warm more quickly in the sun, which can reduce their oxygen levels. Oxygen trends have been relatively stable, with some improvement at Tidelands Park.
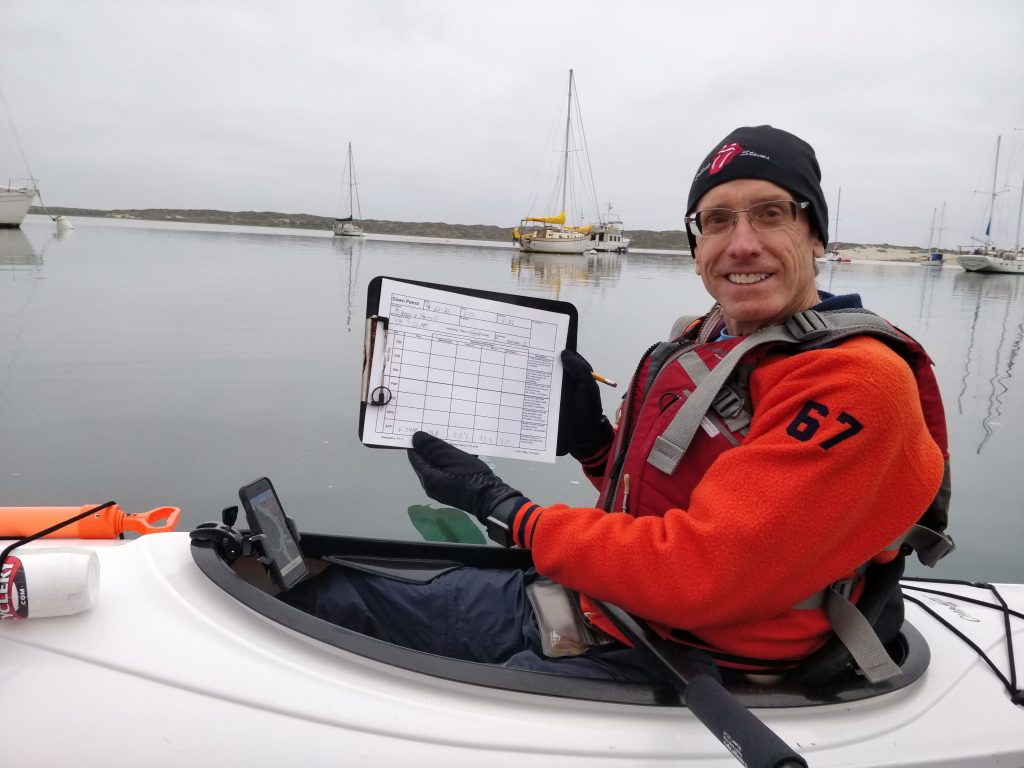
The Estuary Program’s dedicated Dawn Patrol volunteers wake up early and head out on the bay to measure temperature and dissolved oxygen levels.
Nitrates Status in the Watershed
Indicator symbol: Poor
Hover symbol for indicator information
While nitrates are essential for plant growth, excess nitrates can cause an imbalance in an aquatic system. Sources of nitrates include agricultural and residential fertilizing, faulty septic systems, and wastewater treatment plants. When nitrates contaminate groundwater and surface waters, the health of humans and aquatic life can suffer. High nitrates in creeks or the bay can stimulate algae growth that can crowd out other aquatic life and deplete the water of oxygen.
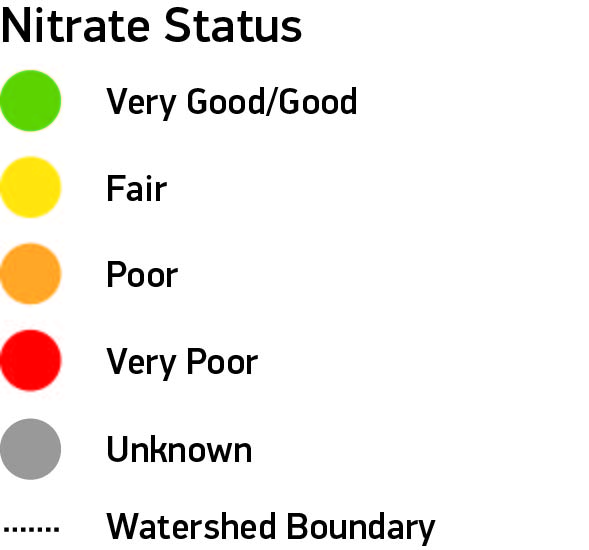
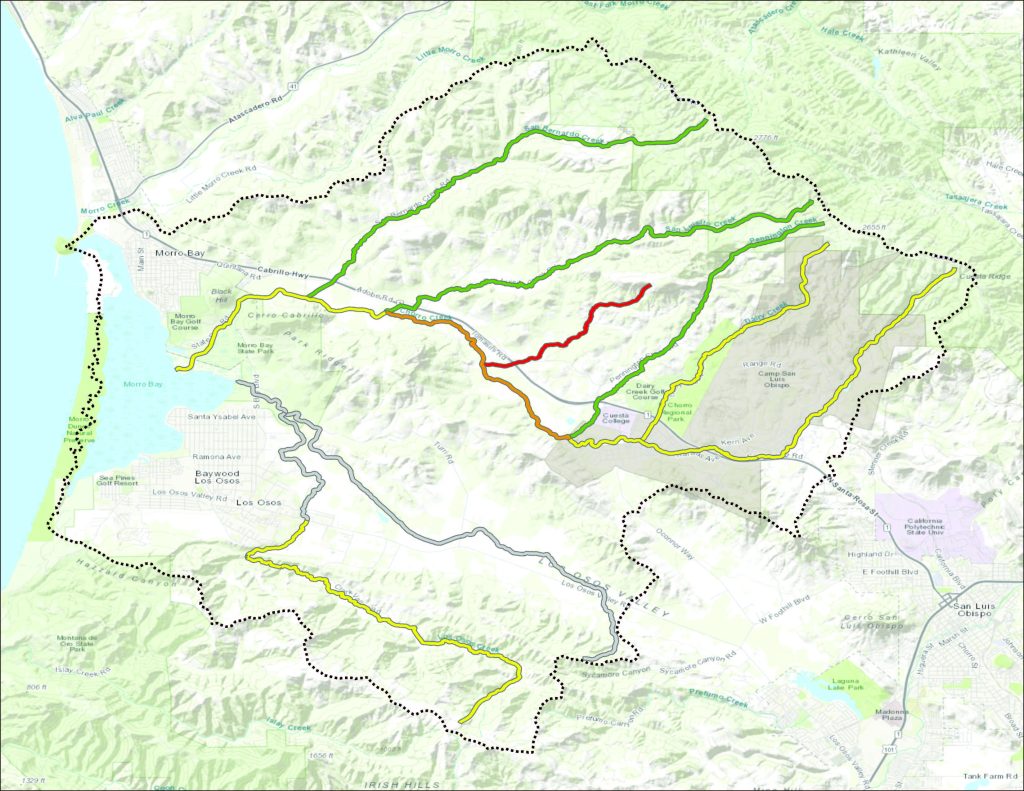
The map shows summarizing data from 2001 through 2021 for each creek segment in the watershed. Upper Los Osos Creek, Upper Chorro Creek, and the creeks that drain into Chorro Creek (Dairy, Pennington, and San Luisito Creeks) have Good (low) levels of nitrates. Middle and Lower Chorro Creek and Warden Creek have Very Poor nitrate levels, which means the high concentrations of nitrates make it difficult for the most sensitive wildlife to thrive. The creek segments that are greyed out show areas where we lack adequate data to make an assessment.
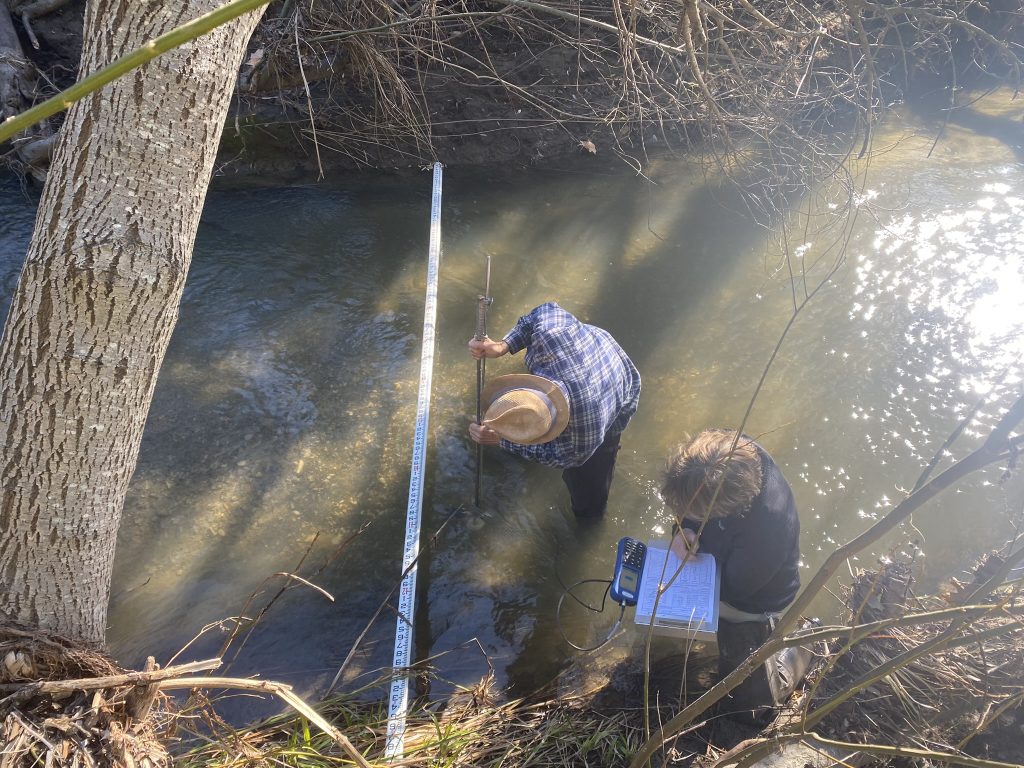
The Estuary Program’s long-running data set would not exist without the dedication of our volunteers. These folks head out in all kinds of weather to collect valuable data that helps us assess the health of our creeks and bay. This team is measuring flows in San Luisito Creek.
Creek Changes with the Seasons: Algae and Oxygen
Even in a watershed with a mild Mediterranean climate, our creek systems feel the effects of changing seasons. In winter, the water is cold and rainfall events can raise water levels. Heading into the summer, water temperatures heat up and the tributaries can begin to go dry. These shifting conditions can impact the wildlife that live there. To track water quality changes with the seasons, the Estuary Program uses water quality sensors to continuously track important data for healthy freshwater habitat, including temperature, conductivity/salinity, dissolved oxygen, pH, water depth, and chlorophyll.
Flow rates change dramatically between winter (left) and summer (right). Clumps of filamentous algae can be seen growing during the summer in the warm, slow-moving water. Photos were taken during water quality monitoring at the same site along Chorro Creek.
These graphs depict temperature and dissolved oxygen concentrations over a week-long deployment at the same site at different times of year. In the summer (shown in red), water temperatures rise while dissolved oxygen concentrations fall and become much more variable.
The recent addition of chlorophyll pigment sensors allows for continuous measurement of changes in algal concentrations. This new data will help further our understanding of how algae in the watershed impacts the health of habitats for fish and other aquatic life. /
As the Estuary Program continues its deployments, we will further improve our understanding of these processes and how to best interpret them to protect water quality and sensitive species. The Estuary Program and its partners also work with public and private landowners to reduce nutrient loading to our creeks and to increase shade along the creeks, both factors that can help reduce algal growth.
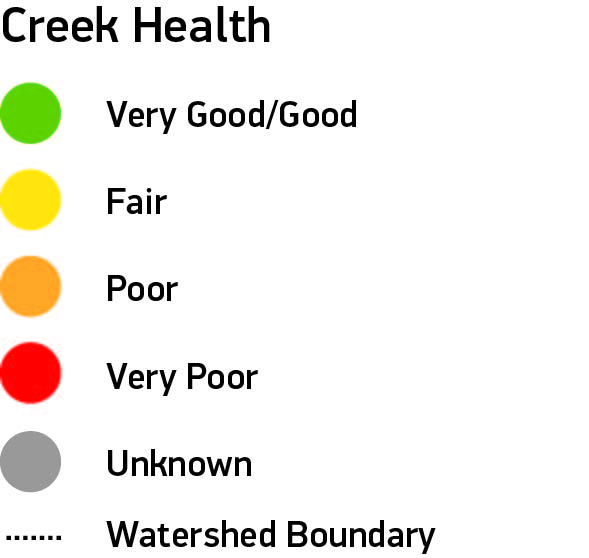
Creek Health in the Watershed
Indicator symbol: Unknown
Hover symbol for indicator information
Trend status: Scores remain stable, with slight decreases at Upper Los Osos, Walters, and Dairy Creeks (note: there was a change in analysis method). No scores were available from areas that we suspect are heavily impacted.
Fish and other aquatic life rely on a healthy creek ecosystem. One of the ways we monitor the health of our creeks is by collecting and analyzing the insects that live in creek beds. Certain species are sensitive and can survive only in very clean waters, while other species can tolerate high levels of pollution. Creeks where we find more pollution-sensitive species are more likely to have better quality habitat than creeks with more pollution-tolerant species.
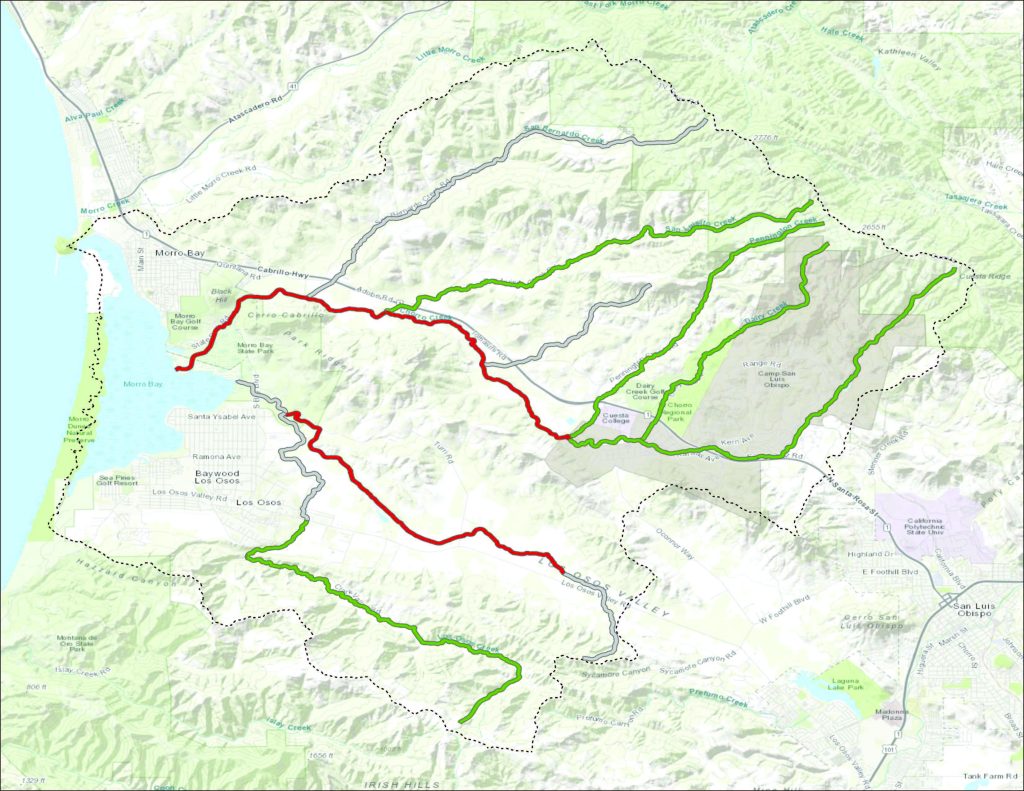
The map above shows the average health scores for each creek or stretch of creek within the watershed, using data going back to the early 1990s. The segments of creek shown in green have scored as Good, meaning that they can support sensitive species of macroinvertebrates, while sections in red have scored as Very Poor, meaning that the creek may not be able to support sensitive macroinvertebrates. Walters Creek stands out in the watershed as having Very Poor scores, which is due in part to low water levels.
How We Monitor Creek Health
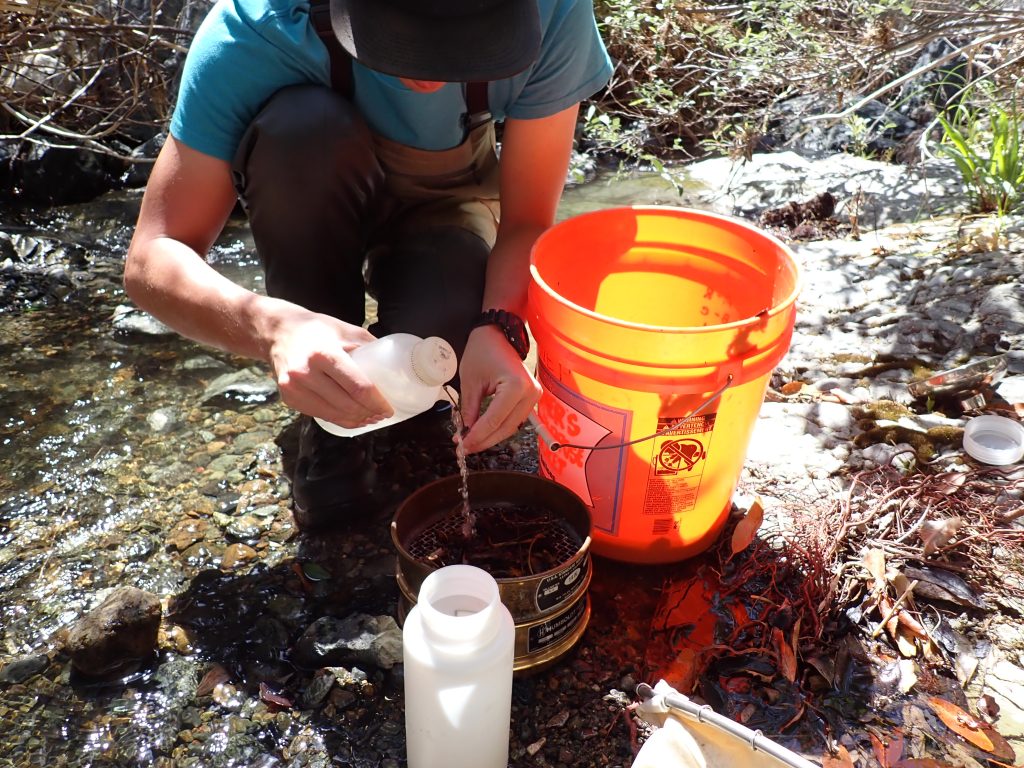
Each spring, the Estuary Program completes a biological assessment (or bioassessment) of ten local creek sites. The assessment has two main components: habitat measurements and benthic macroinvertebrate collection.
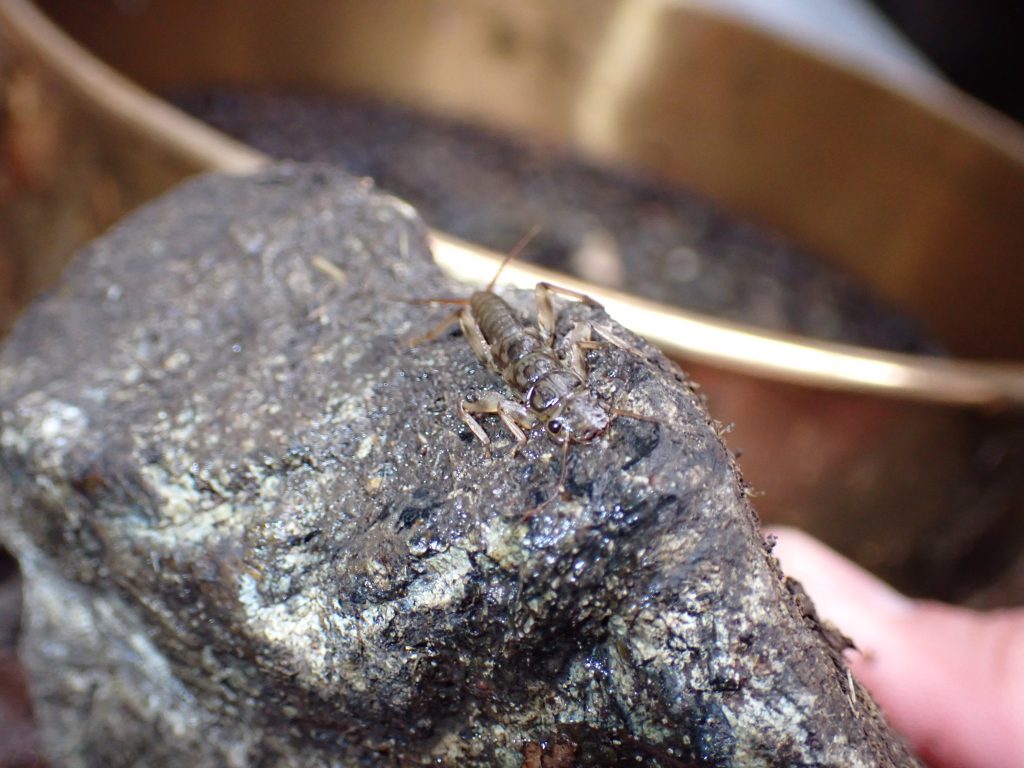
Benthic macroinvertebrates are bottom-dwelling animals visible to the naked eye that lack a backbone. They are great indicators of water quality, since some are very sensitive to pollution while others are very tolerant of pollution. If we find lots of pollution-sensitive macroinvertebrates in our sample, it’s likely that the water quality is good. If we find only pollution-tolerant macroinvertebrates, the water quality is likely poor.
The Estuary Program completes bioassessment surveys each spring. One aspect of this monitoring is benthic macroinvertebrate collection. Some macroinvertebrates, like the stonefly larvae pictured here, are sensitive to pollution. If a creek supports pollution-sensitive macroinvertebrates, the water quality is likely good.
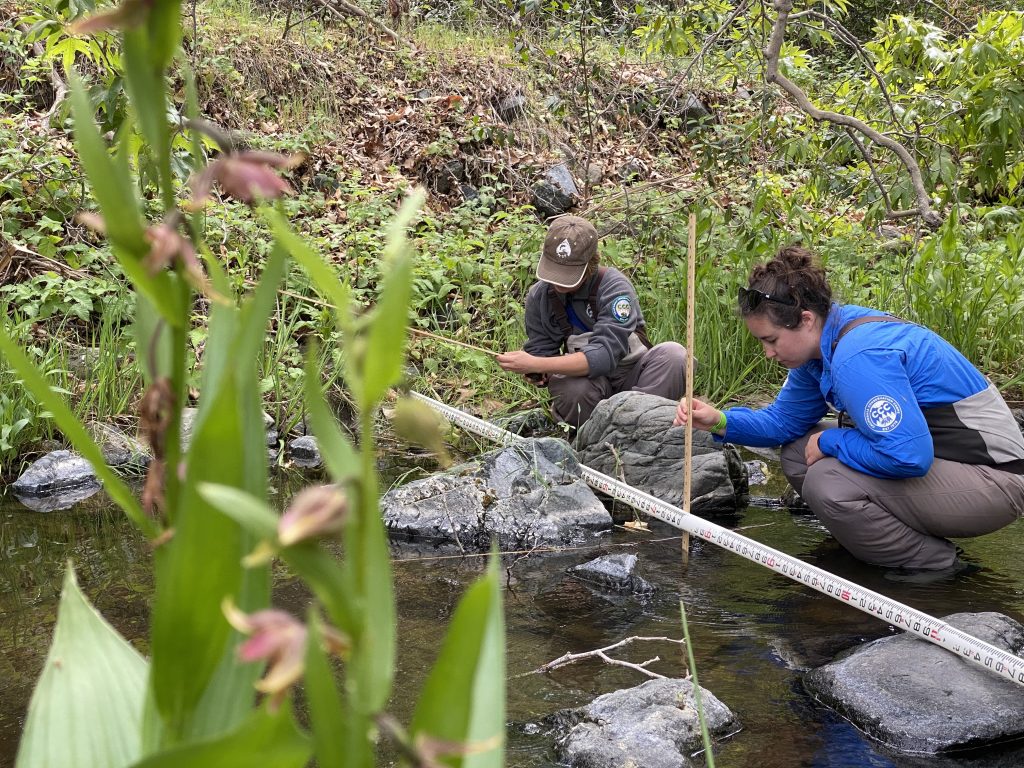
Bioassessment surveys also include habitat measurements. Some of these measurements include how stable the stream banks are; how much the surrounding trees shade the creek to keep the water cool; and how steep the stream is. This information helps us understand habitat quality, both for macroinvertebrates and for the fish that feed on them.
To see bioassessment monitoring in action, check out this video:
What's Behind the Creek Health Scores?
When comparing data for this report to previous reports, the creek health scores have degraded on Dairy, Walters, and Los Osos Creeks. This is not due to worsening conditions, but rather a change in the method of analysis utilized by the Water Board (the agency tasked with protecting waterways in the state). The new metric uses site-specific information like climate, geology, and watershed size to determine creek health. The new analysis method resulted in a slight decrease in scores at Walters, Dairy, and Upper Los Osos Creeks, which dropped their health grades down a category.
Thank you to the Harold J. Miossi Charitable Trust!
This important and long-running dataset would not be possible without the generous contributions of the Harold J. Miossi Charitable Trust. The Trust has contributed over $100,000 to this effort since 2013 and has pledged to continue their support in 2023 and 2024. We are excited to continue this work with the Trust to collect this important data.