Keeping Track of Estuary Health
The Morro Bay estuary is a complex and dynamic system. Tidal cycles, the input of freshwater from creeks, runoff during rain events, and many other factors alter the water quality in our local estuary. When we consider estuary health, we examine the bacteria present in the water to protect human health and the amount of oxygen in the water to protect wildlife.
The Estuary Program monitors both parameters monthly with the help of volunteers and has compiled long-term datasets that reveal trends in estuary health over time. The Estuary Program releases the latest results in an annual memo. The figures and data presented here are available in more detail in our website library.
Monitoring Bacteria to Protect Human Health
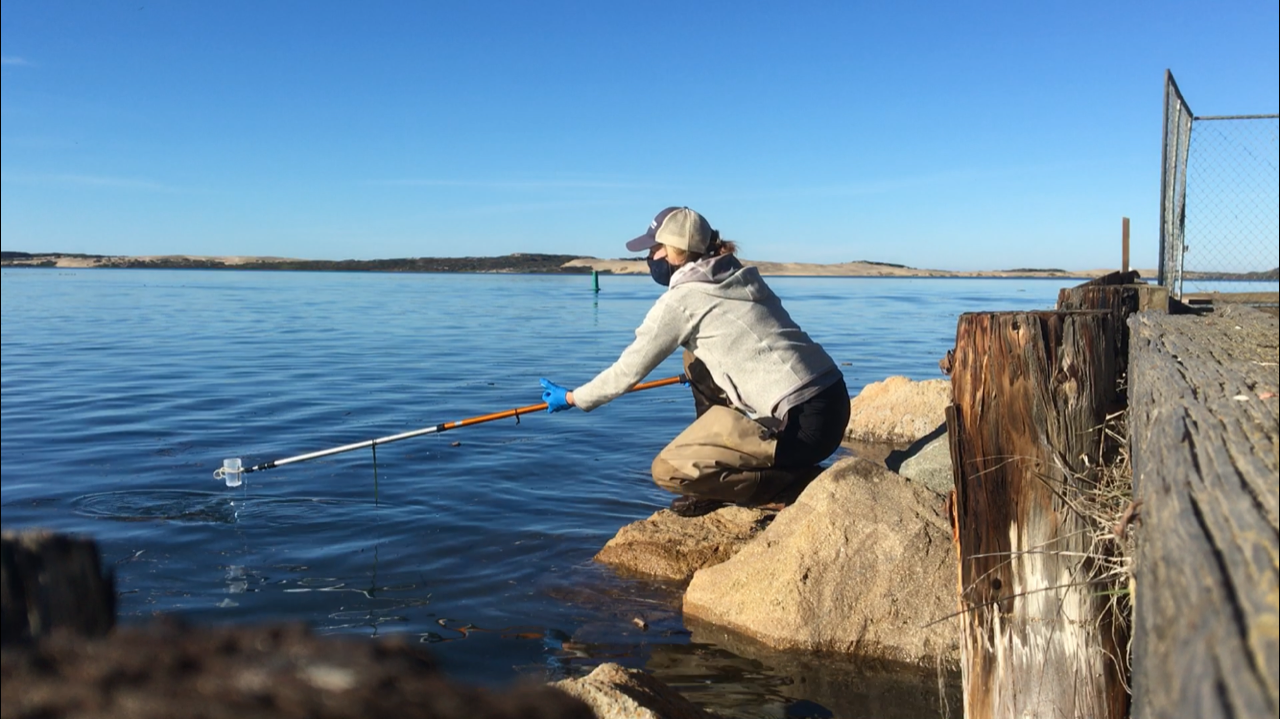
Monitoring bay bacteria is an essential component of understanding water quality, especially in an estuary like Morro Bay that is a popular recreation destination and has active oyster farms. The presence of bacteria in the water is not necessarily a cause for alarm, as over 98% of biomass in the ocean is made up of microbes including bacteria. However, certain types of bacteria are more likely to cause sickness and are considered “indicators” of unsafe swimming conditions. In marine waters, we test for an indicator bacteria called Enterococcus spp. which tends to be present when fecal contamination is present.
For water to be considered safe for swimming, levels of Enterococcus must remain below a standard established by the state of California. Ideally, no more than 10% of samples collected at each location exceed this protective standard.
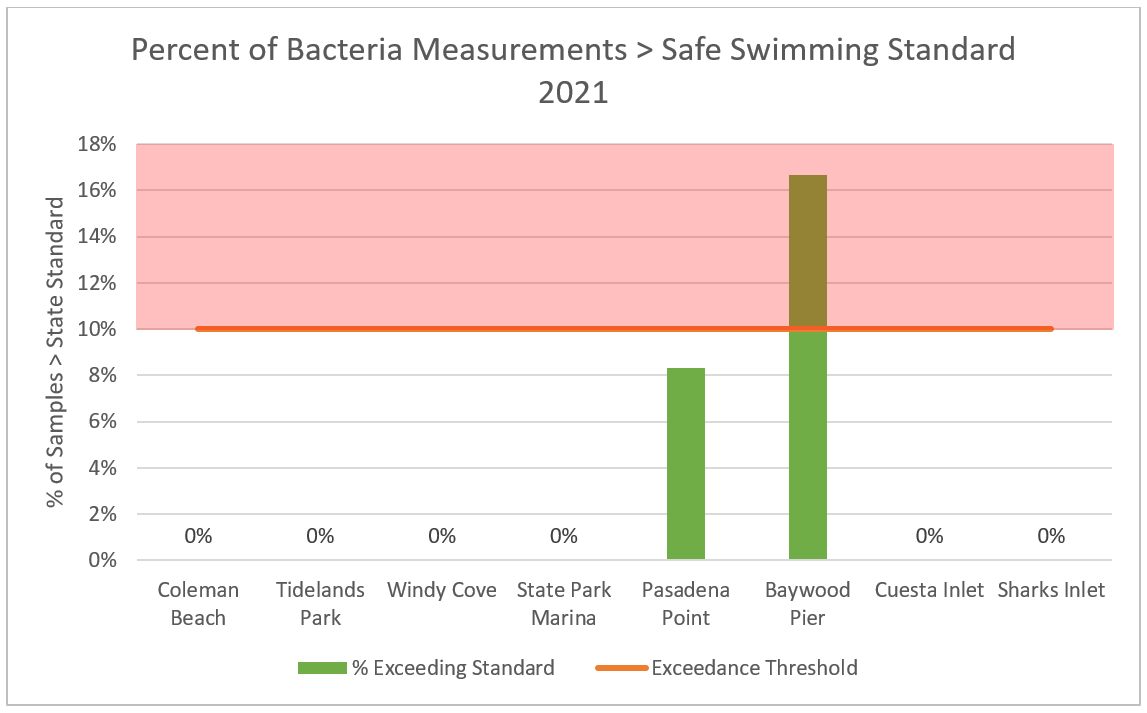
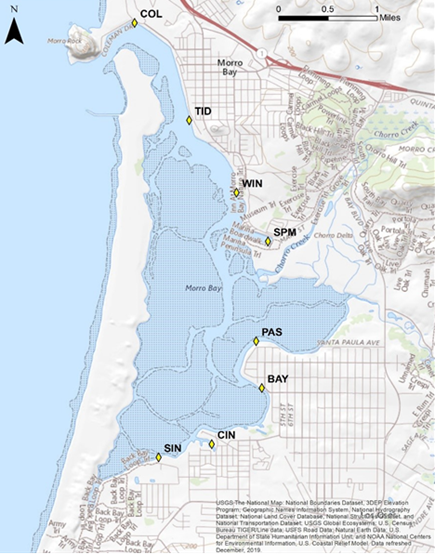
The Estuary Program staff and volunteers monitor eight shoreline locations that were selected because they are popular locations for on-the-water recreation. Out of these sites, Pasadena Point and Baywood Pier most commonly experience elevated bacteria levels. Part of the explanation for this trend is their location in the back bay where the waters are shallower and less well-mixed by the tides. This can lead to stagnant, warmer waters and higher bacteria levels. Runoff from the land in both of these locations can transport bacteria into the bay. Abundant wildlife is another potential bacteria source.
Regardless of how what bacteria levels are under normal conditions, Surfrider and Heal the Bay recommend staying out of the water for 72 hours following a storm, since stormwater runoff can contain high amounts of bacteria.
Monitoring Oxygen to Protect Wildlife
The term dissolved oxygen, often abbreviated as DO, is the concentration of oxygen present in the water. The number is expressed in milligrams of oxygen per liter of water (mg/L). In general, higher DO values mean healthier water since this translates to more oxygen available for aquatic organisms.
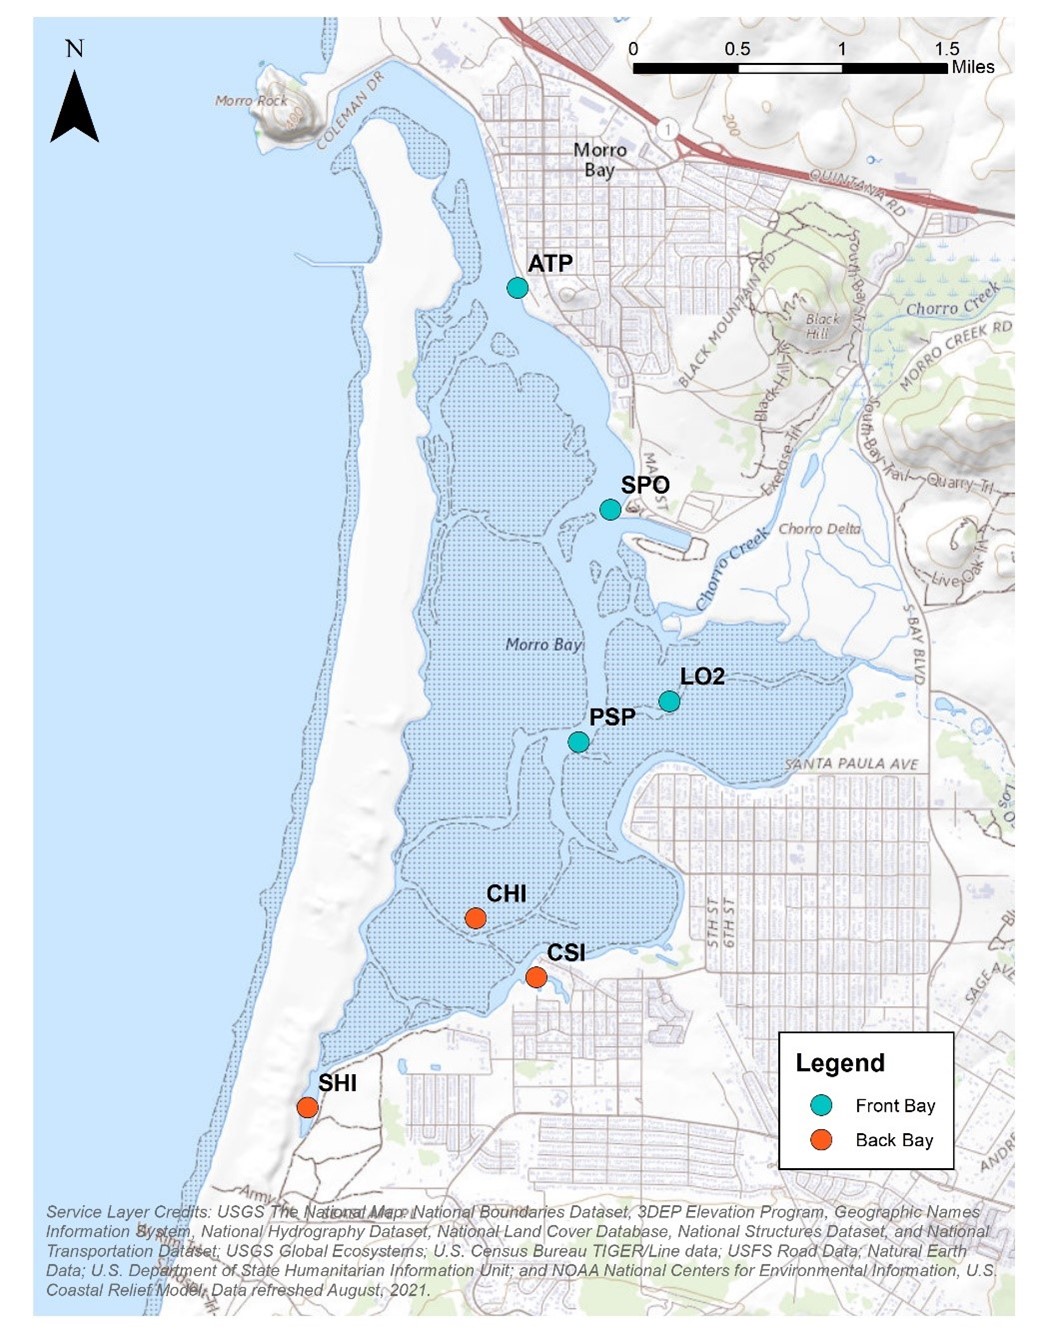
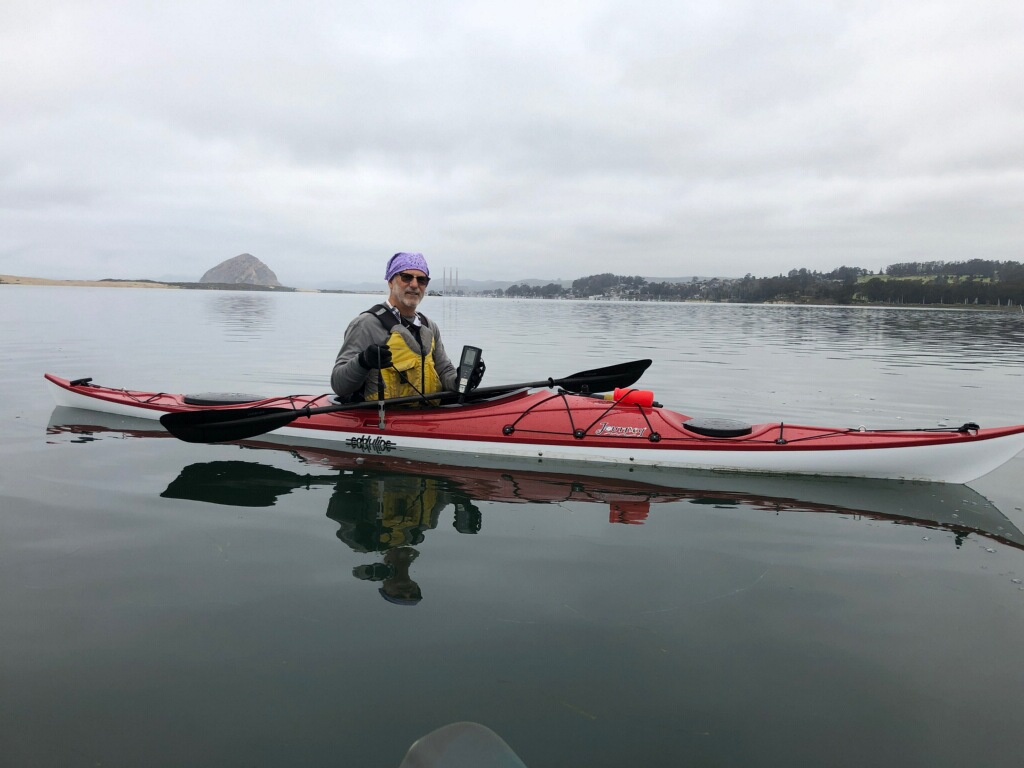
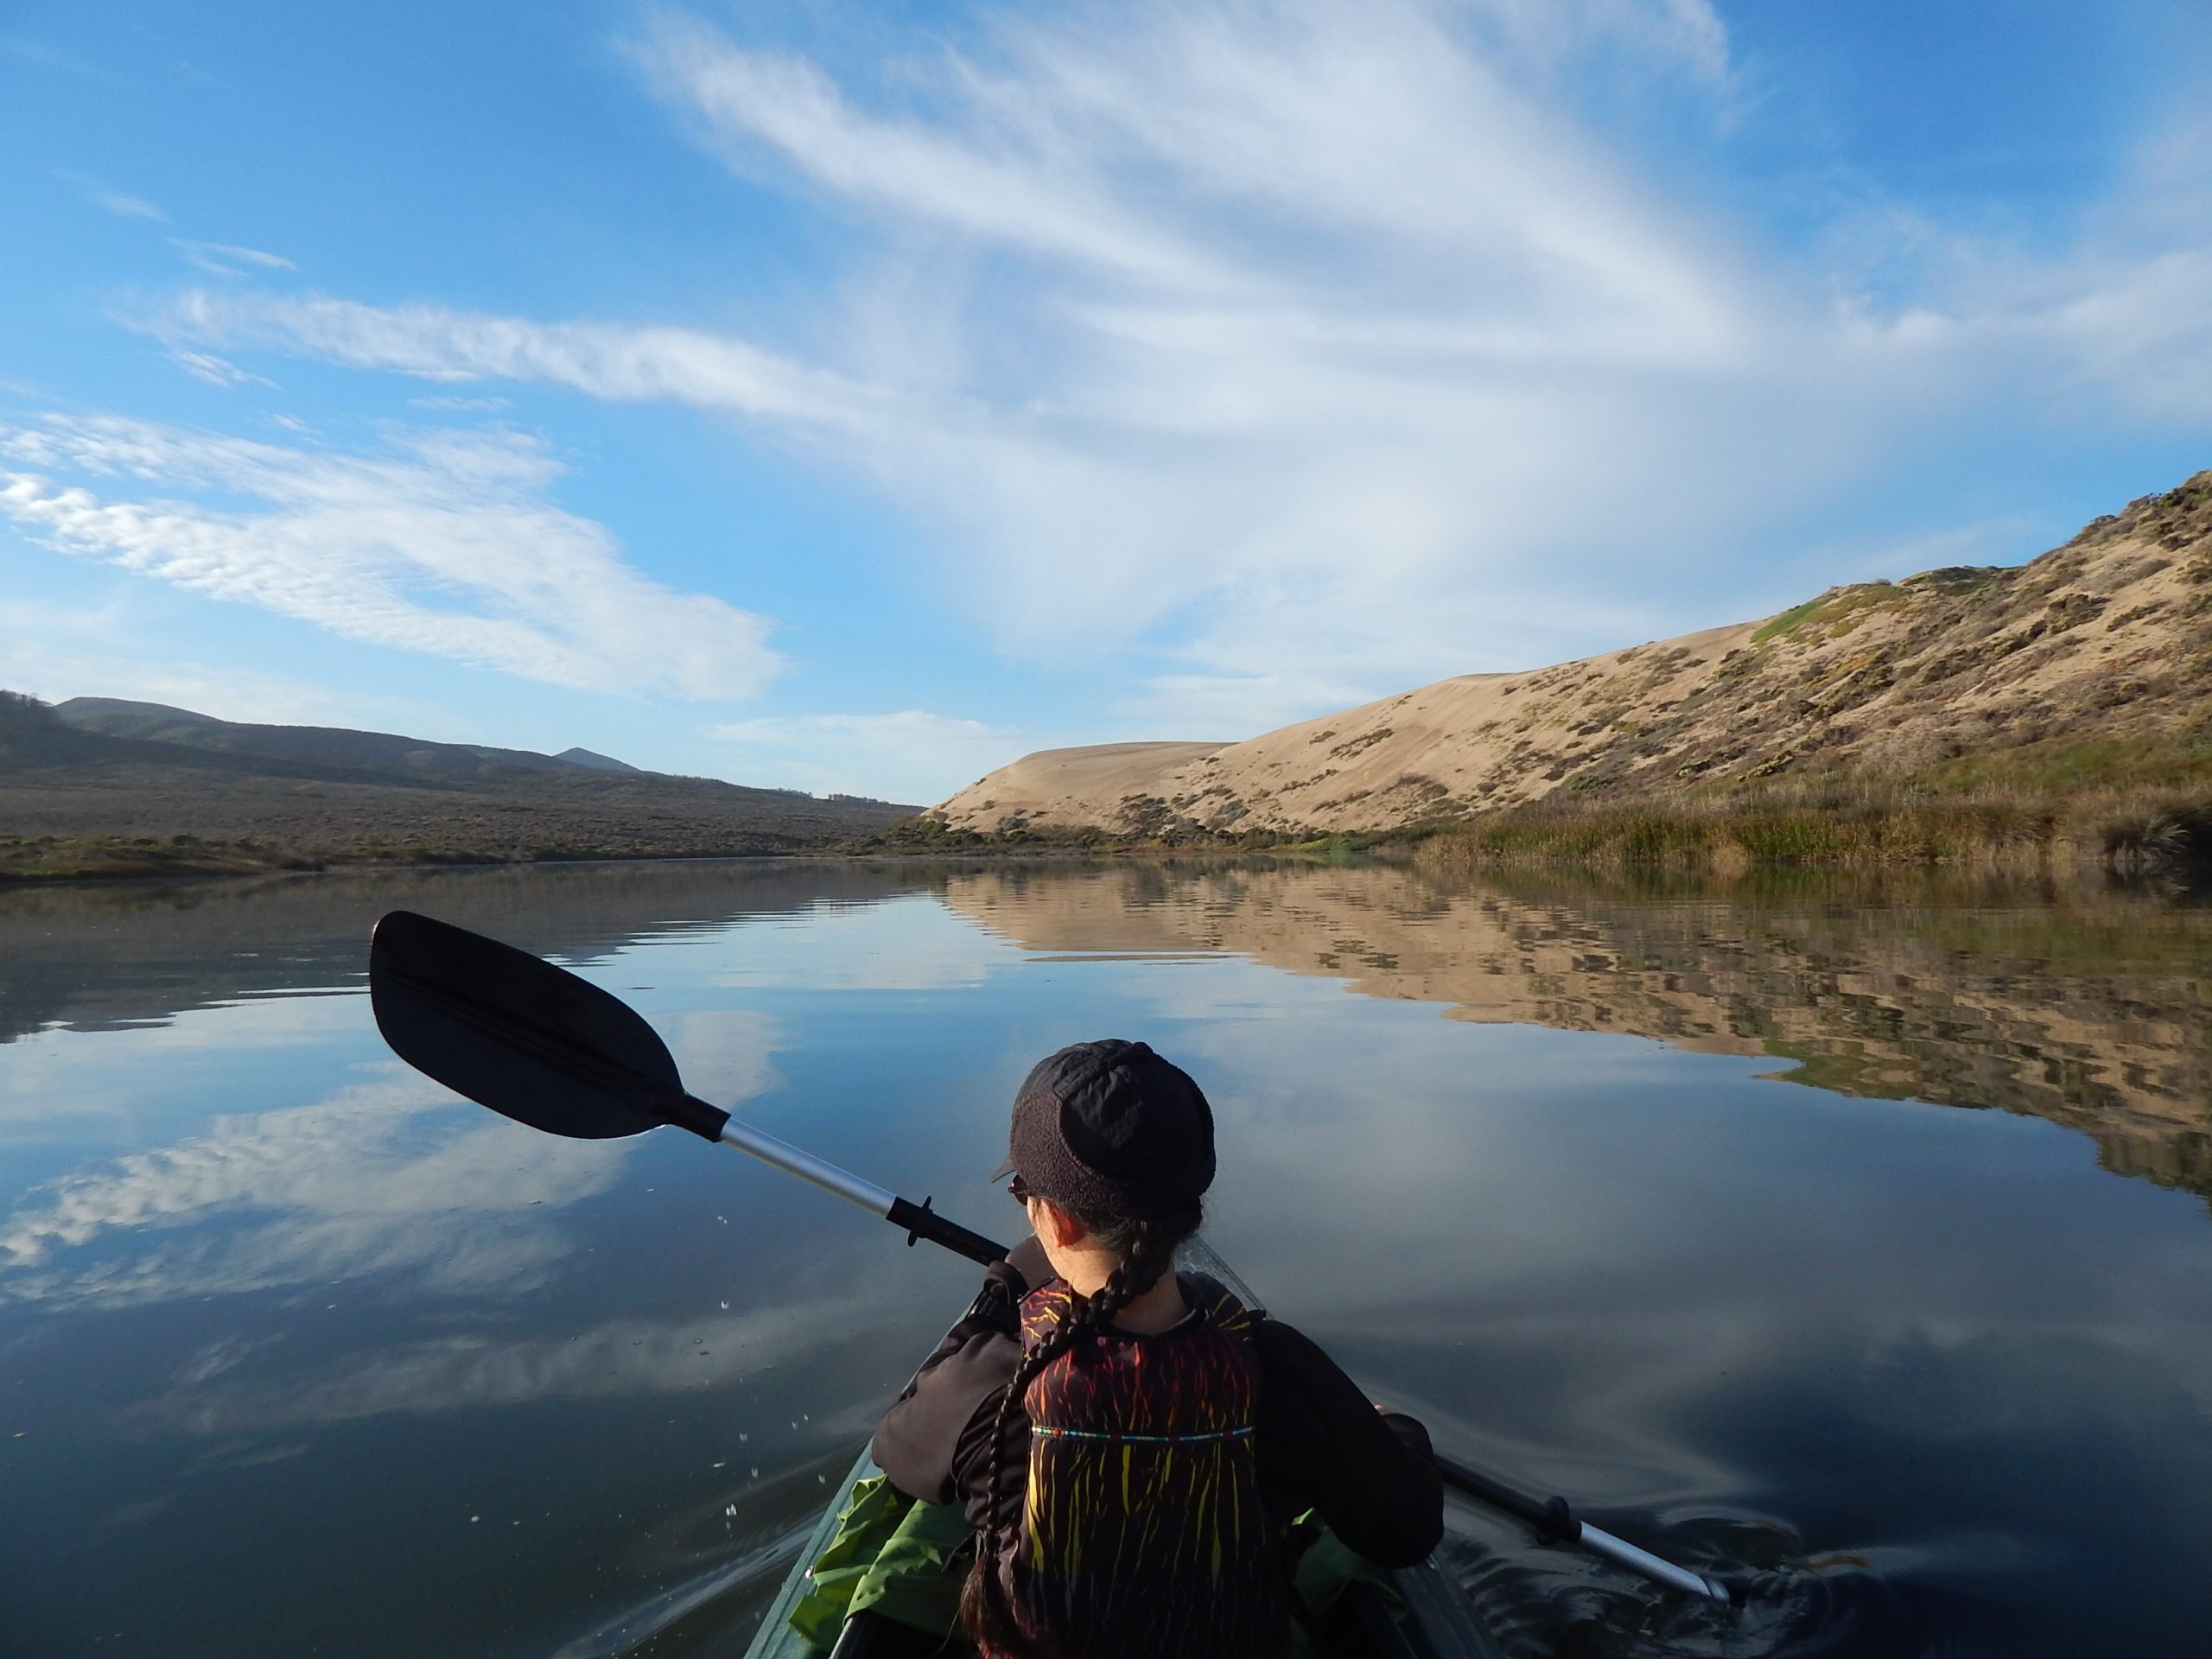
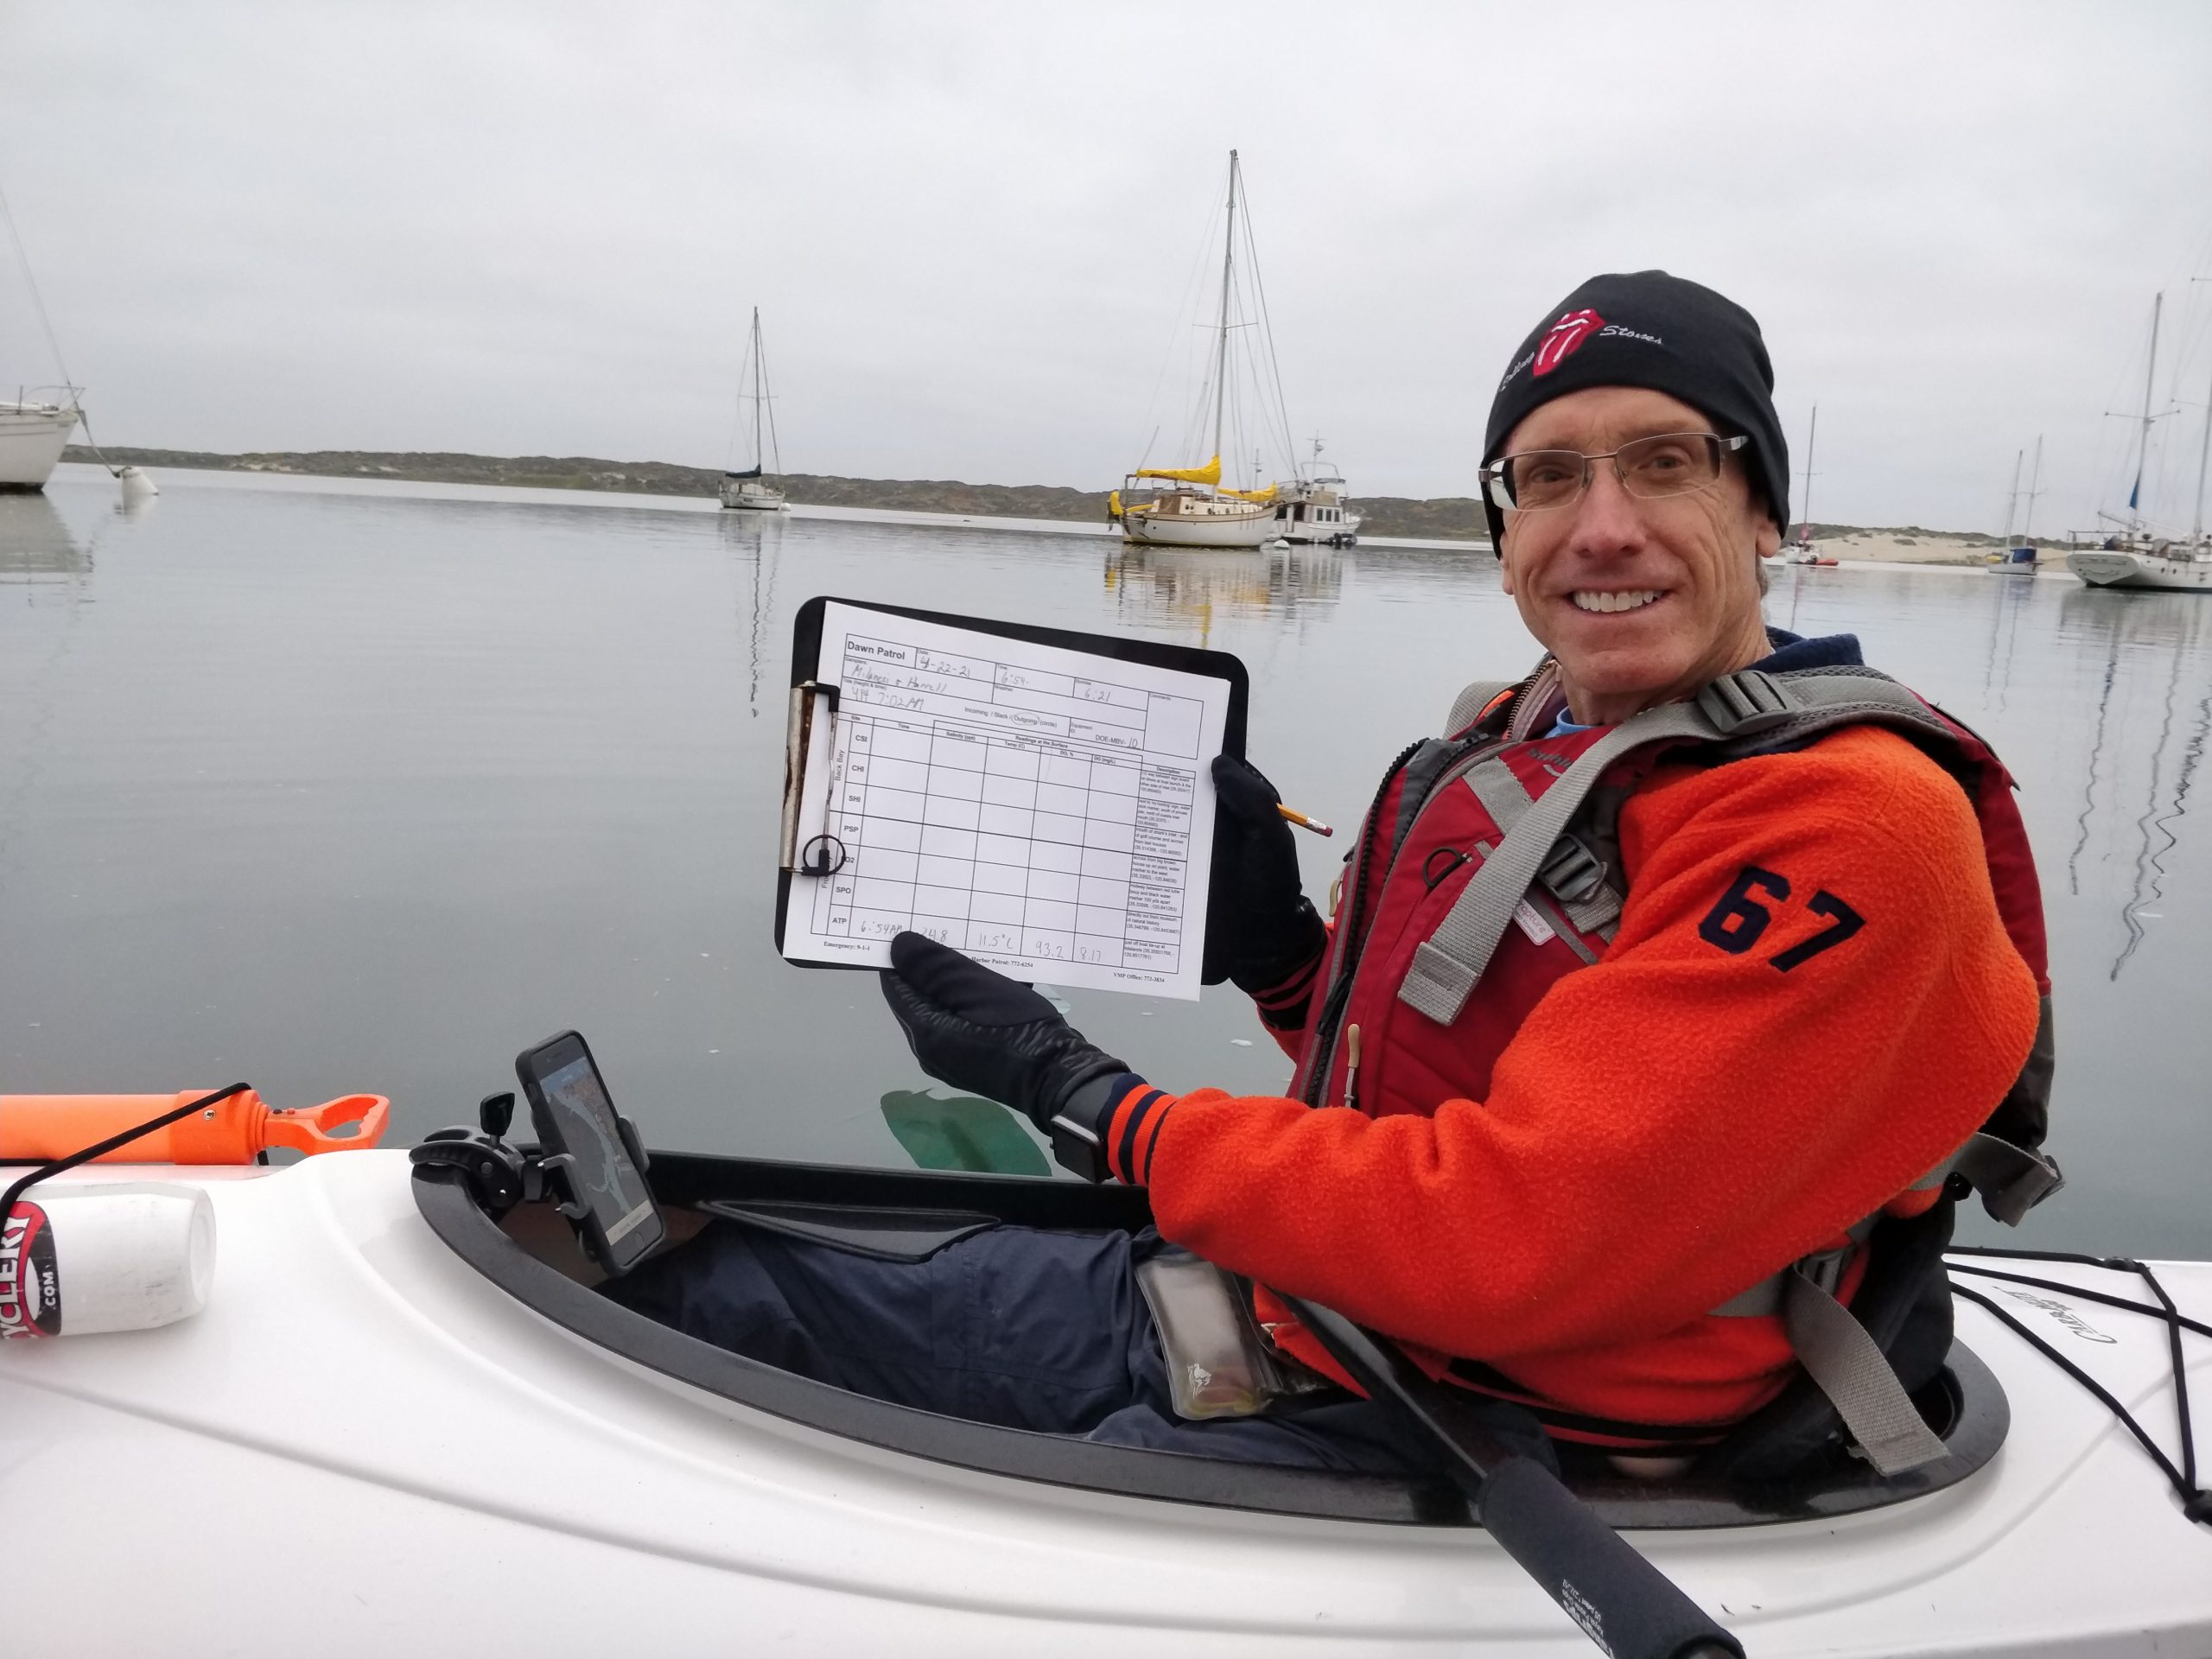
Each month, our Dawn Patrol volunteers venture out via kayak in the early morning hours to collect data. They collect dissolved oxygen measurements at seven monitoring locations that have been grouped into two categories: Front Bay and Back Bay. Front Bay sites are closer to the mouth of the bay and are located along the deeper well-mixed main channels, while Back Bay sites are further from the mouth and typically experience poor circulation.
The graph below displays how average DO concentrations differ between the two groups of sites. To be able to sustain aquatic life, DO concentrations must remain above 7 mg/L. When concentrations drop below this threshold, animals begin to feel stressed due to the inadequate oxygen levels. If this continues for extended periods of time, sensitive organisms may die.
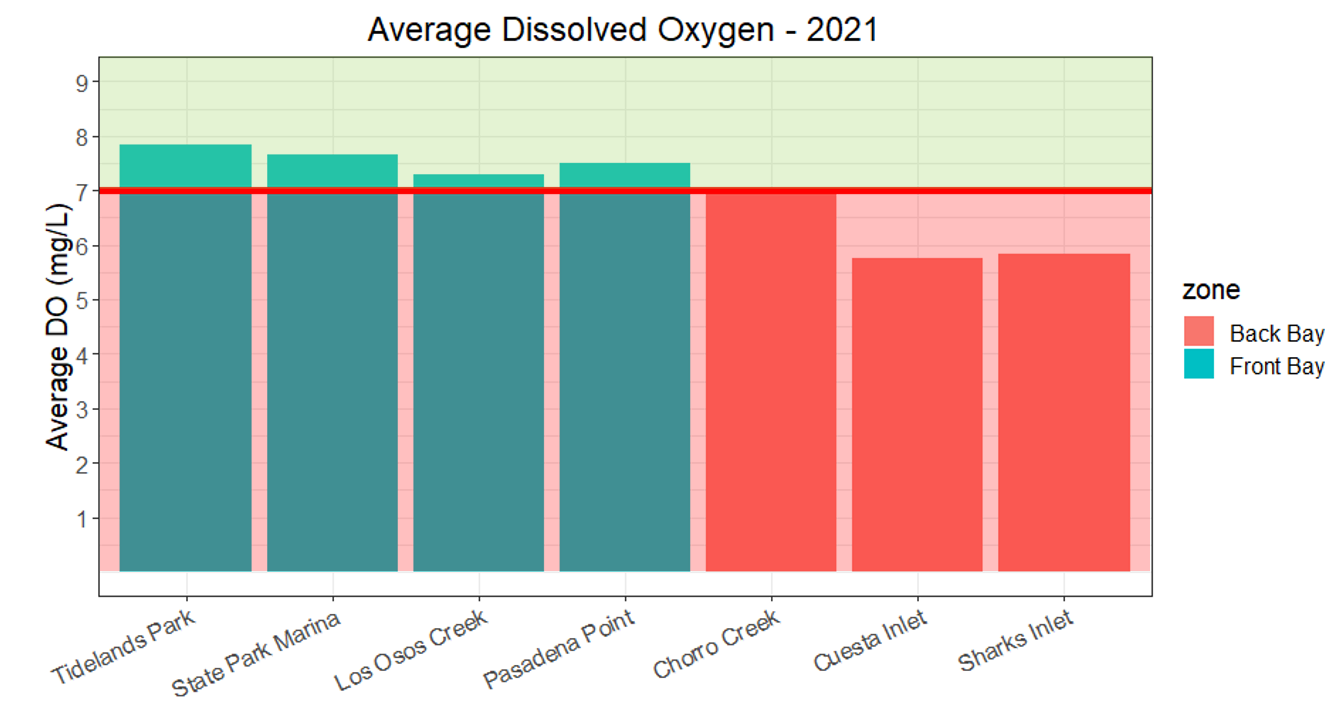
Shallow depths and poor water circulation likely contribute to the depressed oxygen levels in the back bay. This part of the bay is considerably shallower than the front bay, meaning these waters tend to warm up faster throughout the day. Since warm water is not able to hold on to as much oxygen as cold water, this can result in lower levels of dissolved oxygen. The front bay benefits from cold, well-oxygenated water being pushed in with the incoming tide from the ocean, and these waters don’t always make it to the back bay to help replenish oxygen levels.
Thank You, Volunteers!
These datasets highlight the importance of our volunteer monitoring program. With the help of dedicated volunteers, we have collected bacteria samples in the estuary since 2005 and dissolved oxygen measurements since 2002! Having long-term datasets allows the Estuary Program to explore how the health of the estuary changes over time.
While the Estuary Program is not recruiting any new volunteers at this time, additional opportunities may arise in the future. If you’d like to stay up to date with how to get involved, keep an eye on volunteer page, or check out opportunities through some of our partner organizations.
Subscribe to our weekly blog to have posts like this delivered to your inbox each week.
Help us protect and restore the Morro Bay estuary!
- Donate to the Estuary Program today and support our work in the field, the lab, and beyond.
The Estuary Program is a 501(c)3 nonprofit. We depend on funding from grants and generous donors to continue our work. - Support us by purchasing estuary-themed gear from ESTERO. This locally owned and operated company donates 20% of proceeds from its Estuary clothing line and 100% of Estuary decal proceeds to the Estuary Program. Thank you, ESTERO!
- Purchase items from the the Estuary Program’s store on Zazzle. Zazzle prints and ships your items, and the Estuary Program receives 10% of the proceeds. Choose from mugs, hats, t-shirts, and even fanny packs (they’re back!) with our fun Estuary Octopus design or our Mutts for the Bay logo.
Thank you for helping our beautiful, bountiful, biodiverse bay!