The Estuary Program monitors water quality conditions throughout the watershed to understand changing conditions and prioritize conservation efforts. One of the ways we monitor conditions in our freshwater streams is through biological assessment, or bioassessment surveys. The data they provide gives us a framework for understanding creek health and changing conditions over time.
What the Bugs Tell Us
The data collected during bioassessment surveys includes upwards of 1,000 data points per survey, including channel slope, tree cover, bank stability, and much more. While each data point is important, perhaps the most revealing data comes from collecting the bottom-dwelling insects, or benthic macroinvertebrates.
These creatures are great water quality indicators since certain species are sensitive to pollution and others are tolerant. If we collect a sample with lots of pollution-sensitive species, we can assume that the creek is fairly healthy. Alternatively, a sample with only pollution-tolerant species may indicate less-than-ideal conditions.
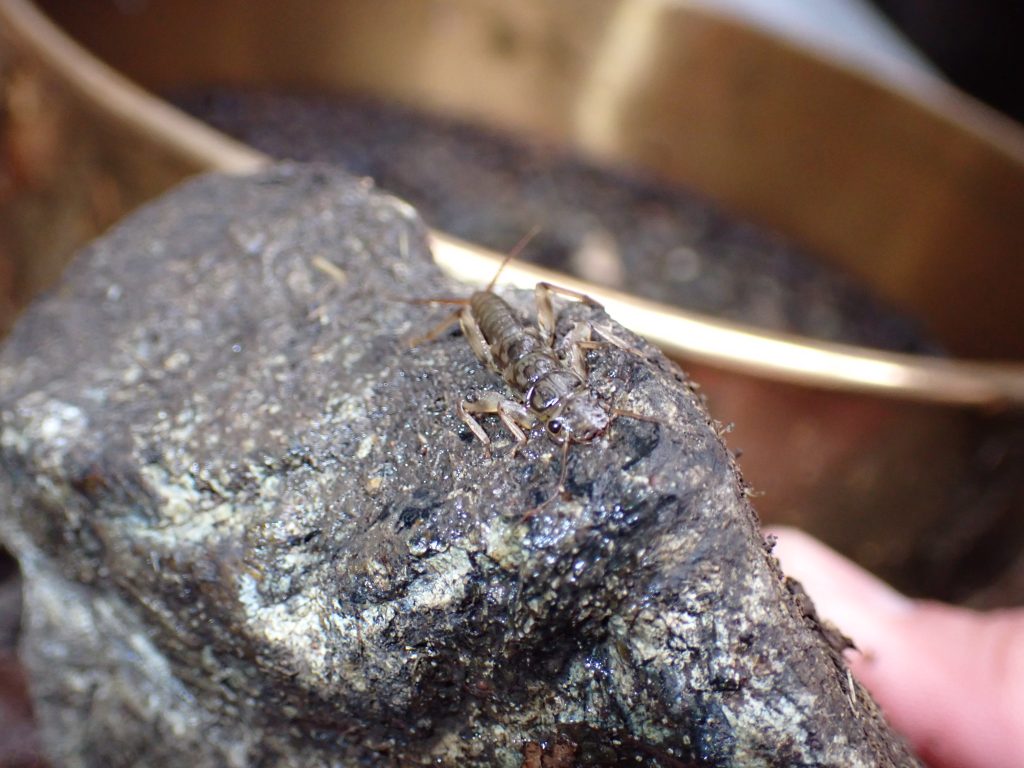
Three types of macroinvertebrates are strong indicators of a healthy stream: mayflies, stoneflies, and caddisflies. All three have a very low tolerance for water pollution, meaning their presence in a creek likely indicates good water quality that supports a healthy population of fish.
For more information on how we collect and analyze bioassessment data, check out this video!
How We Assess Conditions
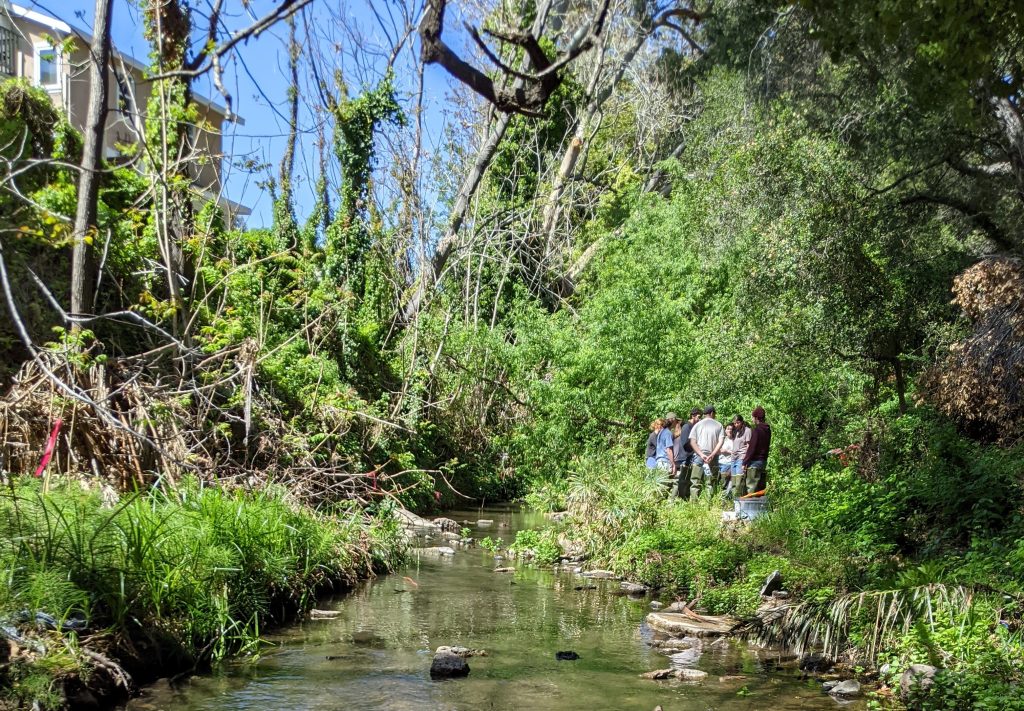
The Estuary Program collected bioassessment data from ten locations during April and May 2022. Macroinvertebrate samples were preserved and sent to a certified taxonomy lab for sorting and identification.
After the samples had been sorted and identified, the data was analyzed using an index scoring tool called the California Stream Condition Index (CSCI). An index score takes complex data and summarizes it in a way that is easier to understand. This score allows us to classify stream health and compare conditions between sites.
Results from Bioassessment
The scores compiled for 2022 show very good to fair conditions. The highest scores occurred at middle Pennington Creek (site code UPN), San Luisito Creek (LSL and USL), and upper Chorro Creek above the Chorro Reservoir (UCD). These sites have conditions that scored as Very Good and are likely healthy for fish and invertebrate species.
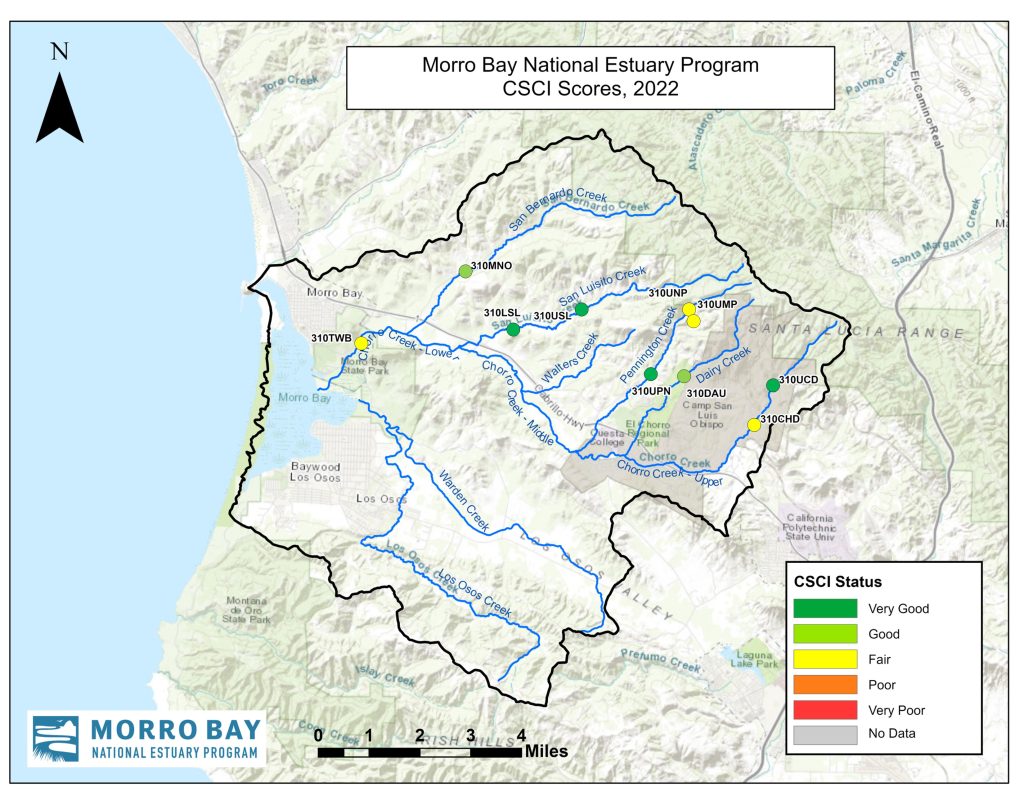
Although no sites scored in the Poor (orange) or Very Poor (red) categories, many of the historically poor preforming sites, like those along middle Chorro Creek, were not sampled in 2022 due to challenging field conditions. Furthermore, no sites were monitored within the Los Osos Creek subwatershed due to issues with site access. The Estuary Program hopes to gain field access for middle Chorro Creek and Los Osos Creek during 2023 in order to understand conditions watershed-wide.
In comparing 2022 scores to the historical average, we saw improvements on upper Dairy Creek (DAU), middle Pennington Creek (UPN), and upper and lower San Luisito Creek (USL, LSL). The other scores remained relatively stable as compared to the average.
How do Neighboring Watersheds Compare?
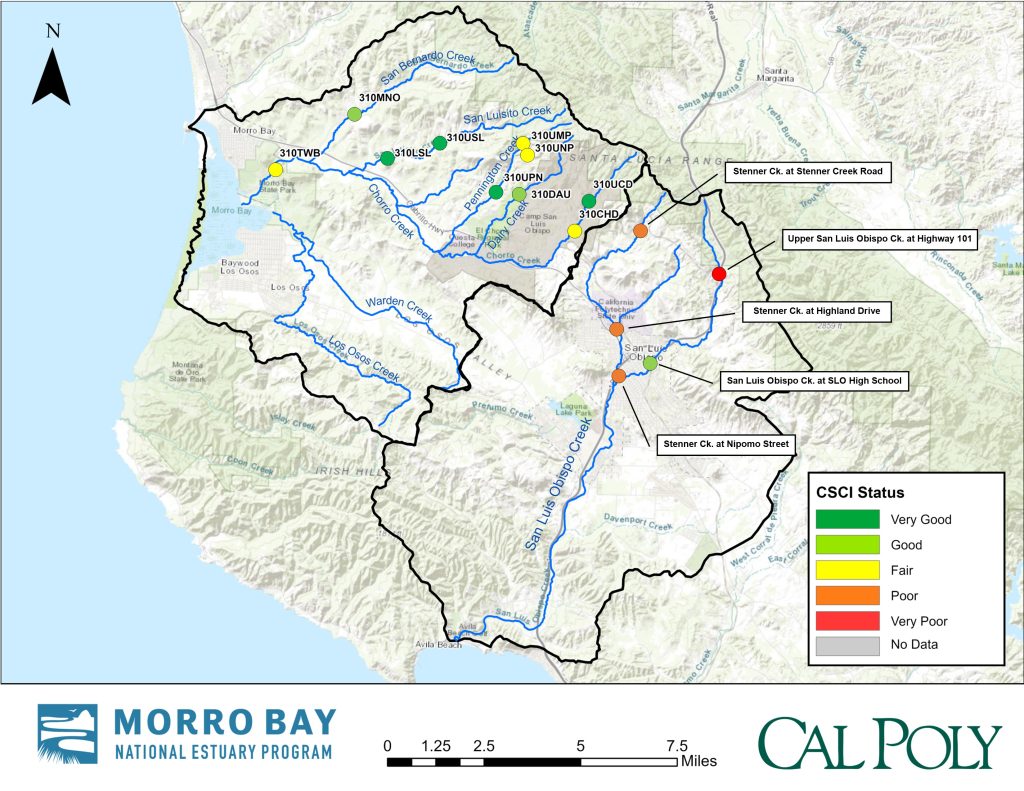
In 2022, the Estuary Program worked with the Harold J. Miossi Charitable Trust, the City of San Luis Obispo, and Cal Poly to develop a bioassessment monitoring effort for the San Luis Obispo (SLO) watershed. The team monitored five sites, including three sites on Stenner Creek and two sites on SLO Creek.
Results from the SLO effort reflect the vastly different land uses in the Morro Bay and SLO watersheds. While sites in the SLO watershed are more likely to be affected by heavy urbanization, sites in the Morro Bay watershed are more likely to be impacted by agriculture or wastewater treatment plant discharge. Sites in the upper SLO watershed also experience higher levels of impairment due to development, dams, and recreational areas.
Cal Poly and the City of San Luis Obispo will be conducting a second year of bioassessment monitoring in 2023 with support from the Estuary Program and funding from the Harold J. Miossi Charitable Trust. The SLO effort will be expanded to include an additional site in 2023.
Thank you, Harold J. Miossi Charitable Trust!
This important and long-running dataset would not be possible without the generous contributions of the Harold J. Miossi Charitable Trust. The Trust has contributed over $100,000 to this effort since 2013 and has pledged to continue their support in 2023 and 2024. We are excited to continue this work with the Trust to collect this important data.
Help us protect and restore the Morro Bay estuary!
- Donate to the Estuary Program today and support our work in the field, the lab, and beyond. The Estuary Program is a 501(c)3 nonprofit. We depend on funding from grants and generous donors to continue our work.
- Support us by purchasing estuary-themed gear from ESTERO. This locally owned and operated company donates 20% of proceeds from its Estuary clothing line and 100% of Estuary decal proceeds to the Estuary Program. Thank you, ESTERO!
- Purchase items from the Estuary Program’s store on Zazzle. Zazzle prints and ships your items, and the Estuary Program receives 10% of the proceeds.
Thank you for helping our beautiful, bountiful, biodiverse bay!