Creek water quality monitoring
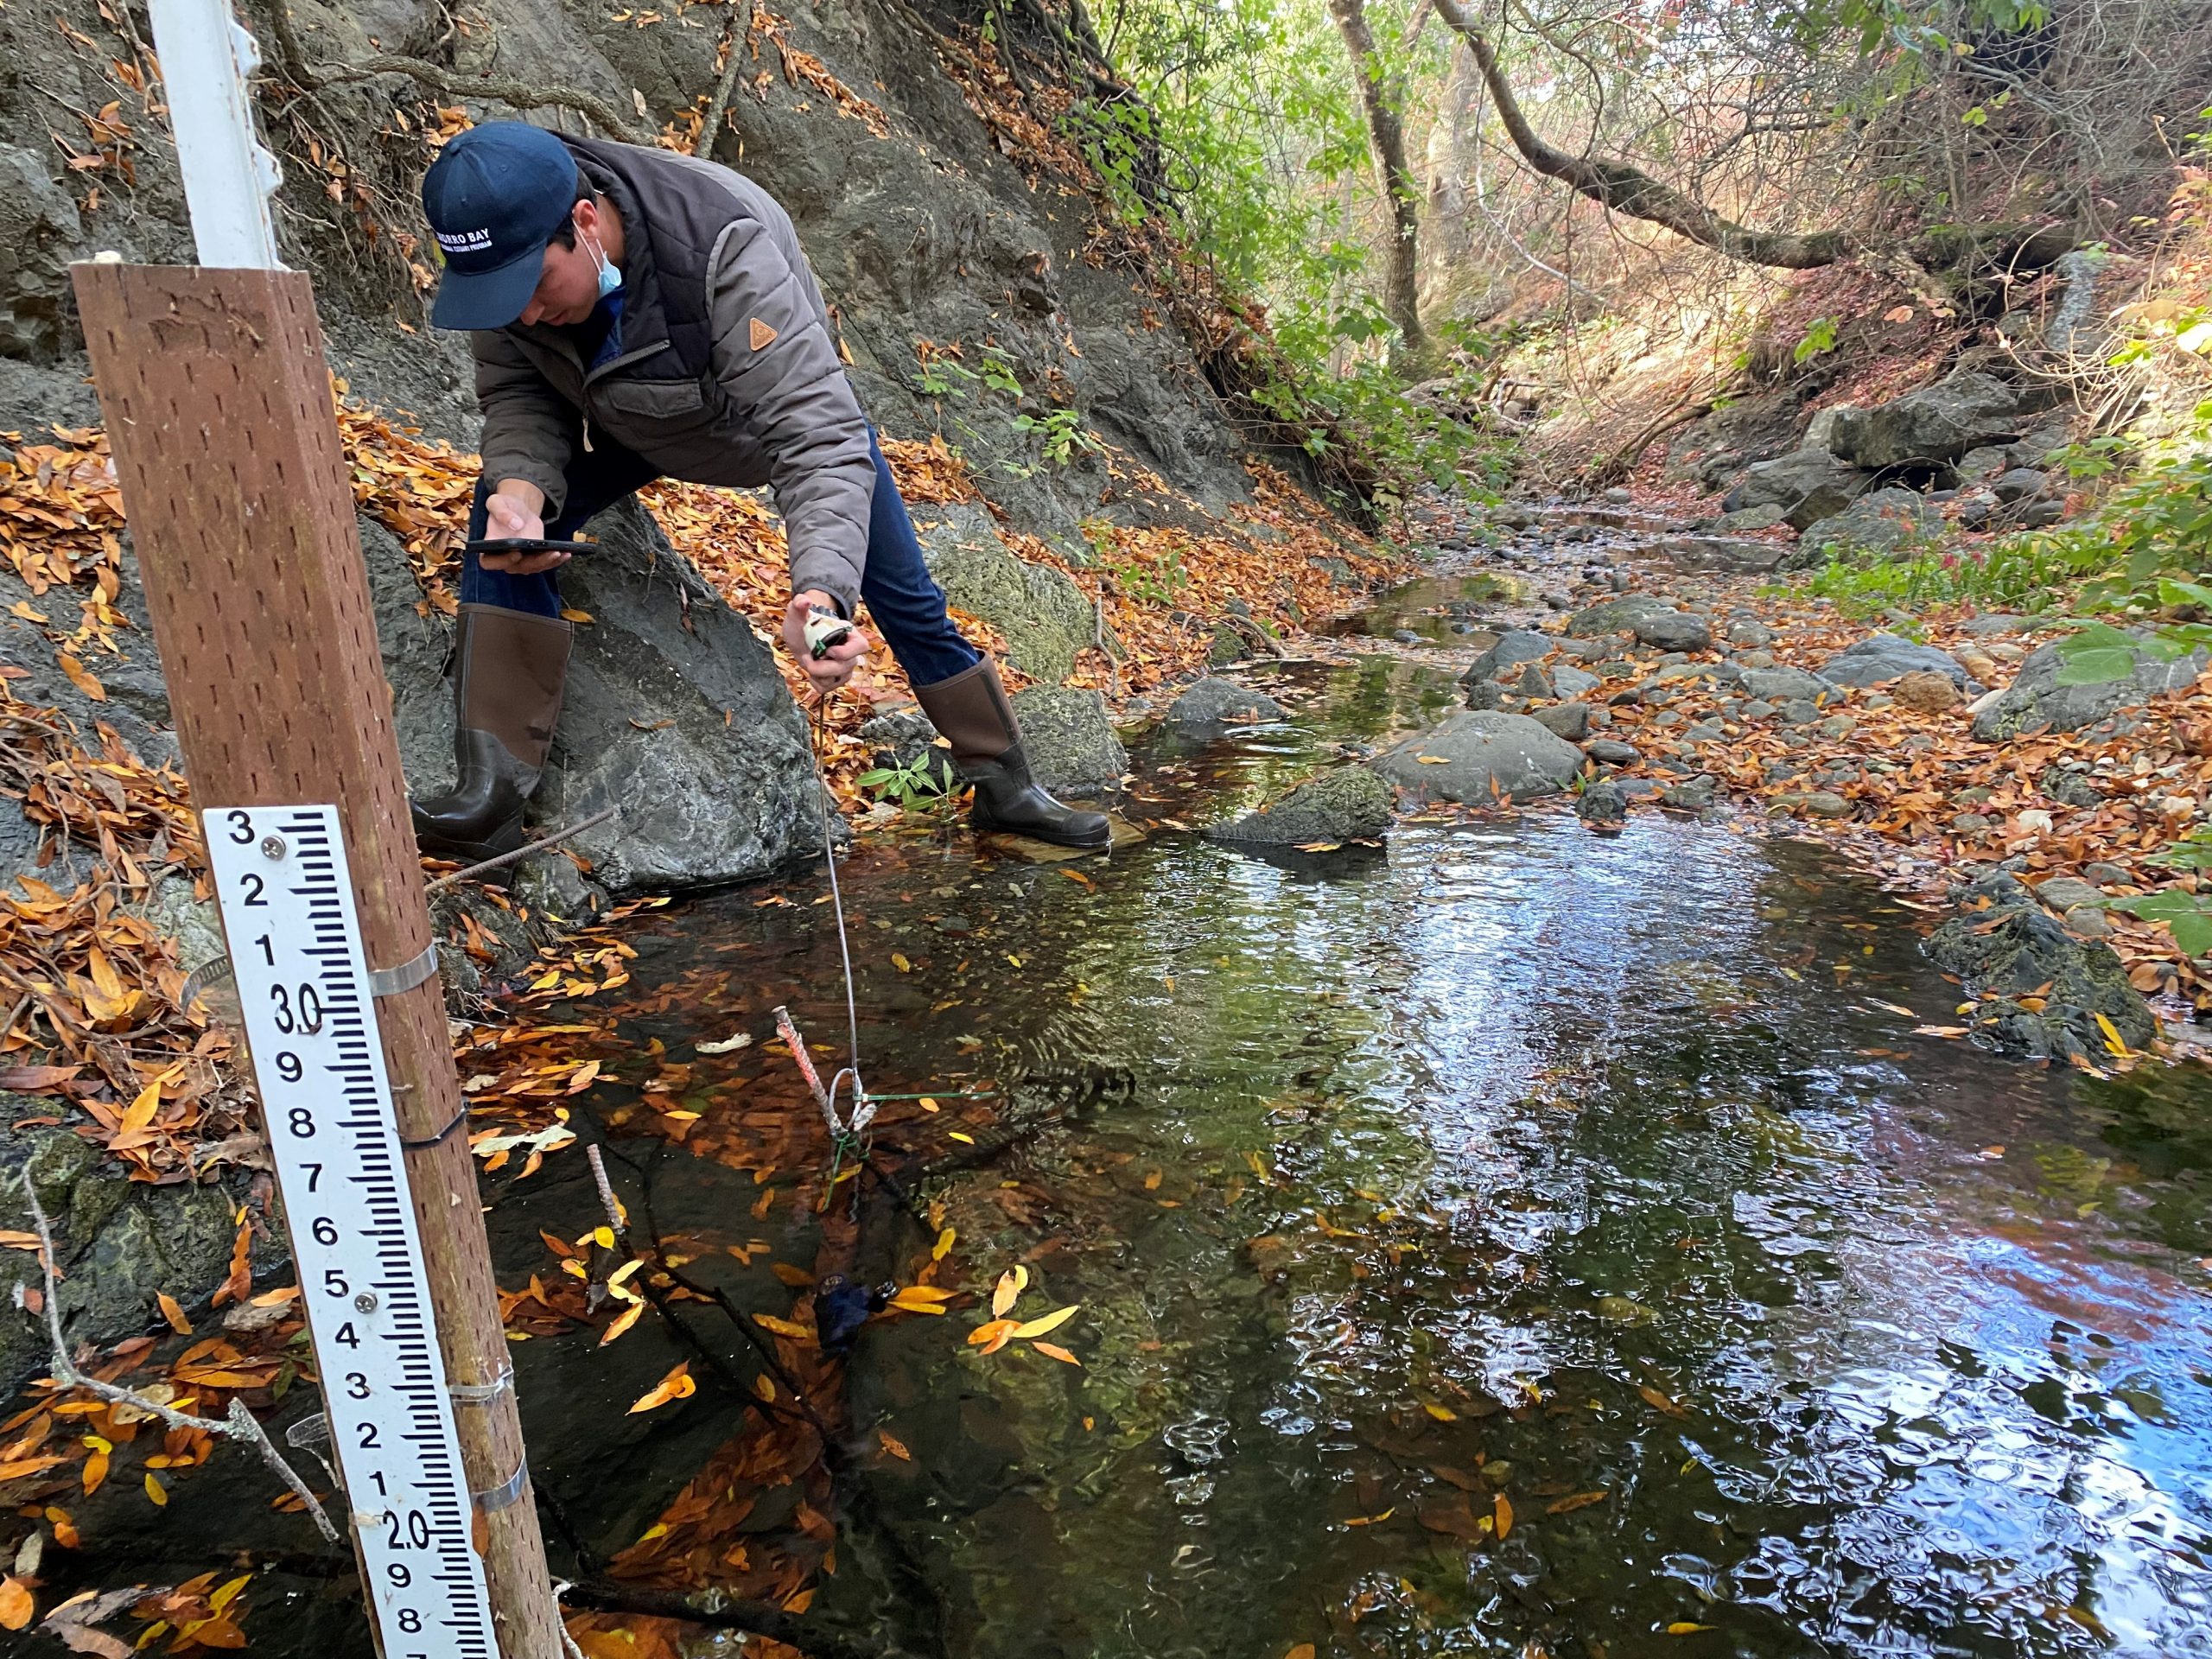
One of the primary ways that the Estuary Program tracks creek health data is by conducting routine water quality monitoring. Staff and volunteers visit sites throughout the Morro Bay watershed each month and collect a variety of data points from each site. These water quality parameters include temperature, dissolved oxygen, conductivity, turbidity and flow velocity.
This type of sampling is known as “grab sampling” because the data provides information only the moment in time when you collected the sample or took a meter reading. While grab sampling can help illustrate ambient conditions at each site, this approach can leave gaps in our datasets, especially outside of our normal staff working hours.
To better understand what conditions look like outside of monthly monitoring site visits, the Estuary Program uses continuous monitoring equipment. These water quality data collection devices remain stationed in the creek and collect data on either fifteen-minute or thirty-minute intervals.
Types of continuous monitoring
The Estuary Program currently has three types of continuous monitoring equipment. The first are our temperature data loggers, also called TIDBITs. These tiny but mighty devices log water temperature every thirty minutes, all year-round. You can check out this blog post for more information about these temperature loggers.
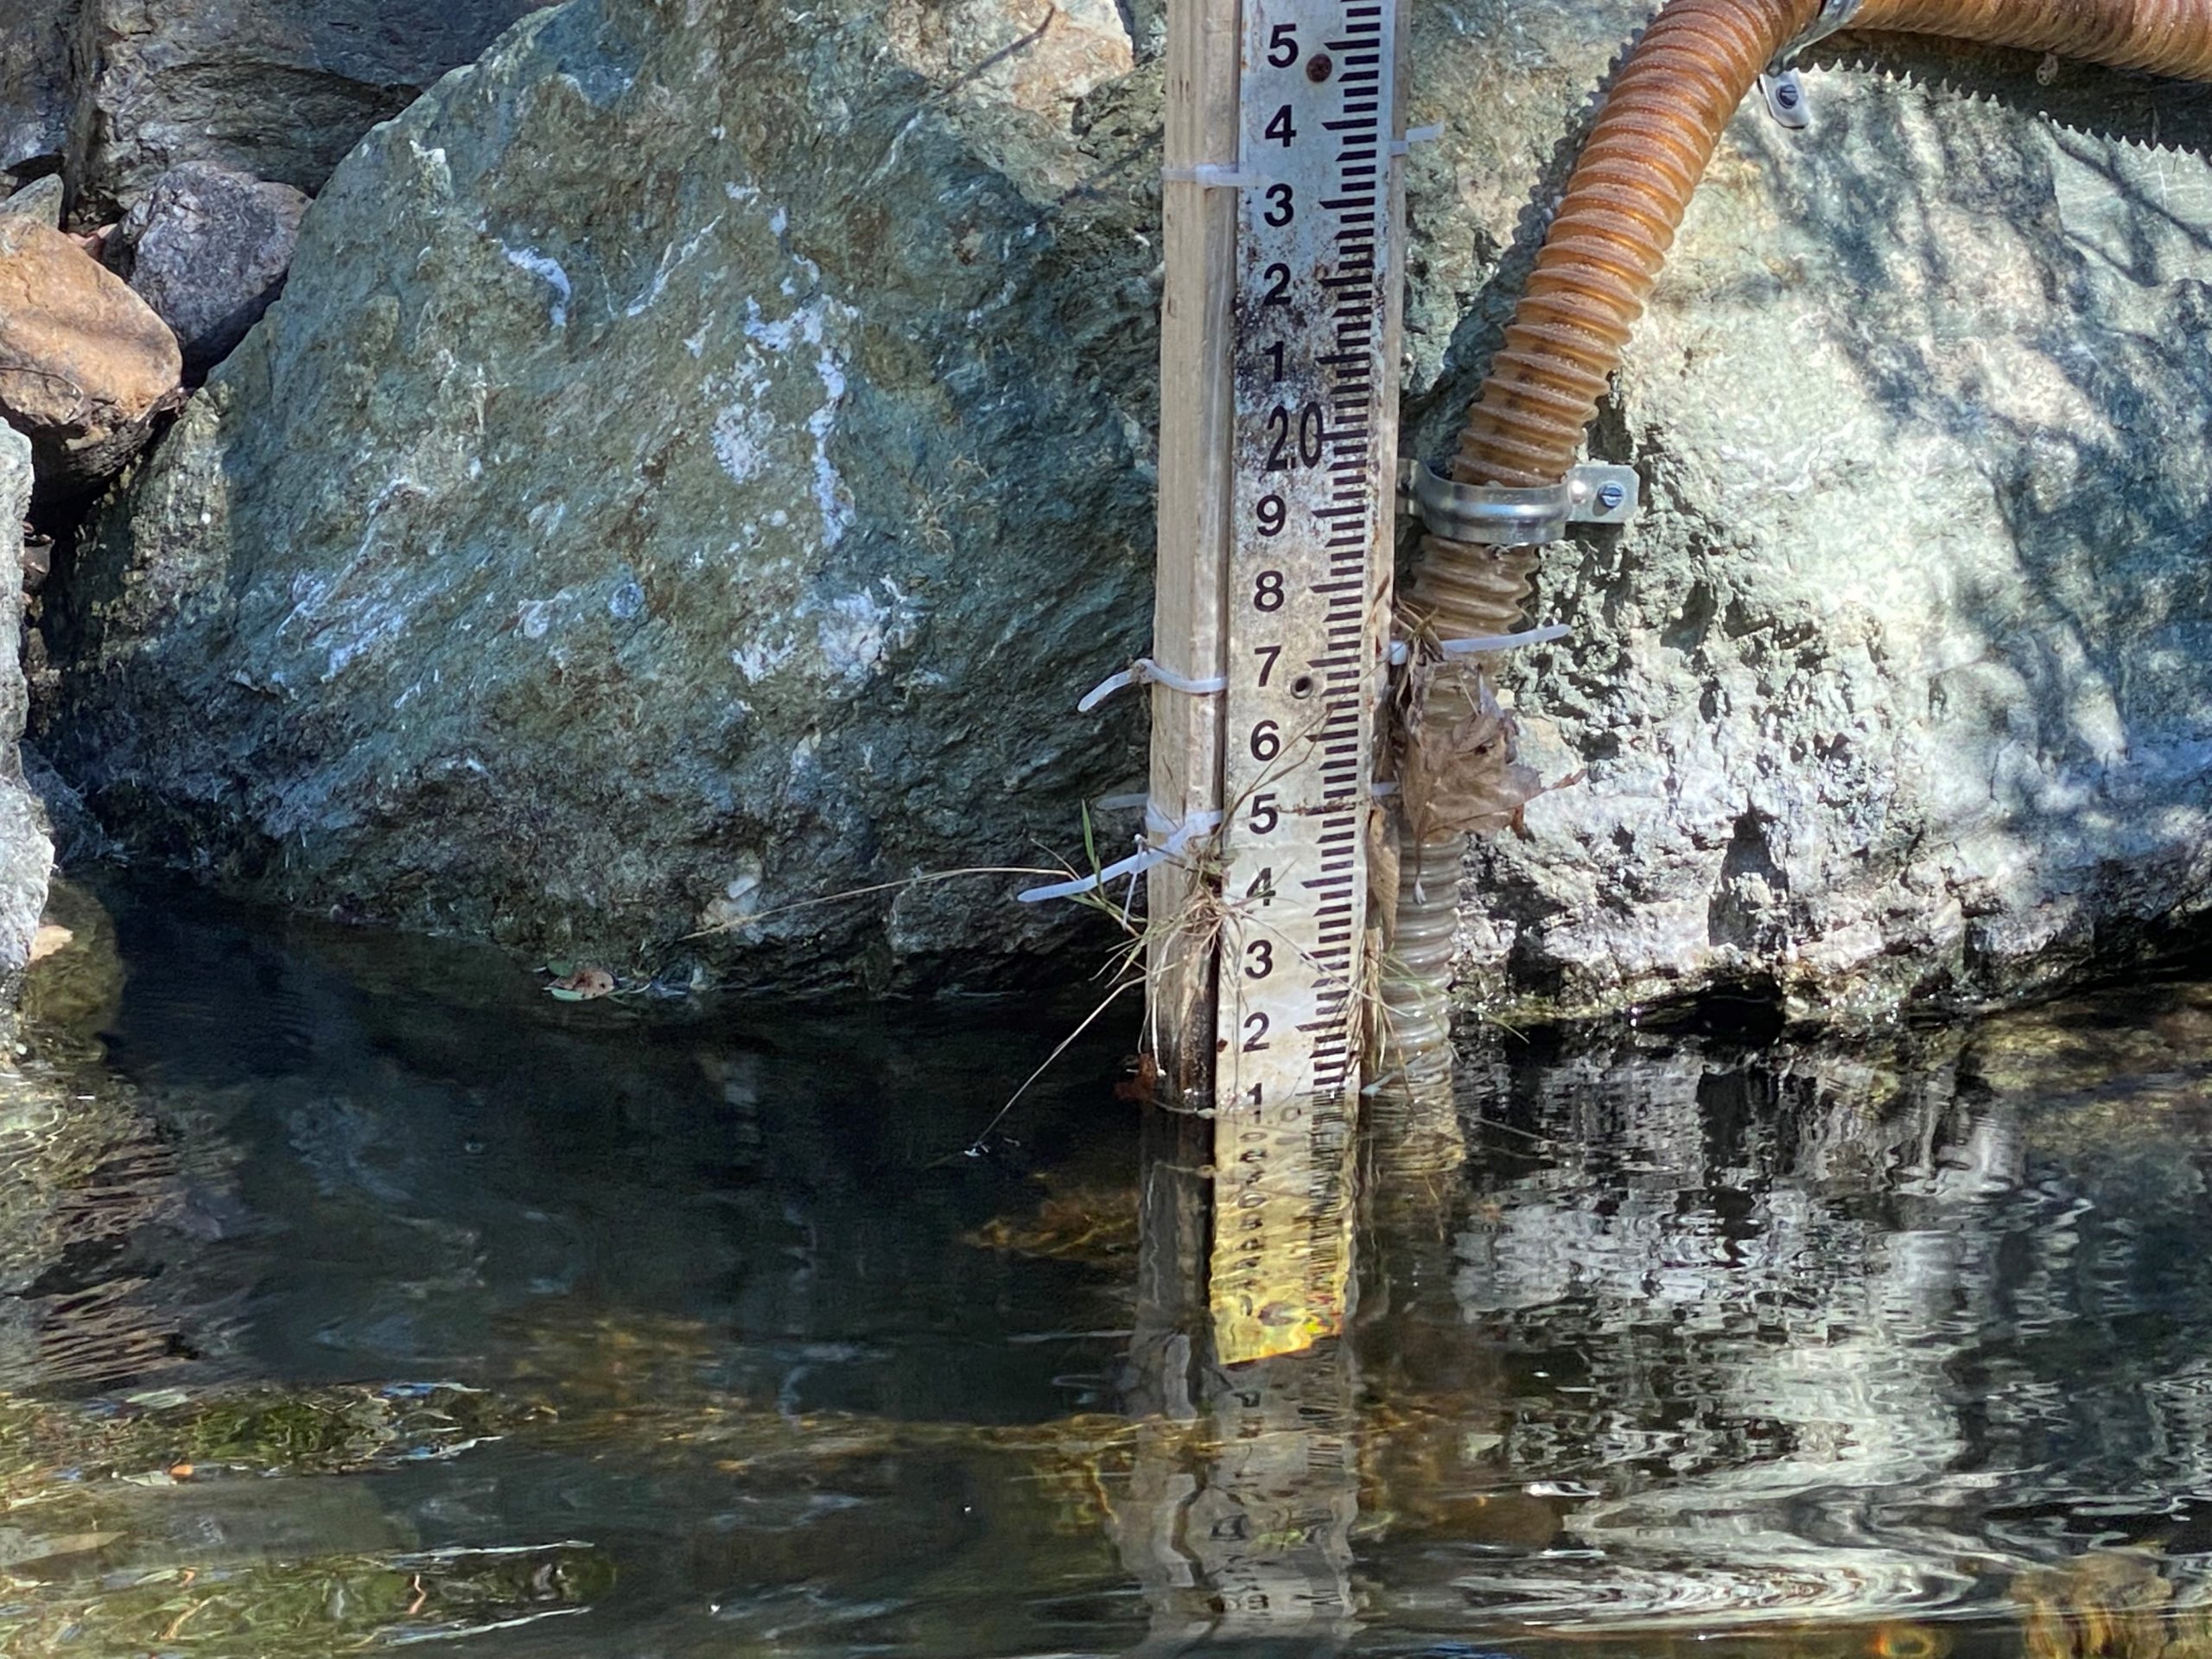
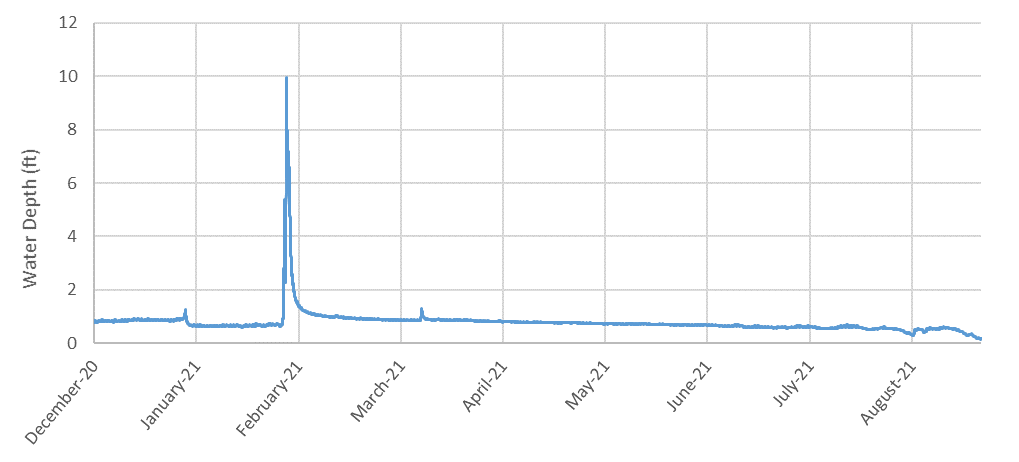
The second and longest running of our continuous datasets comes from our pressure transducers. These devices are stationed in creeks to measure changes in water depth. When we track the water depth over time, we can begin to identify how rainfall, lack of rainfall, and air temperature might affect creek depth.
Using the hydrograph from Chorro Creek below, can you find which month we received the most rainfall?
New monitoring equipment
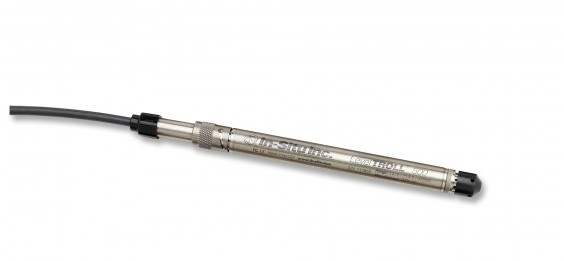
The last and most recent addition to the continuous data logger ensemble is our water quality sonde. Unlike our temperature loggers, which collect only one type of data, the sonde can collect five different types of data in a single measurement!
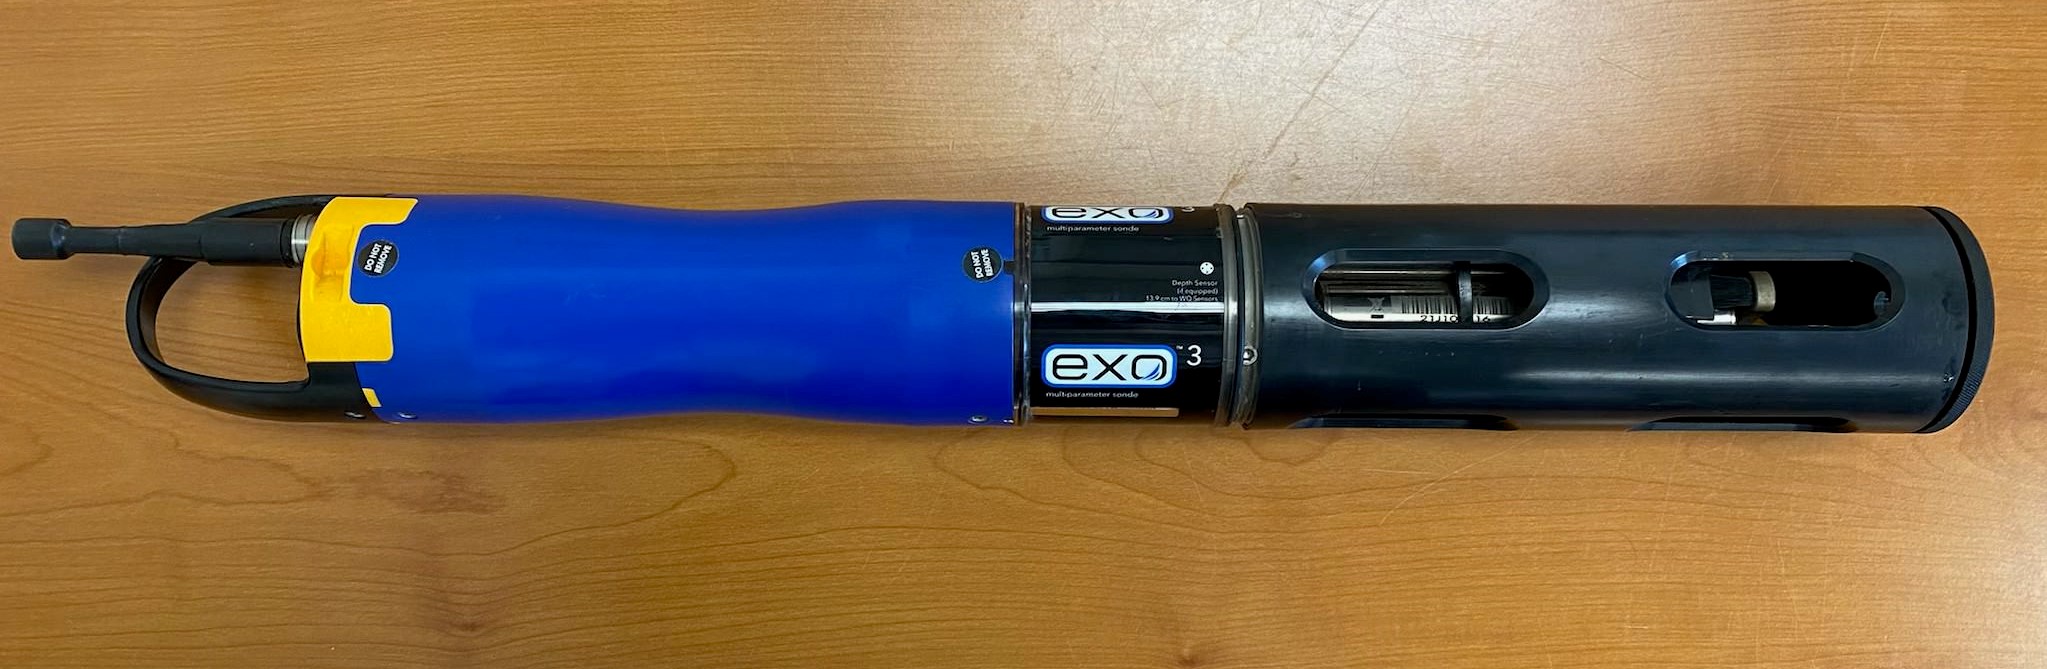
The new sonde’s sensors can collect five types of data every 15 minutes: temperature, conductivity (or salinity), dissolved oxygen, pH, and water depth.
Why is continuous data so valuable?
Sondes and other pieces of continuous logging equipment provide valuable water quality information and can identify exactly when and for how long conditions might persist.
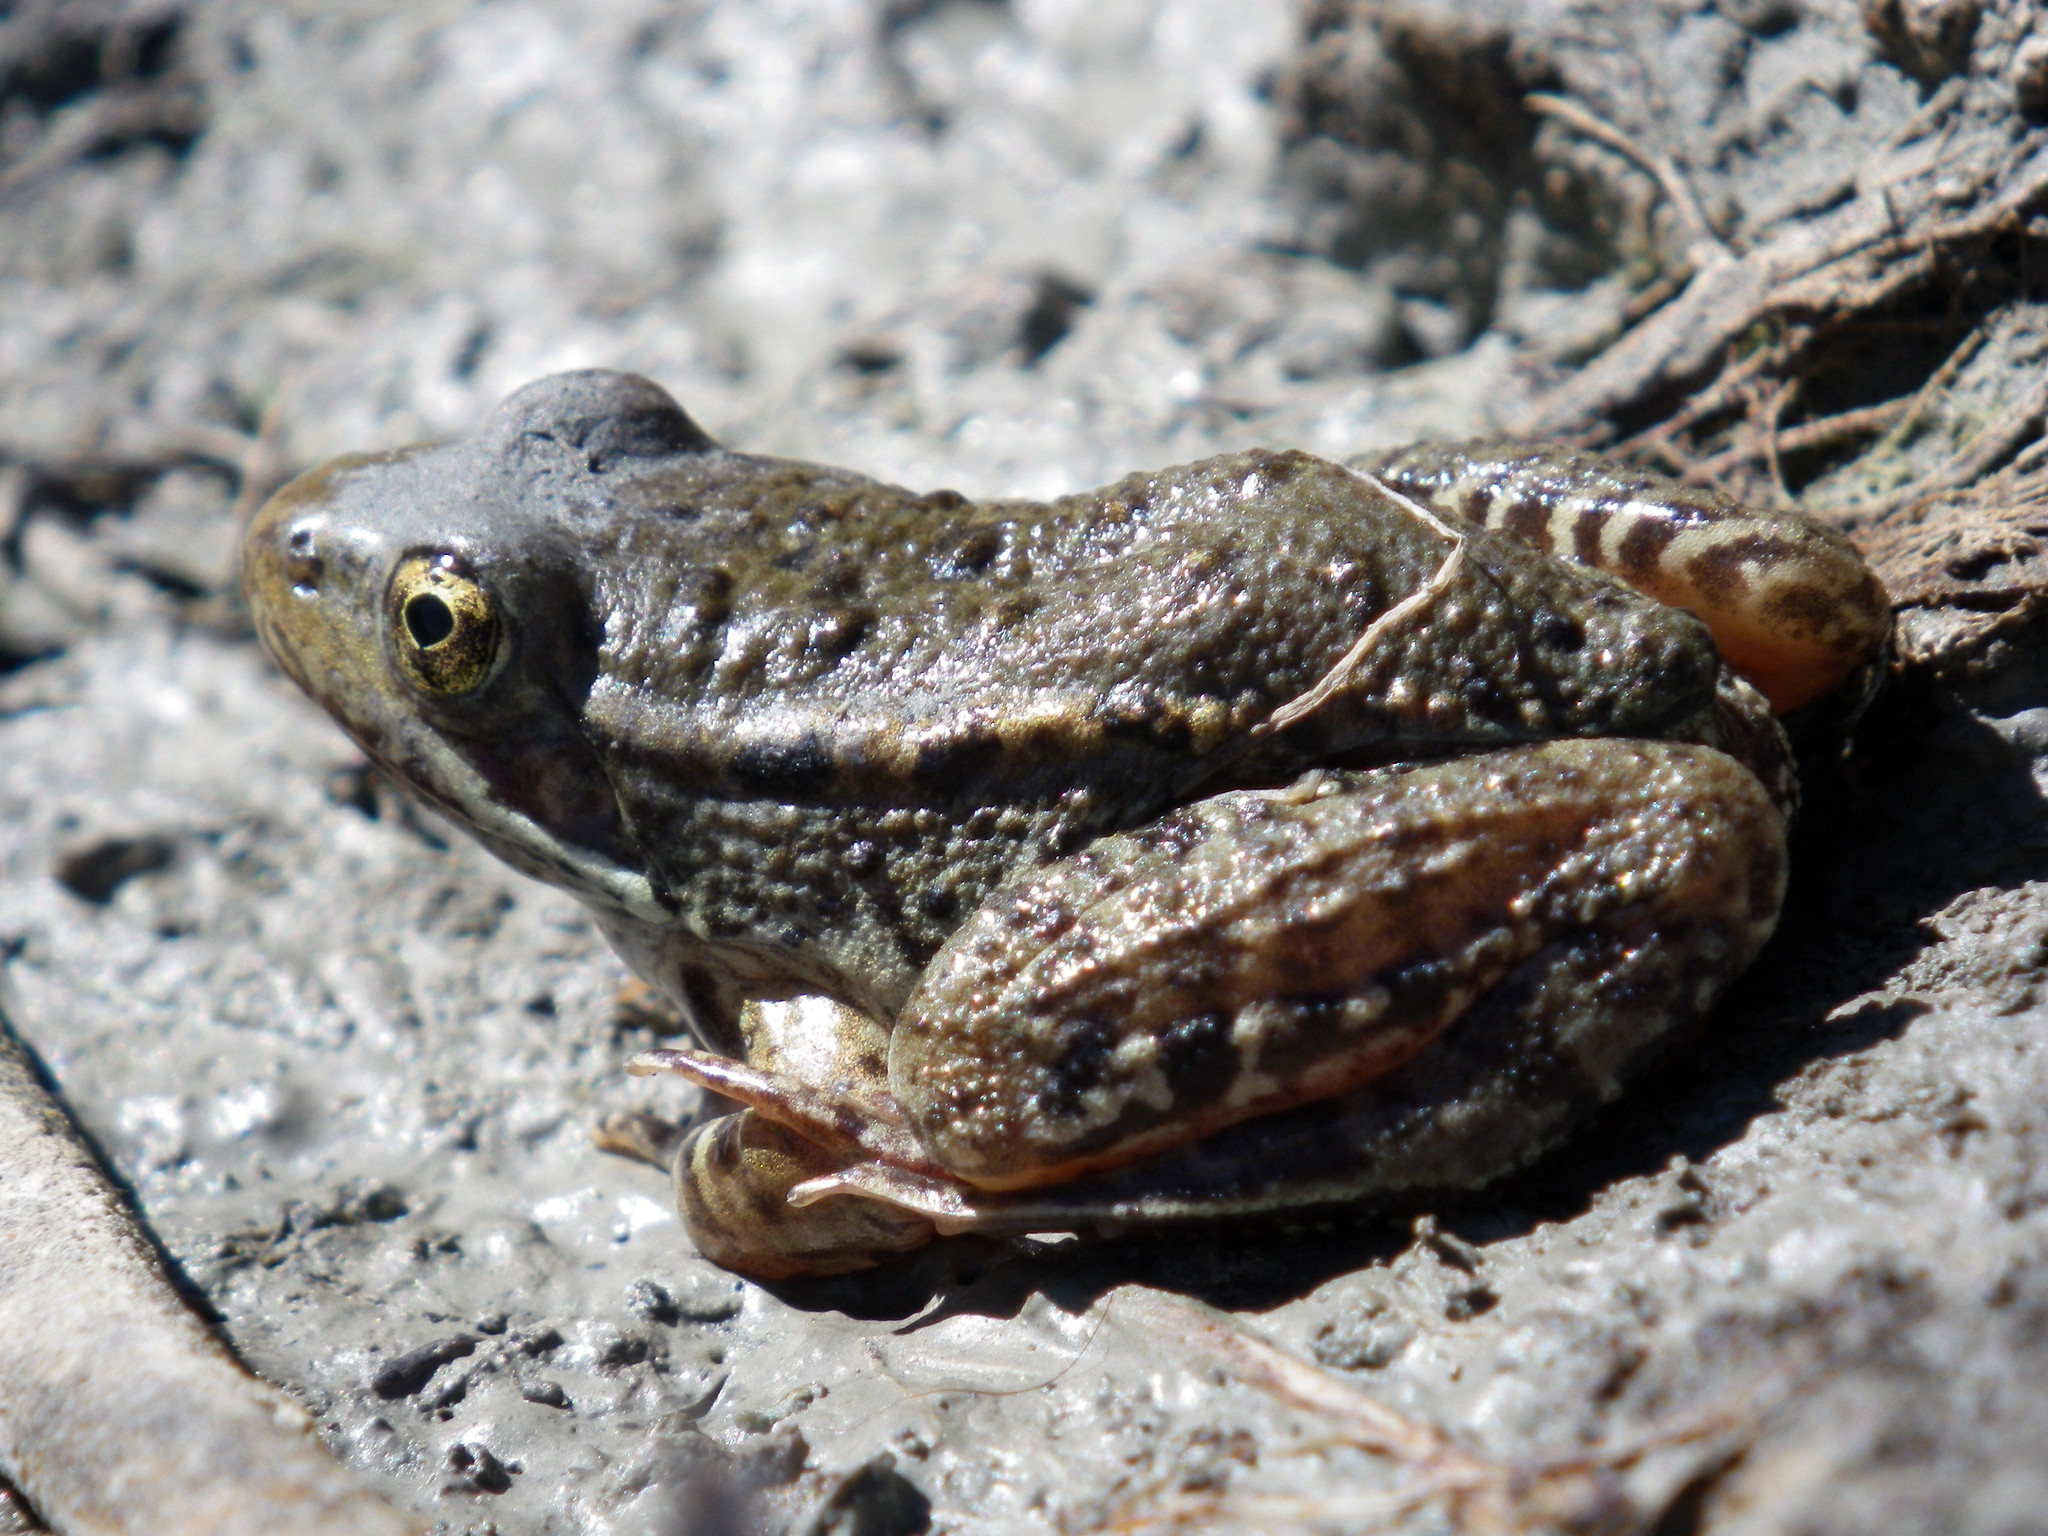
For example, if the dissolved oxygen levels are abnormally low for a long period of time, these conditions are likely to have an adverse effect on aquatic species, like rainbow and steelhead trout (both fish are the same species, Oncorhynchus mykiss, with different lifestyles) and California red-legged frogs (Rana draytonii).
Because the sonde measures multiple water quality parameters during the same logging cycle, we can also start to see trends in the data and better understand the relationship between indicators like temperature and dissolved oxygen, or conductivity and dissolved oxygen.
Data quality is key
Any data we collect must be accurate in order to be useful. While each of the loggers has slightly different quality assurance measures, one of the more interesting methods is built into our new water quality sonde.
One of the most common issues with submerged equipment is the potential for biofouling, which is the accumulation of algae, microorganisms, or plants on the surface of the sensors. This buildup can interfere with the sensors’ ability to collect accurate data.
To prevent biofouling, the water quality sonde has an internal wiper brush that prevents any fouling organisms from accumulating on the sensors and affecting readings. This small wiper operates in a circular-fashion, automatically cleaning the surface of all of the sensors as it runs.
Check out the video below to see how the anti-fouling wiper works!
What we do with the data we collect
The water quality monitoring data we collect by hand and from continuous monitoring equipment serves multiple purposes. We share it with partners at other organizations and agencies, including local oyster farms, and the California Water Board. We use it to inform our restoration project plans and gauge the effectiveness of past projects. It also forms the foundation of our many memos and reports that assess the health of the Morro Bay estuary and watershed. To see this data in action, check out our most recent State of the Bay report from 2020, and stay tuned for State of the Bay 2023 early next year. Additional technical memos and data reports can be found in our online library.
Subscribe to our weekly blog to have posts like this delivered to your inbox each week.
Help us protect and restore the Morro Bay estuary!
- Donate to the Estuary Program today and support our work in the field, the lab, and beyond.
The Estuary Program is a 501(c)3 nonprofit. We depend on funding from grants and generous donors to continue our work. - Support us by purchasing estuary-themed gear from ESTERO. This locally owned and operated company donates 20% of proceeds from its Estuary clothing line and 100% of Estuary decal proceeds to the Estuary Program. Thank you, ESTERO!
- Purchase items from the the Estuary Program’s store on Zazzle. Zazzle prints and ships your items, and the Estuary Program receives 10% of the proceeds. Choose from mugs, hats, t-shirts, and even fanny packs (they’re back!) with our fun Estuary Octopus design, our classic Estuary Program logo, or our Mutts for the Bay logo.
Thank you for helping our beautiful, bountiful, biodiverse bay!