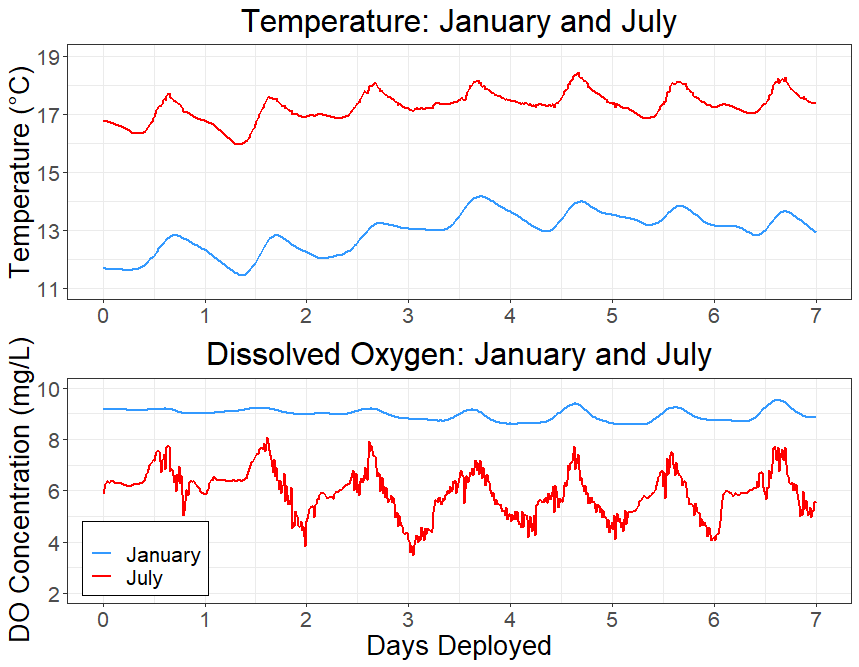
These graphs depict temperature and dissolved oxygen concentration over a week-long deployment at the same site at different times of year. In the summer (shown in red), water temperatures rise and dissolved oxygen concentrations fall and become much more variable.