Summer is one of the most critical times for aquatic species due to higher temperatures, lower dissolved oxygen, and limited habitat. For species like rainbow trout and steelhead (Oncorhynchus mykiss), the defining factor in their survival is stream flow, or how much water is present and moving in the creek.
The Estuary Program recently launched an expanded monitoring effort to better understand spring and summer low flow conditions in the watershed. During this seasonal effort, volunteers and staff visit nine sites every other week to measure flows. We analyze the data to determine if there is adequate water for steelhead.
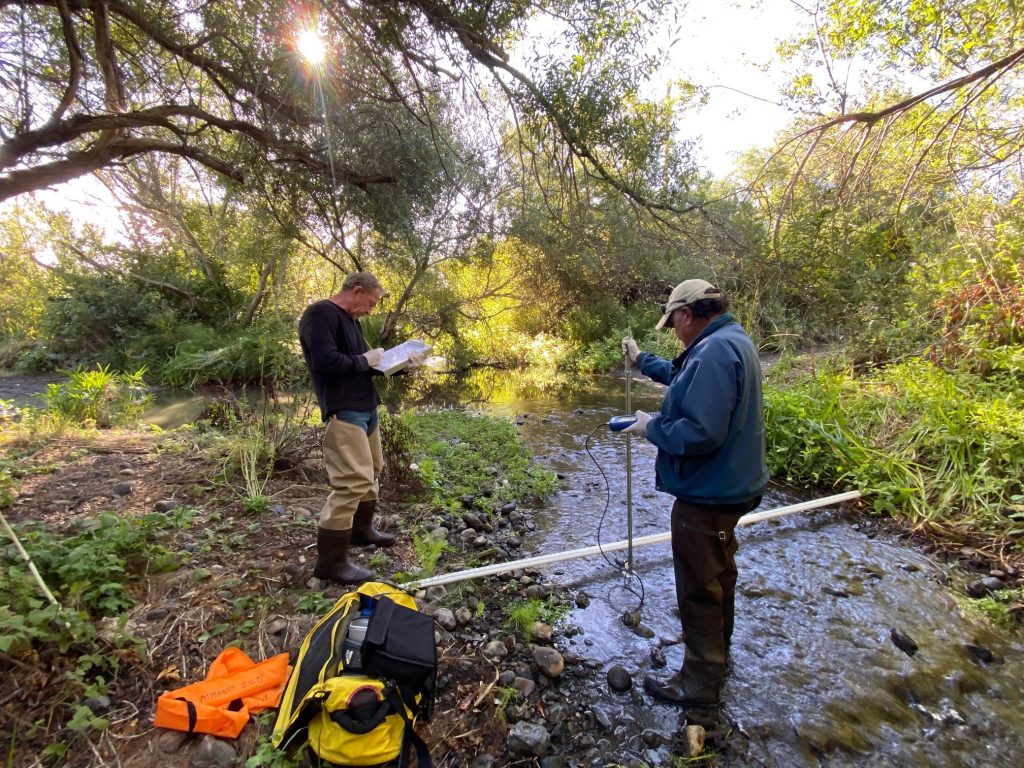
Measuring stream flow
Our staff and trained volunteers use specialized equipment to collect stream flow data during monthly water quality visits and during low flow monitoring. We typically measure how much water is in our creeks using a method called the “velocity-area method.” This technique uses the water width, depth, and velocity to estimate the stream flow rate in cubic feet per second.
Getting creative during low flows
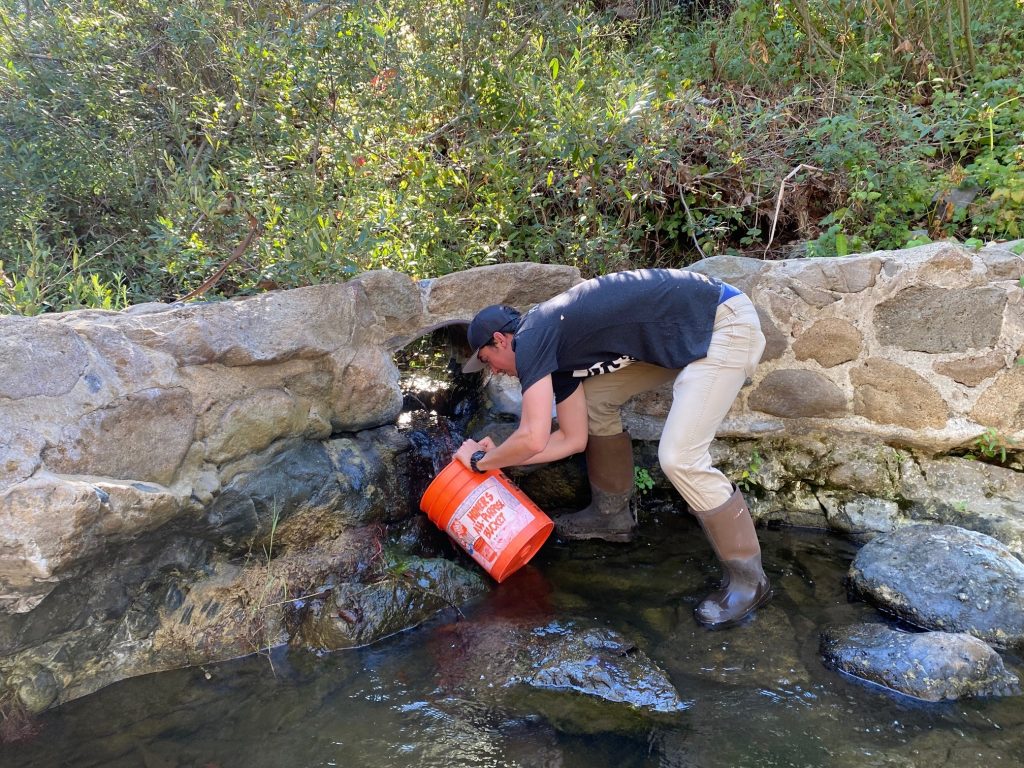
Measuring stream flow during the driest time of the year can be challenging. Many of the smaller creeks in the watershed are reduced to a trickle, while others may go dry completely. These conditions present a challenge when trying to accurately measure flows. Even if staff and volunteers aren’t able to measure flow, photos and detailed notes are important to understanding when and where creeks may go dry.

Some sites have infrastructure that necessitates a change in the way we measure flow. Culverts are generally pipes that allow flows to pass under a bridge or road crossing. At sites with culverts, Estuary Program staff may use an alternate method to measure stream flow. This method involves timing how long it takes to fill a five-gallon bucket with creek water and then converting the measurement from gallons per second to cubic feet per second. This low-tech method is perfect for sites with low flows where water is concentrated in an area less than the width of the bucket.
Continuous flow data
The Estuary Program also measures stream flow with the aid of stationary monitoring equipment. We install the equipment in creek beds to collect water depth using a water pressure sensor. The result is a continuous stream flow dataset with measurements collected every 15-minutes throughout the year.
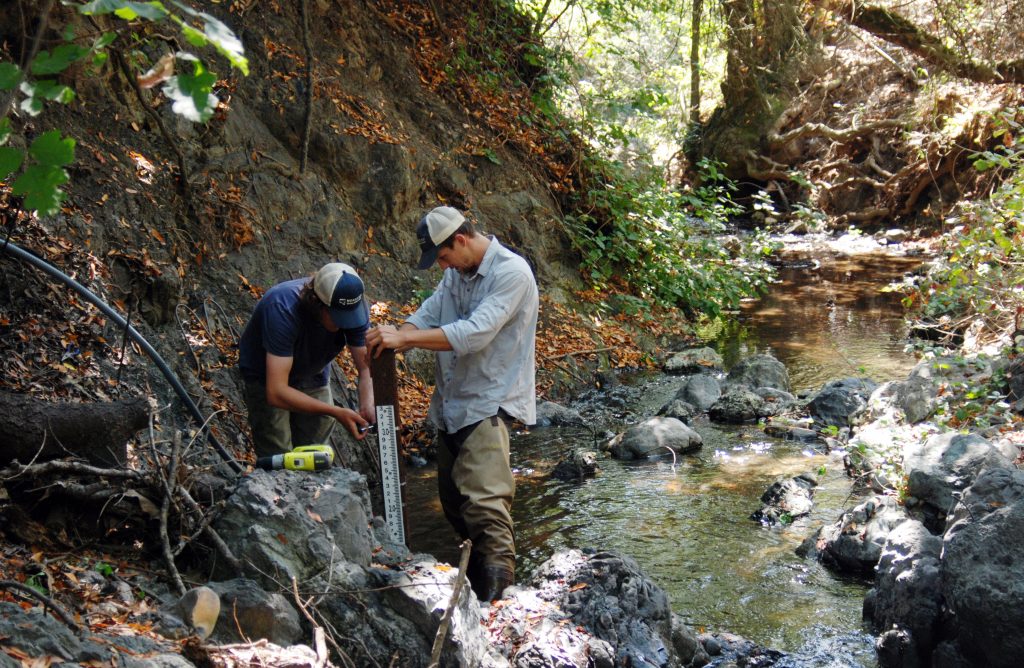
Continuous stream flow data is very valuable to the Estuary Program and its partners as it allows us to track flows throughout the year and identify how conditions like rainfall or persistent drought might affect stream flow.
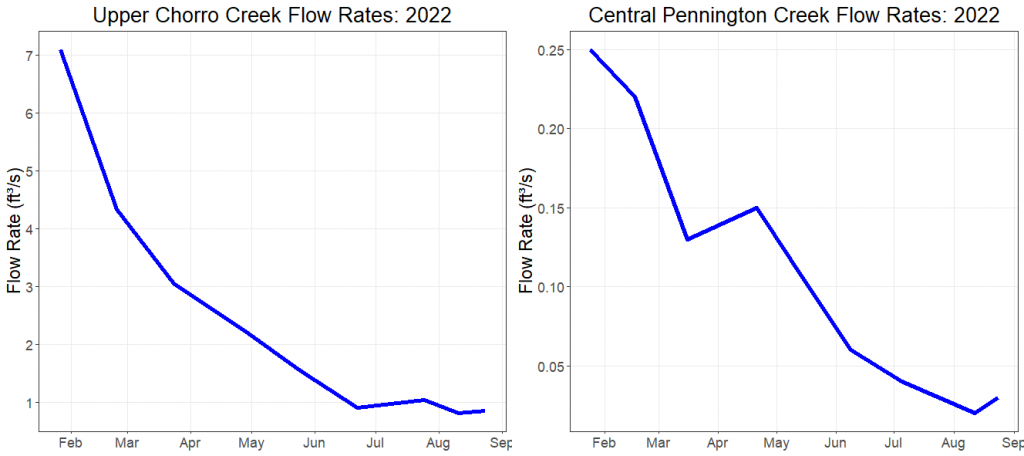
Looking at the data
Stream flow rates are expected to drop during the summer months when there is less rain and warmer temperatures. Regardless of their size, most creeks experience a similar degree of flow reduction during the summer. In reviewing flow data from two sites with very different levels of flow, we found a nearly 90% drop in flow rates at both sites since January.
Help us protect and restore the Morro Bay estuary!
- Donate to the Estuary Program today and support our work in the field, the lab, and beyond. The Estuary Program is a 501(c)3 nonprofit. We depend on funding from grants and generous donors to continue our work.
- Support us by purchasing estuary-themed gear from ESTERO. This locally owned and operated company donates 20% of proceeds from its Estuary clothing line and 100% of Estuary decal proceeds to the Estuary Program. Thank you, ESTERO!
- Purchase items from the the Estuary Program’s store on Zazzle. Zazzle prints and ships your items, and the Estuary Program receives 10% of the proceeds.
Thank you for helping our beautiful, bountiful, biodiverse bay!