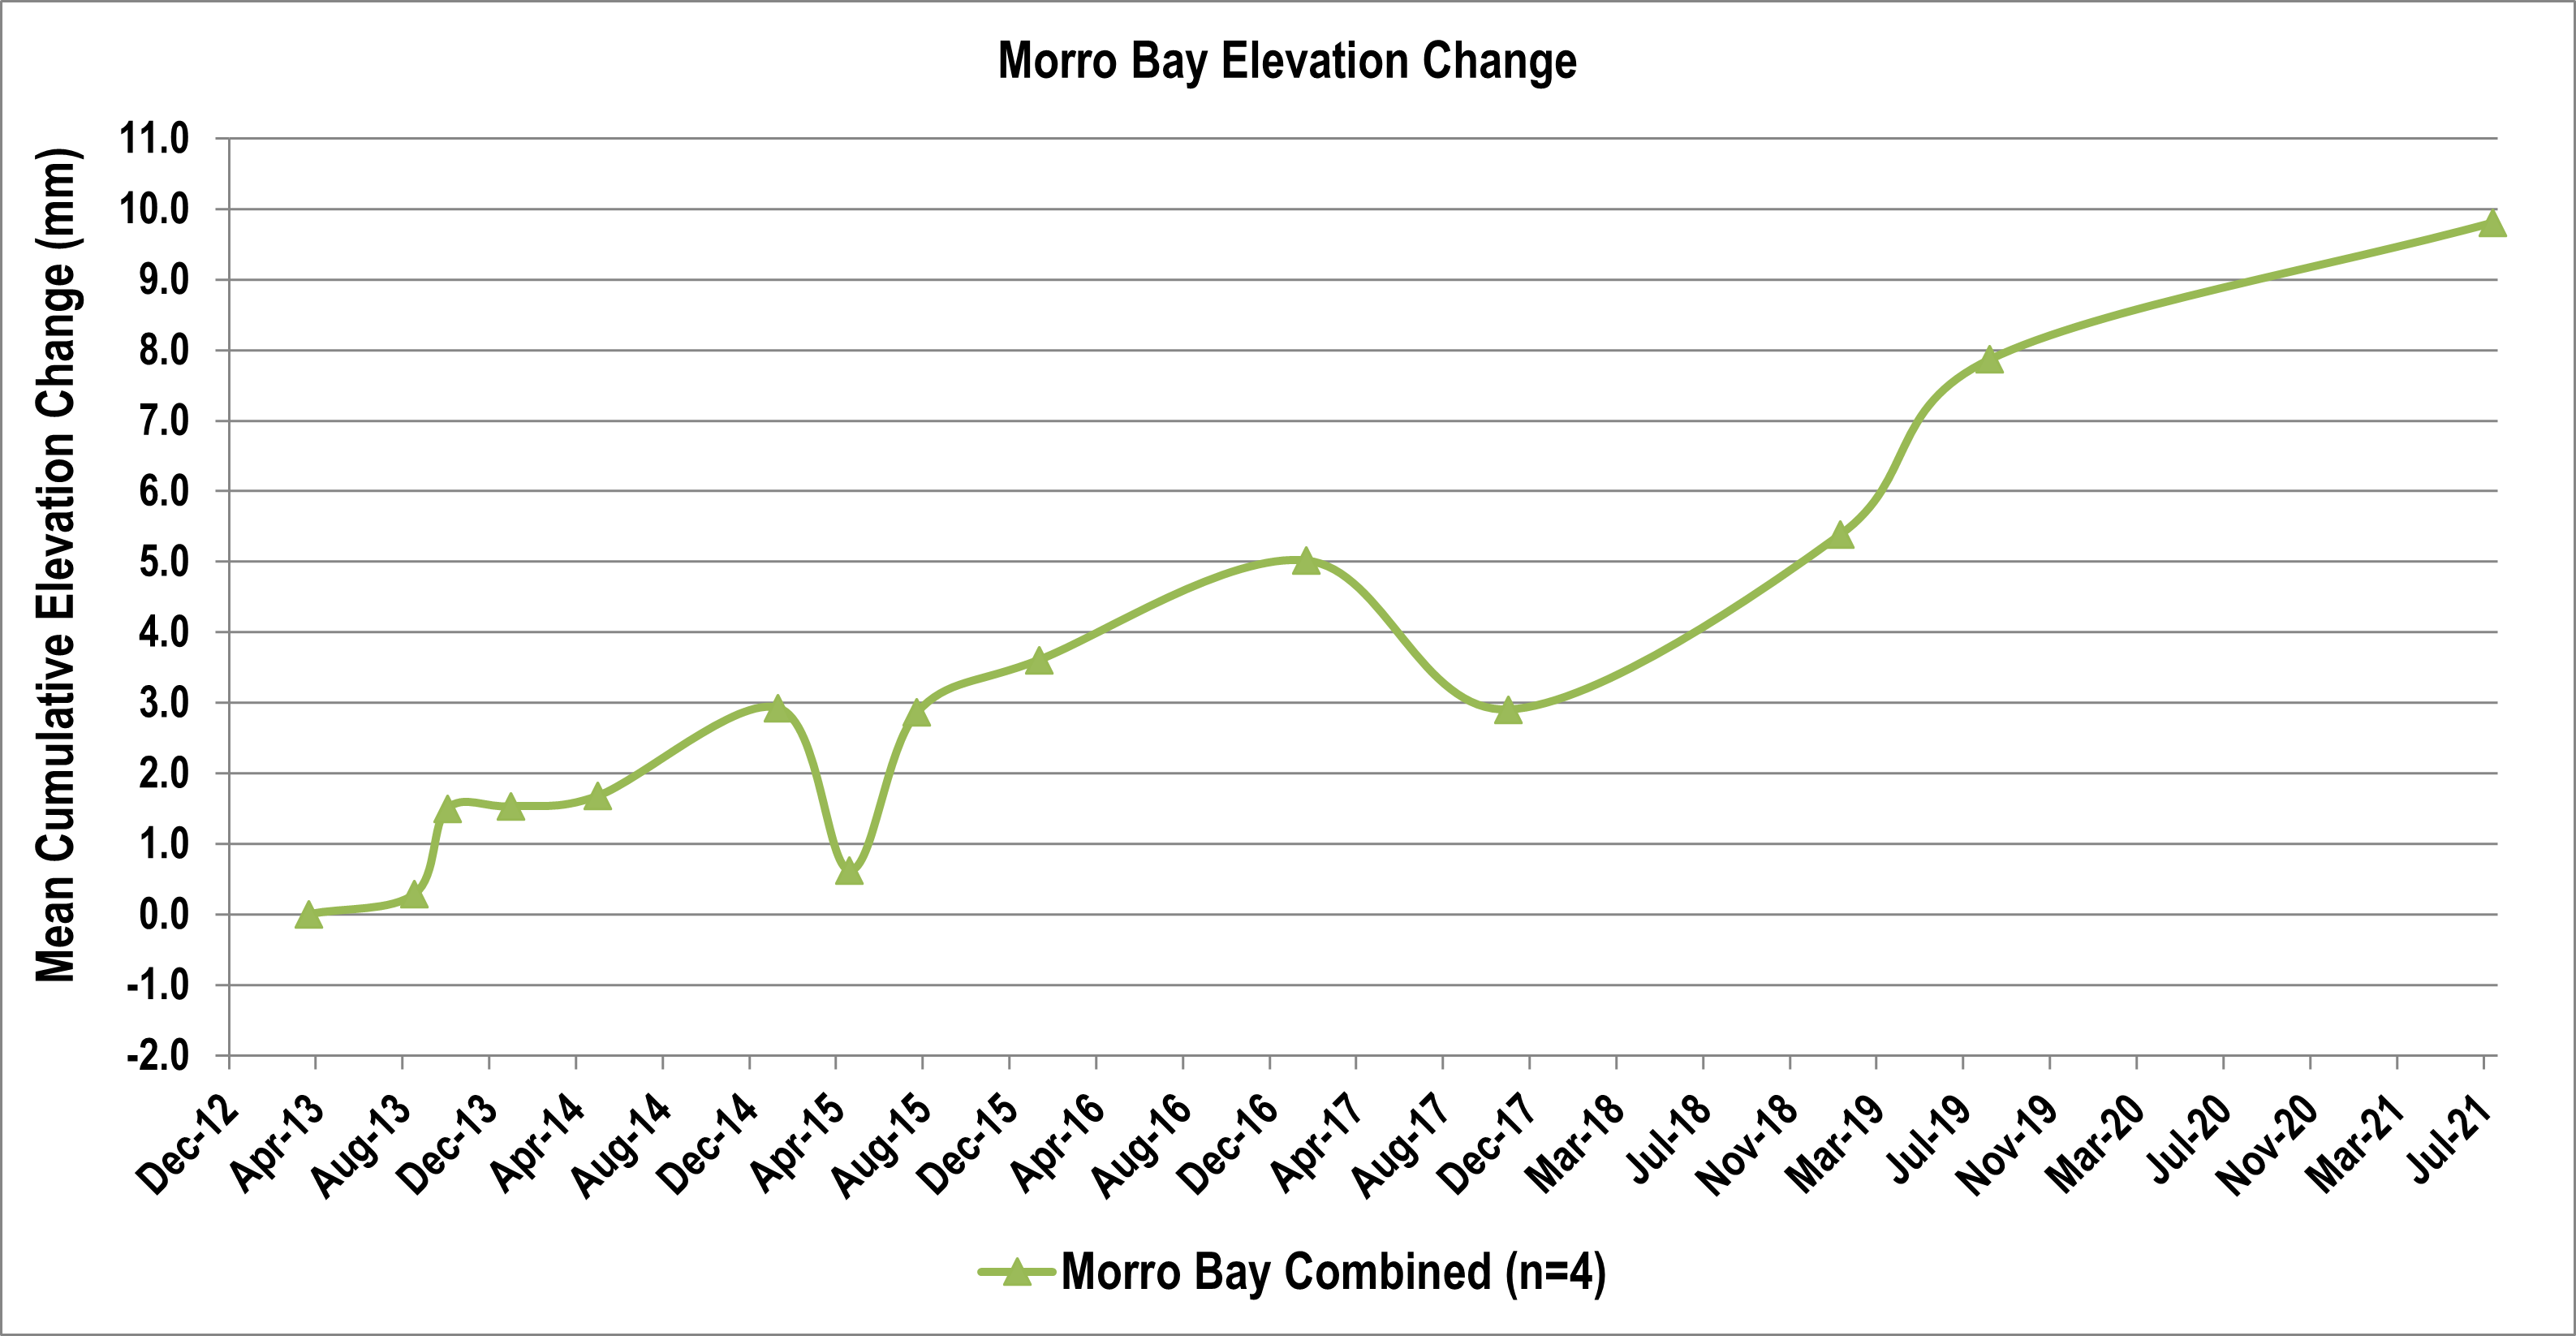
The graph shows average cumulative elevation change of the Morro Bay salt marsh, using data averaged from four monitoring sites. Graph is courtesy of USGS. Data is unpublished and subjected to revision.
Enter your email address to subscribe to this blog and receive notifications of new posts by email.
Email Address
Subscribe