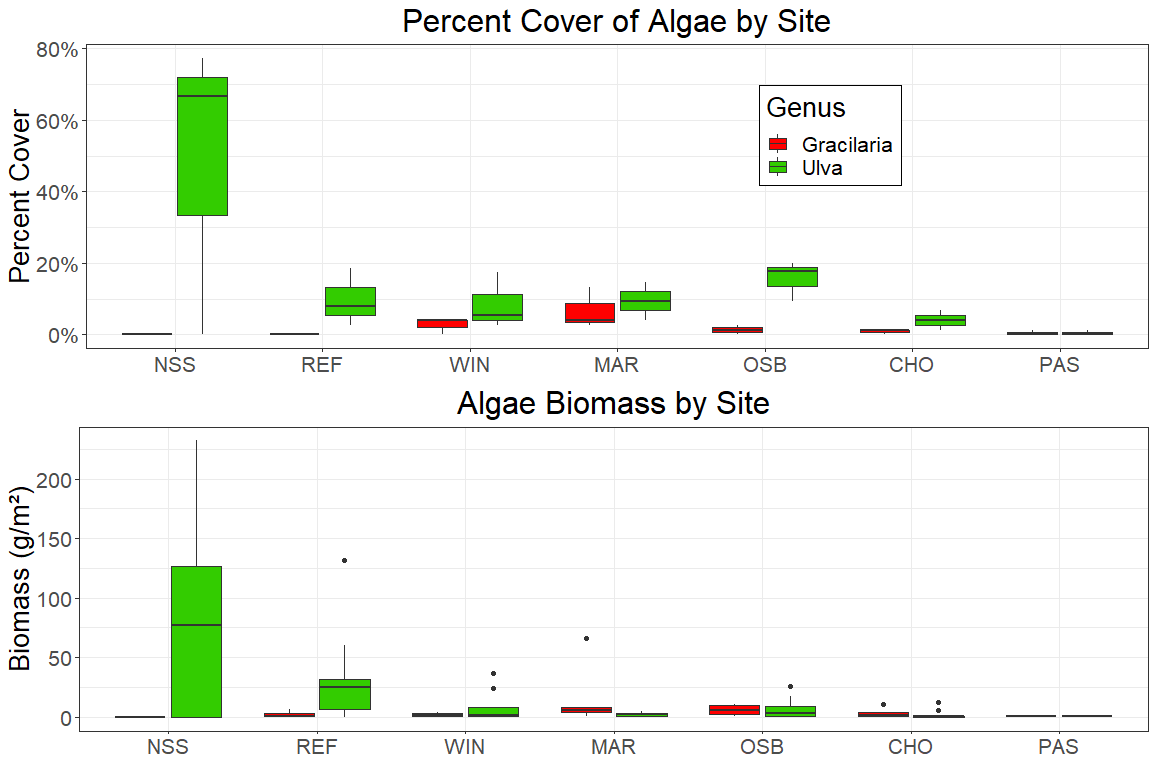
These figures display the percent cover (top) and biomass (bottom) results from the two most abundant types of algae sampled during our surveys. The sites are arranged on the graph from the norther-most on the left (at the bay mouth) to the southern-most on the right (back bay).