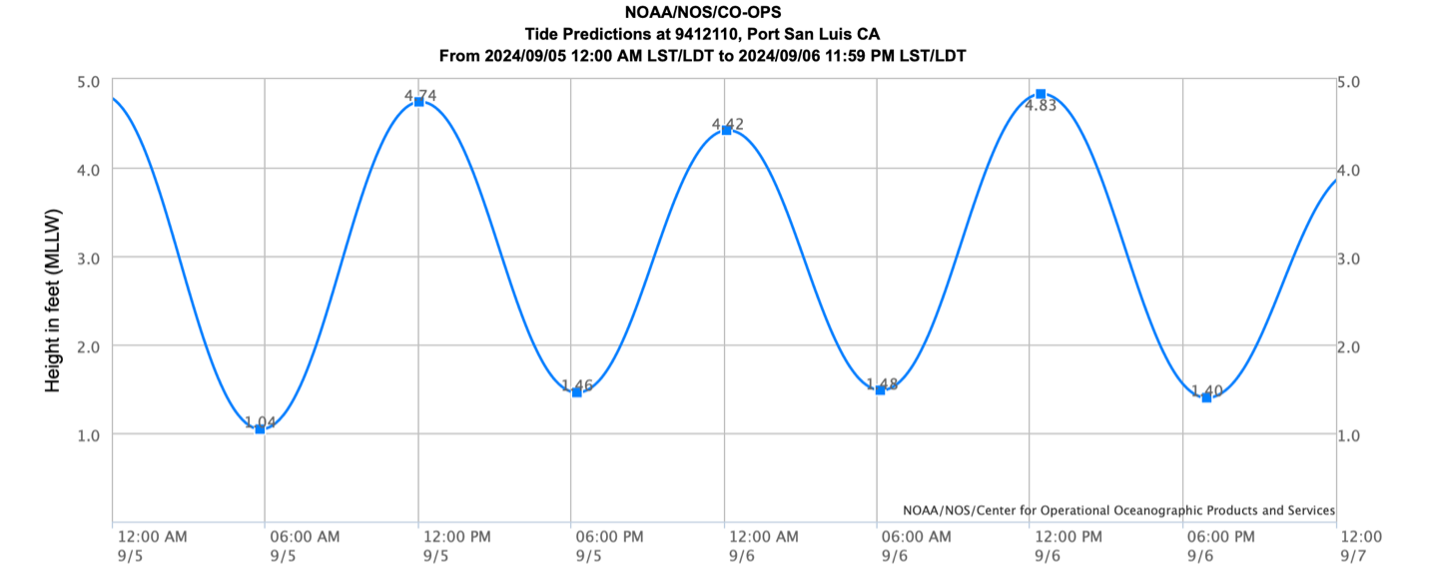
This tide chart provides the same data as the tide table but in a graphical format. Each high point on the graph represents the times and heights of high tides, and each low point represents times and heights of low tides. Photo Courtesy of NOAA’s online tide predictions.