As part of our triennial State of the Bay year, we compile a report sharing the latest monitoring and research information for our bay and creeks. In this blog, we’ll be summarizing some of the data from our 2026 report that indicate the health of the Morro Bay estuary.
Bay Fish Populations Shift with Eelgrass Abundance
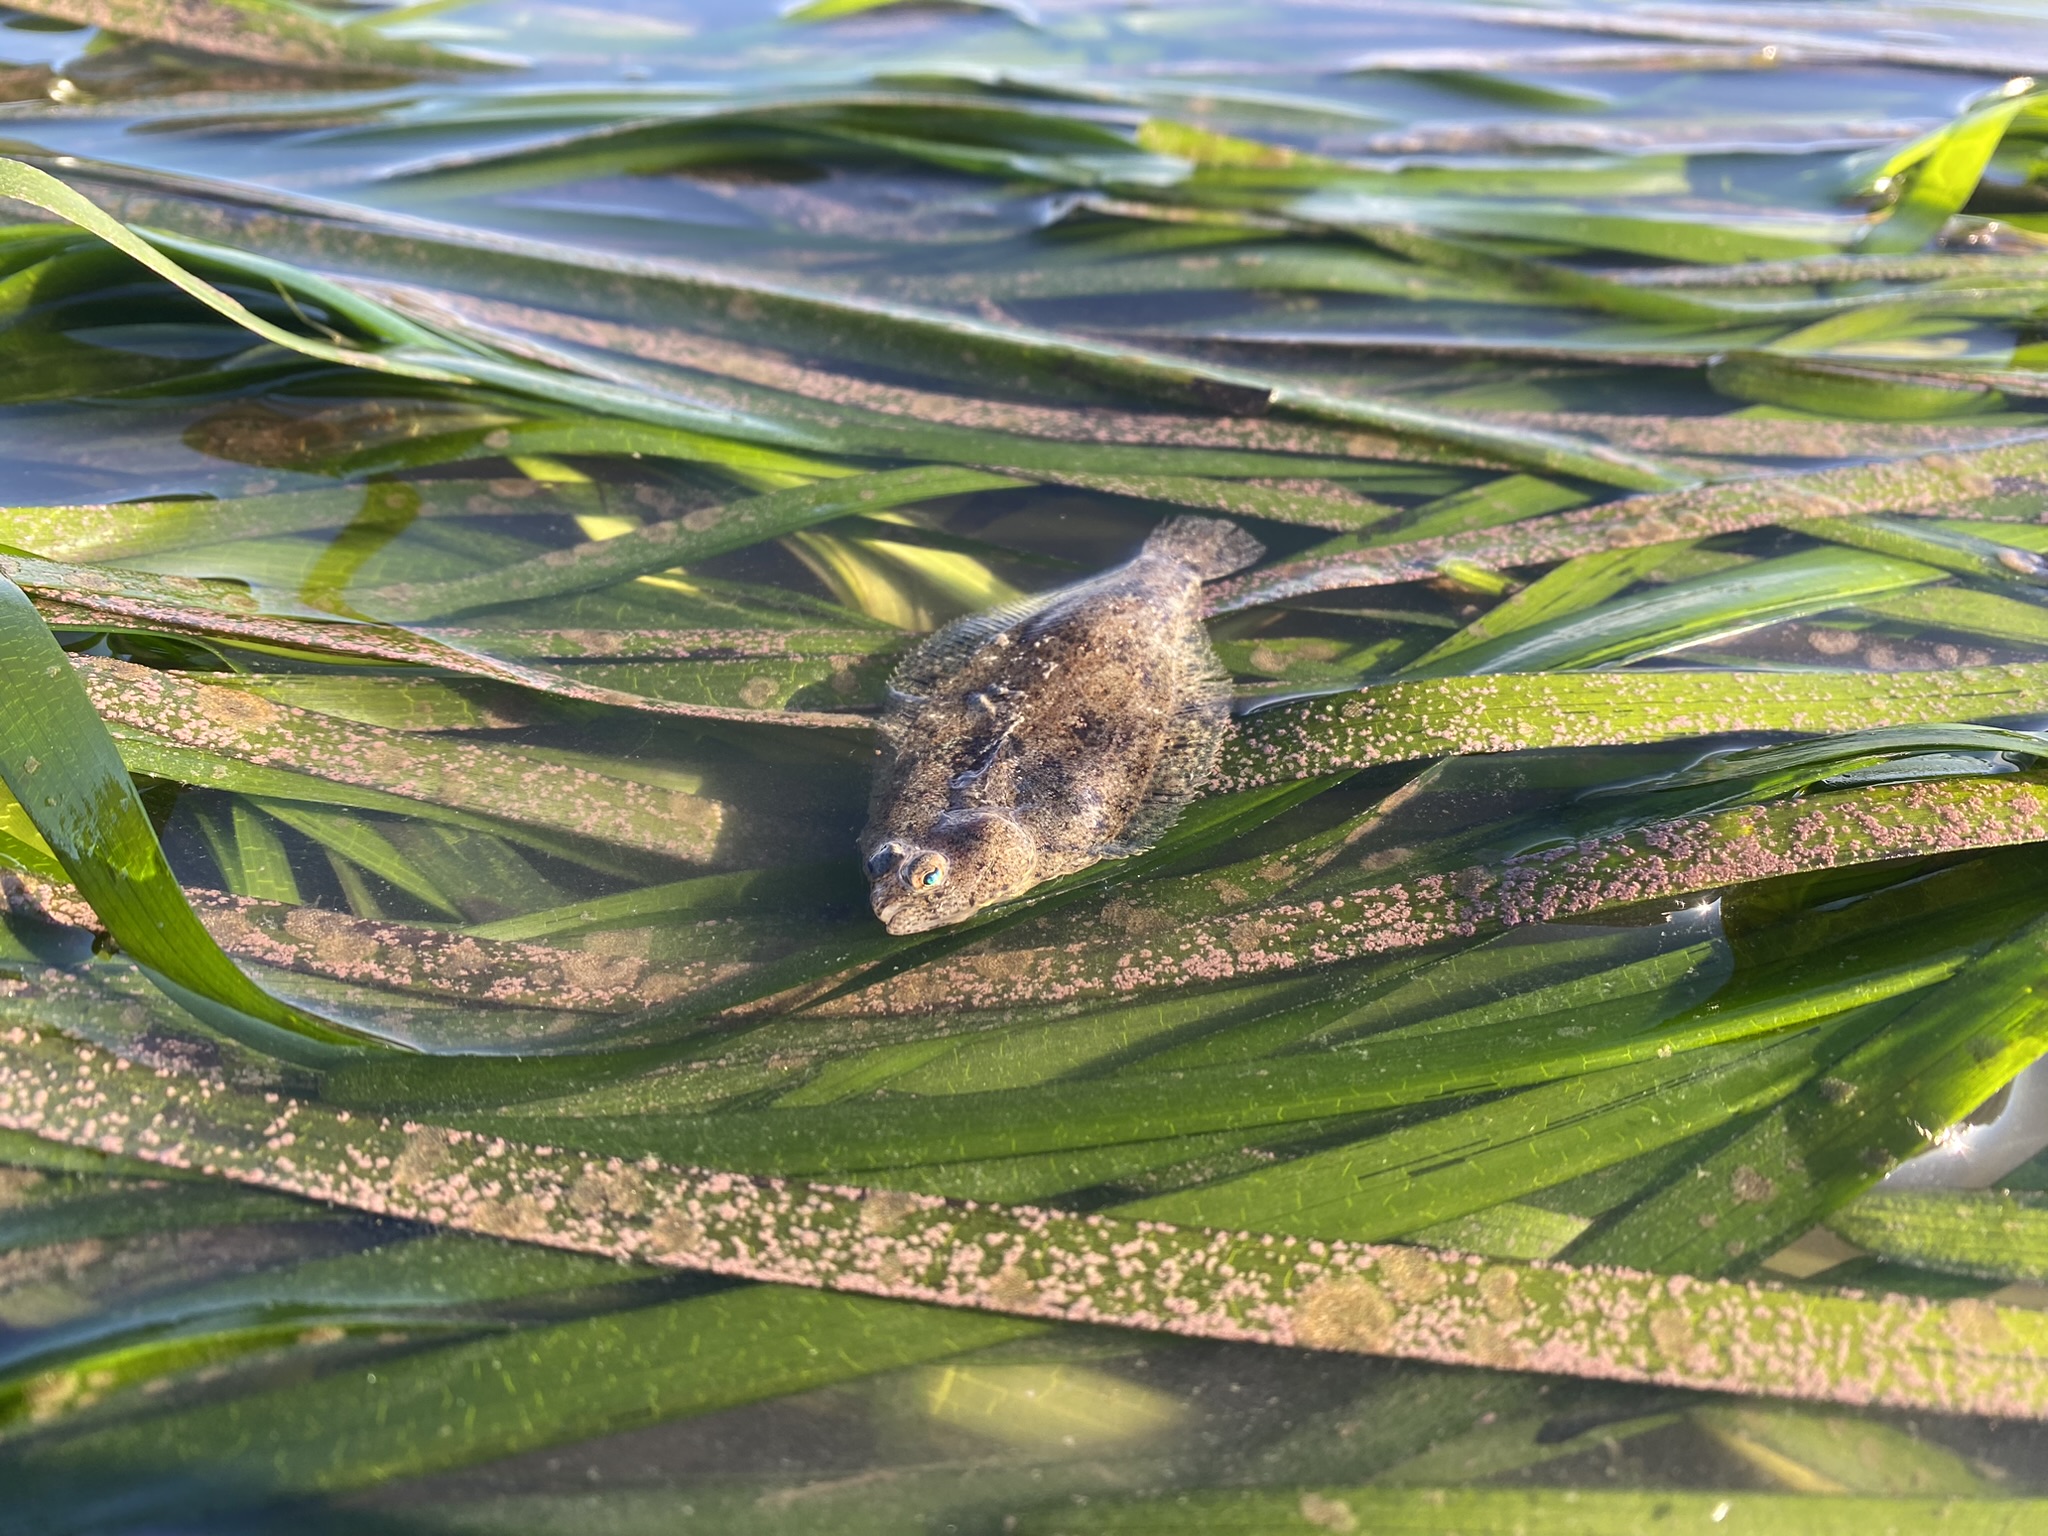
Eelgrass is a type of seagrass that is abundant in Morro Bay. It puts down roots in the bay floor, helping to reduce erosion and improve water quality. This plant also sequesters carbon and serves as habitat and food for wildlife.
Morro Bay’s eelgrass has undergone many changes in the past 20 years. From 2007 to 2017, the bay experienced a steep decline from 344 acres to only 13 acres of eelgrass. This sparked numerous monitoring and research efforts to better understand eelgrass extent and the factors that impact health. Starting around 2017, small patches of eelgrass were emerging in parts of the bay where it had been lost, primarily in the mid and back bay. This was the start of a steady increase in eelgrass acreage. Our mapping efforts indicated 500 acres in 2021 and 750 acres in 2023.
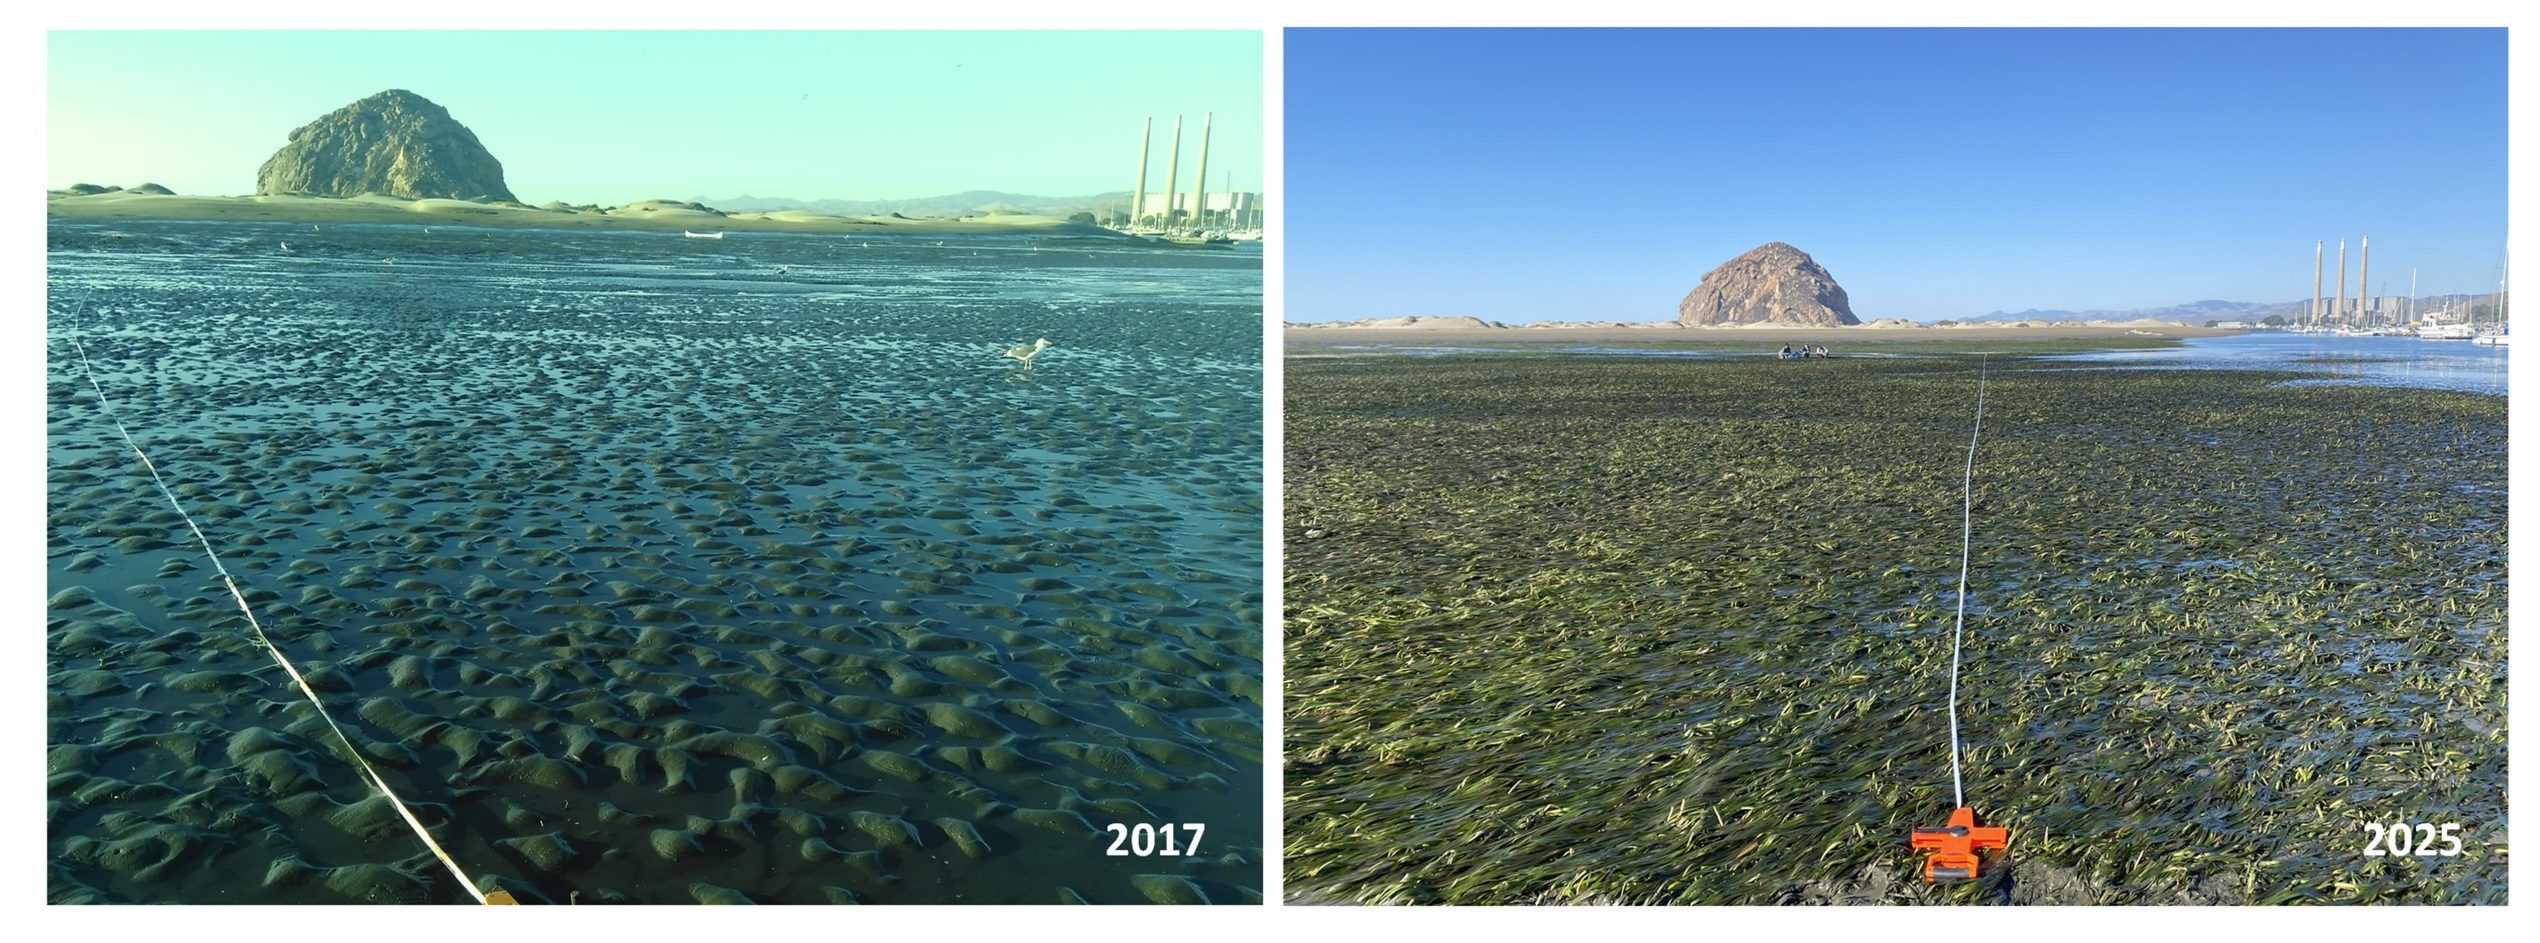
As you can imagine, the bay with 750 acres of eelgrass looks very different than the bay with only 13 acres. The Estuary Program and our partners were interested in understanding how the fish populations shifted with these changes in eelgrass. In 2006 and 2007, Dr. John Stephens of Occidental College conducted a baywide fish study when eelgrass covered approximately 344 acres of the bay. Nearly a decade later, Dr. Jennifer O’Leary of Cal Poly and Sea Grant repeated this work when the eelgrass had declined to only 13 acres. In 2023 and 2024, the Estuary Program completed similar monitoring efforts when eelgrass was at a record high of 750 acres.
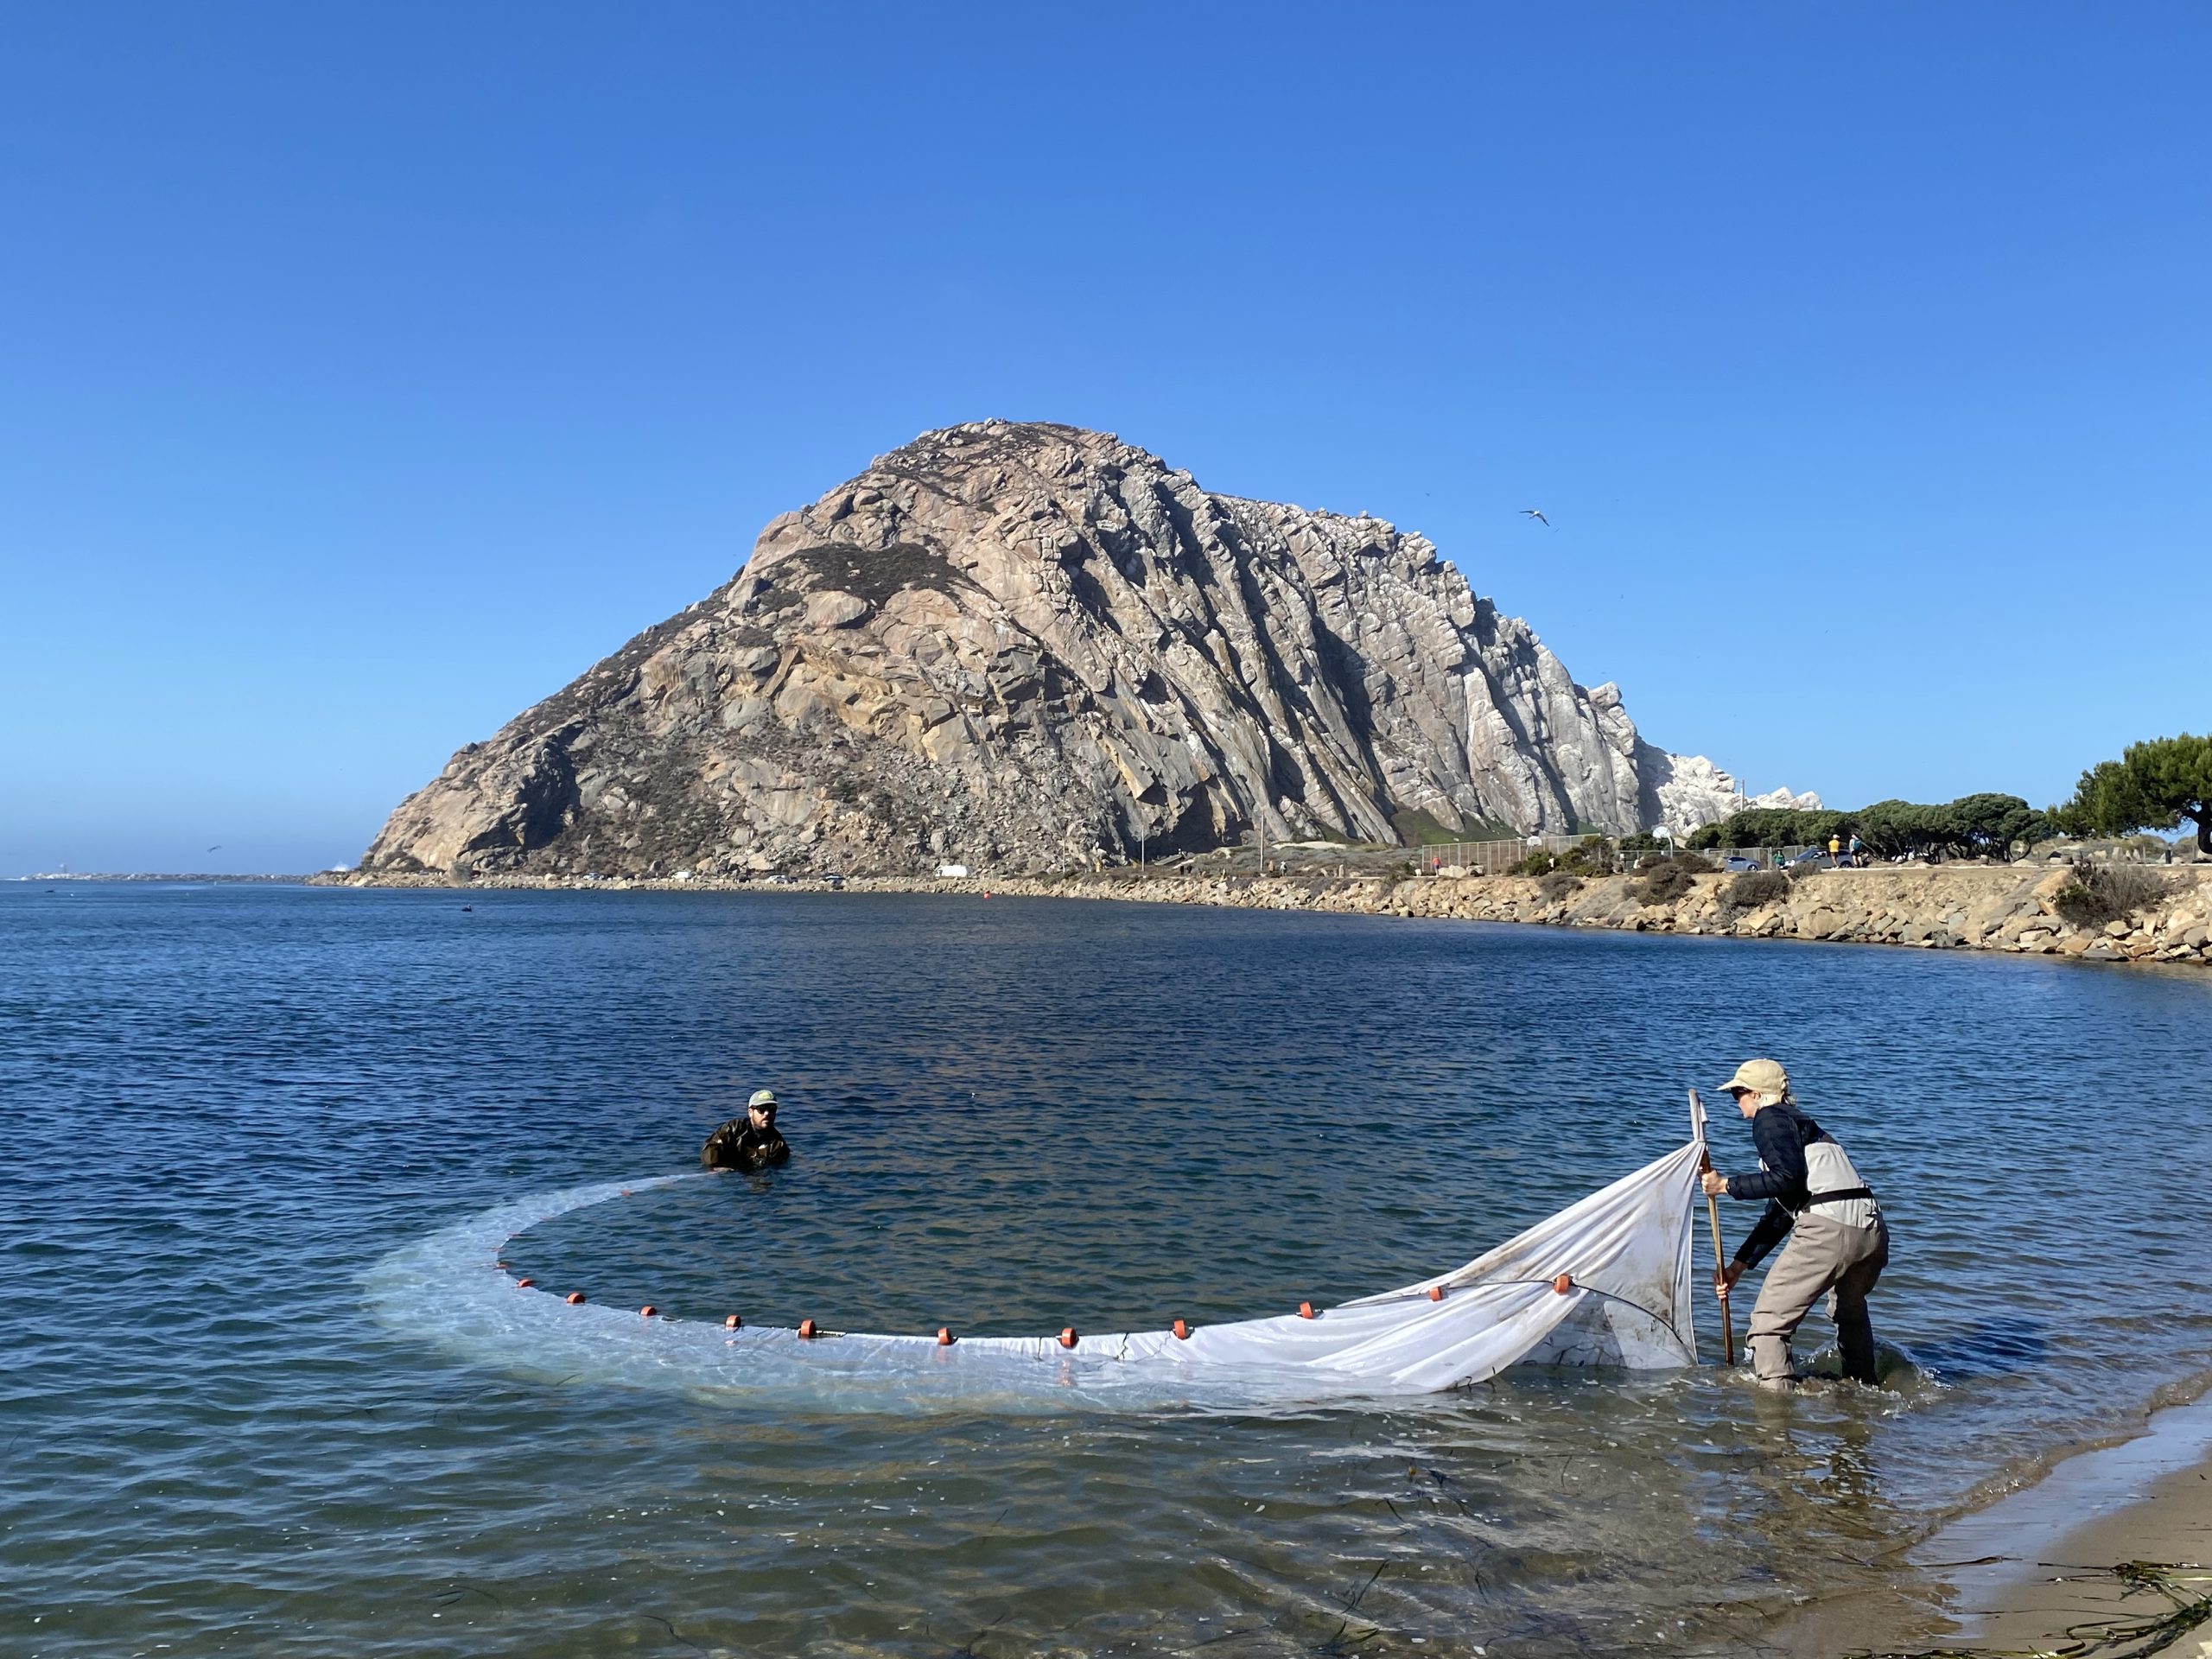
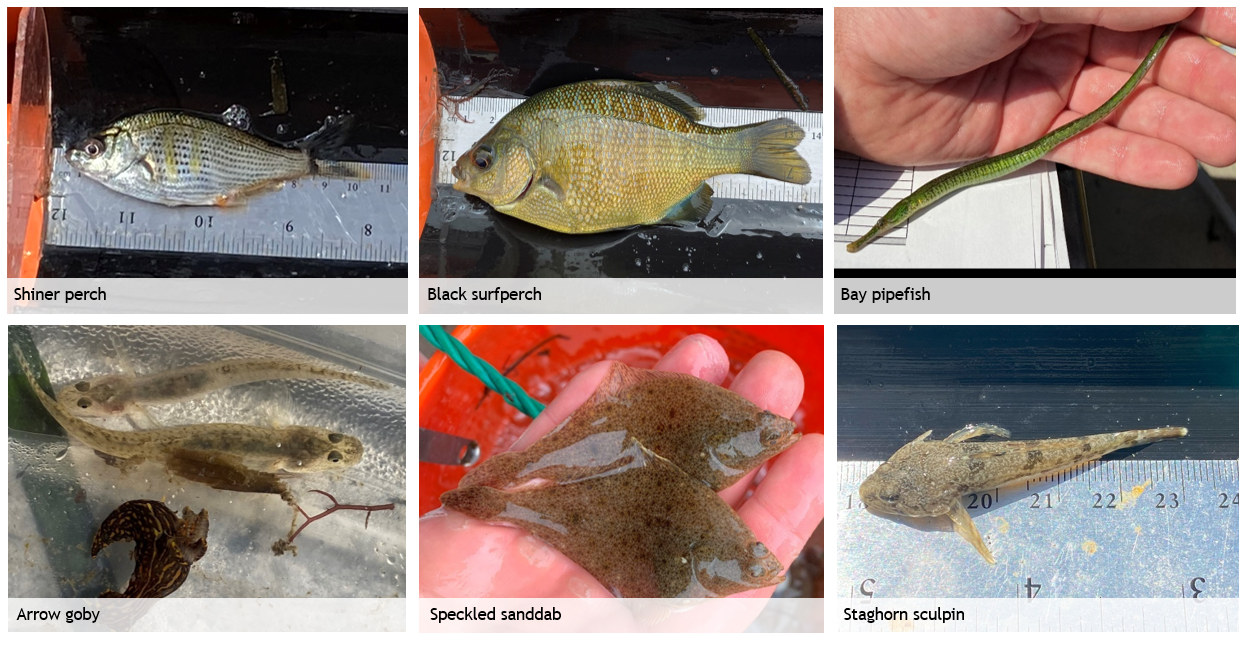
The data showed that the fish populations did indeed shift with eelgrass decline and recovery. While overall fish abundance and biomass remained steady throughout, the types of fish present shifted with eelgrass acreage. When little eelgrass was present, species like flatfish, known as habitat generalists, became more common, while eelgrass-dependent species like bay pipefish would decline. Using the same monitoring methods as earlier efforts, we collected fish data in the fall of 2023 and spring of 2024 during a time of high eelgrass abundance. A total of 8,317 fish of 24 different taxa were collected. Bay pipefish were the most abundant species, accounting for over 40% of the total catch, followed by arrow goby at 20% and shiner perch at 10%.
The work only serves to emphasize the important role eelgrass plays in a thriving ecosystem. The Estuary Program will continue to map and monitor eelgrass in the bay to support sensitive habitats and aquatic life in Morro Bay’s diverse estuarine environment. To read more about eelgrass, visit our online 2026 State of the Bay Report. More details on the fish data are available on our State of the Bay data dashboard.
Safe Swimming in the Bay
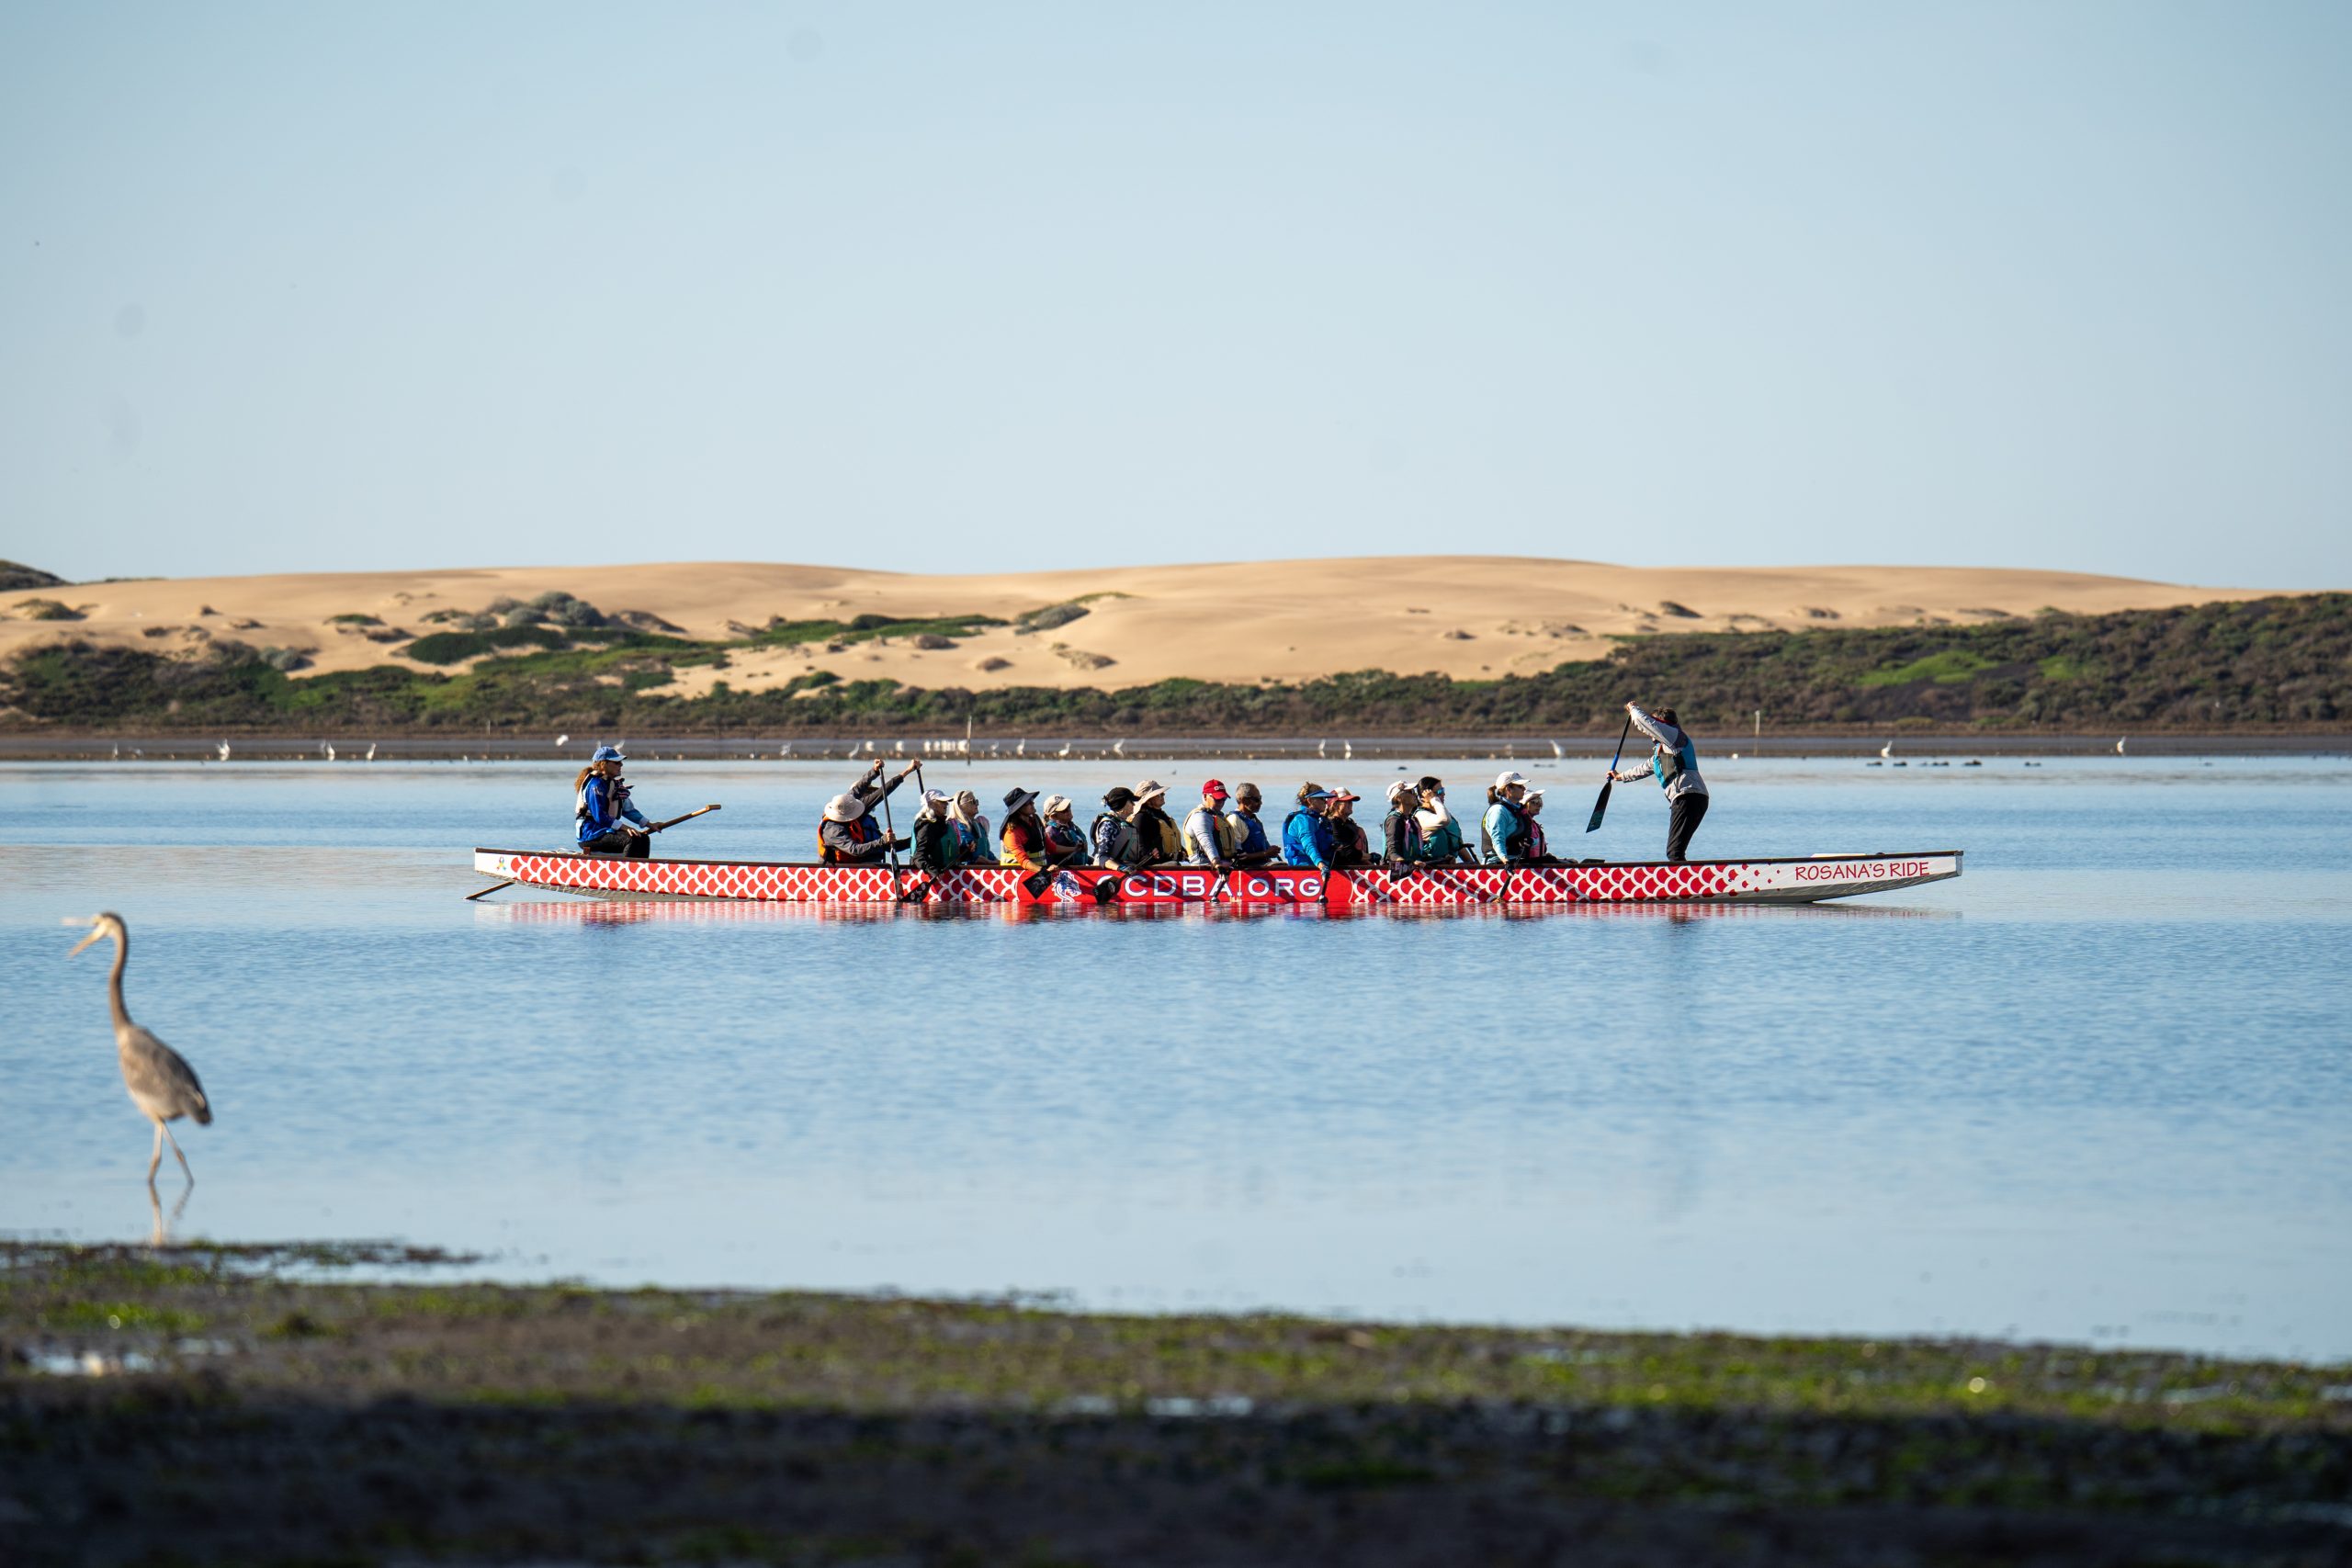
While much of our work focuses on the health of the bay for wildlife, we are also interested in its impact on humans. The bay attracts visitors and residents for activities such as sailing, paddling, swimming, and fishing. These activities can only be enjoyed if the waters are clean. Pollutants like viruses, bacteria, and protozoa can cause illnesses in people and wildlife.
For 20 years, Estuary Program staff and volunteers have conducted monthly monitoring of bay bacteria at eight shoreline sites to determine if fecal contamination might be present. Popular access sites such as Coleman Beach and Tidelands Park were selected for monitoring.
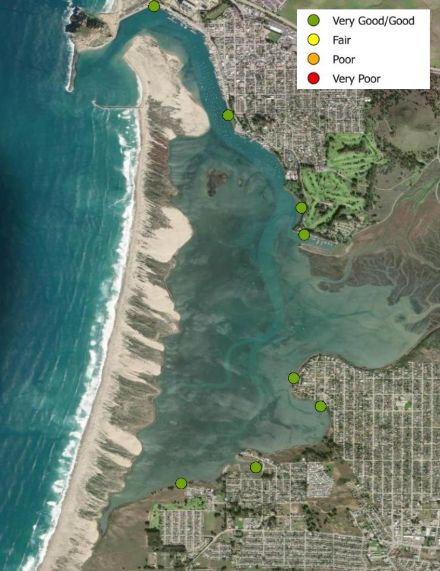
While the bay is a natural system with fluctuating conditions, the waters are relatively clean and our data shows that they are safe for swimming most of the time in the locations where we test. Visit our online 2026 State of the Bay report for more information. To see the data used to create the indicator map above, visit our State of the Bay data dashboard.
Join Us to Learn More
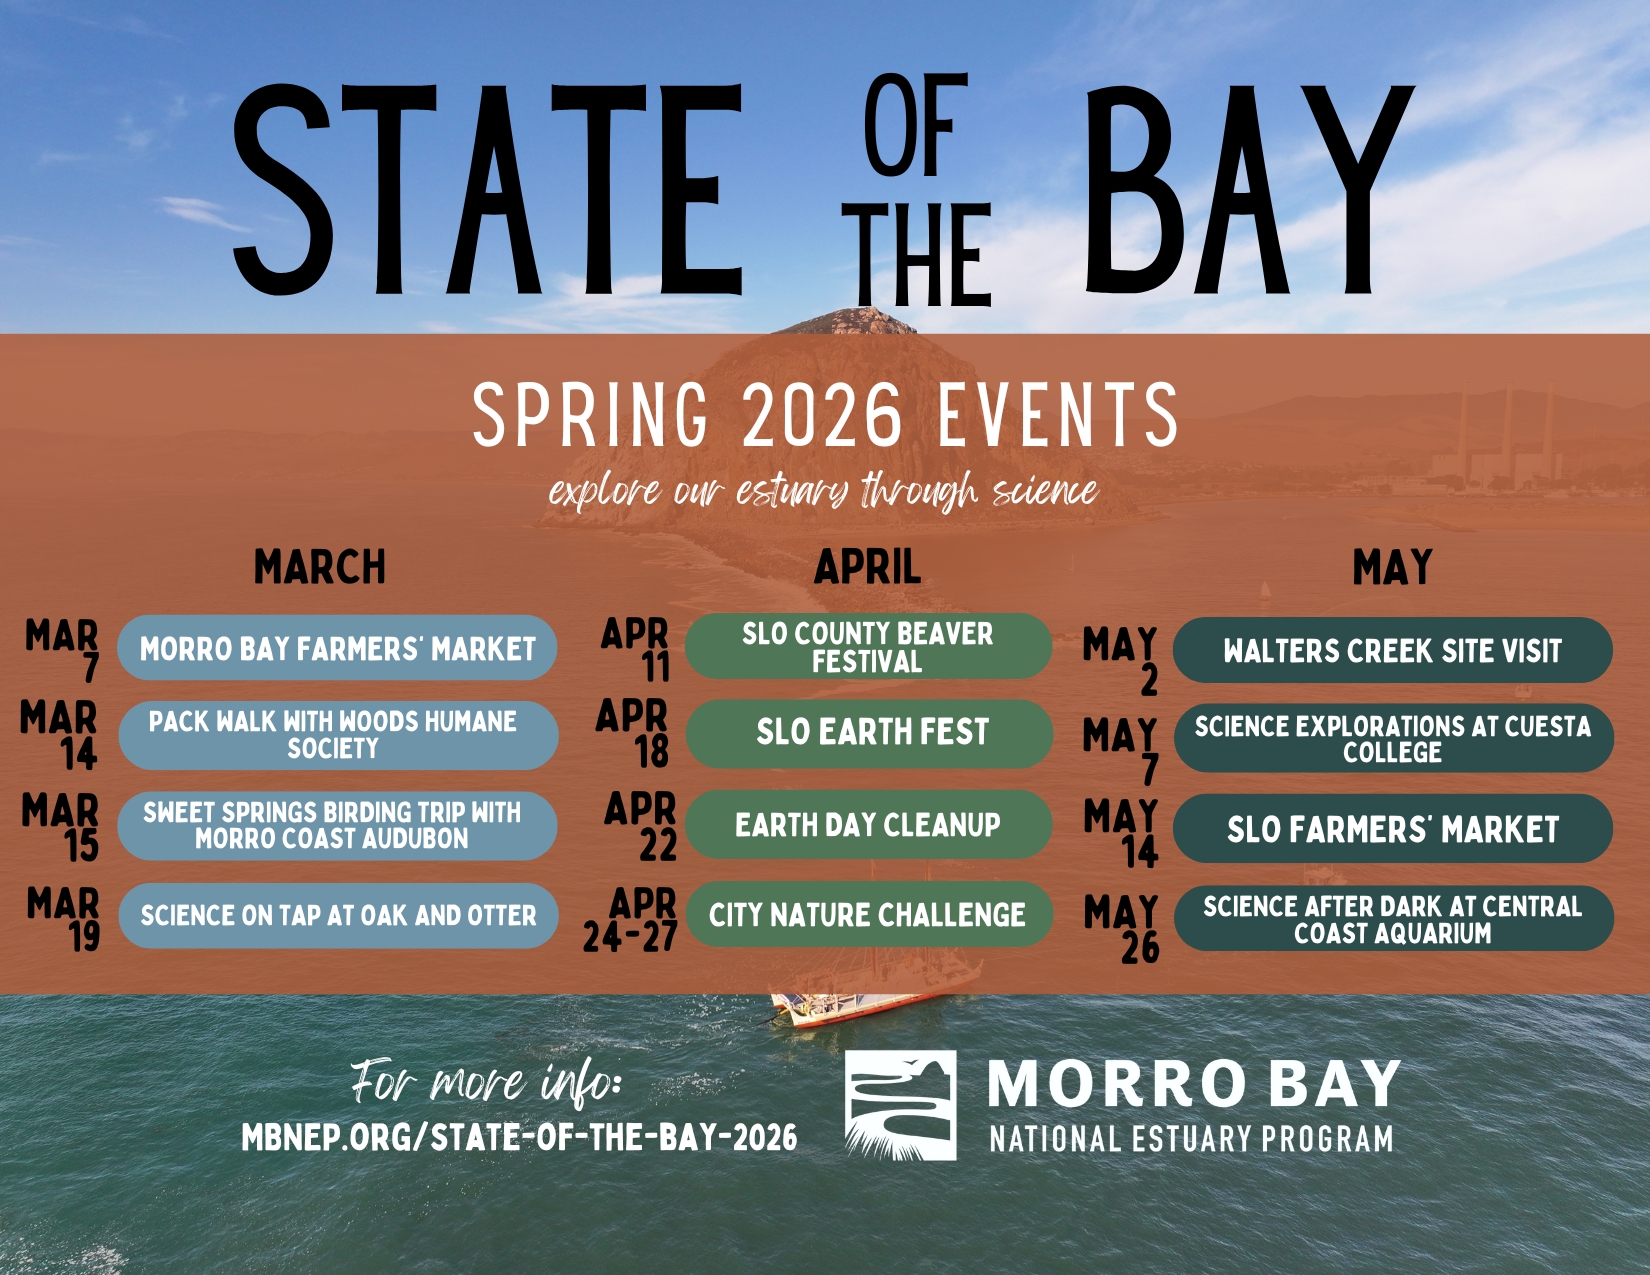
This was only a sample of the bay health information available in our State of the Bay Report. Read the report to learn more. We will be hosting a series of events from March through May to share the results of the report. To learn more, visit our State of the Bay events page.
References
Bay Fish and eelgrass recovery: https://www.mbnep.org/2025/03/14/field-updates-fish-response-to-eelgrass-recovery-in-morro-bay/
Bay Fish Technical Report: https://library.mbnep.org/wp-content/uploads/2026/01/SWS-Morro-Bay-Fisheries-Monitoring-Report_MBNEP_Clean.pdf