When you read a tide table, it predicts tide height based on factors such as the gravitational pull from the sun and moon. What these tables don’t take into account are local factors like weather, winds, and air pressure that can also impact tides. You may have noticed the tides have been a bit higher than predicted during the last few months, which is likely due to a marine heatwave offshore of California causing warmer ocean temperatures. Experts at the National Oceanic Atmospheric Administration have been tracking a large marine heatwave off the West Coast since last May. According to NOAA, this is only the third time since 1982 that such a large part of the ocean has been warm for so long.
What Are Marine Heatwaves?
Marine heatwaves occur when the ocean temperatures are much warmer than expected average temperatures for five or more days (Hobday et al. 2016). For example, if ocean temperatures are usually 55 °F in December, but the ocean temperatures are currently 61 °F (>5.5 °F above expected) for five or more days, then we are experiencing a marine heatwave.

What Are the Impacts of Marine Heatwaves?
Marine heatwaves can negatively impact coastal flooding, extreme weather, and water quality. They also can cause harmful algal blooms, increases in diseases, and changes in the marine food web (Bond et al. 2015; Smith et al. 2023). Some ecosystems have experienced mass mortality events of fish, kelp, seagrasses, coral, sea stars, and other organisms due to marine heatwaves (Wernberg et al. 2025). These losses can directly impact local fisheries, aquaculture, and tourism (Wernberg et al. 2025).
Is Morro Bay Experiencing Marine Heatwaves?
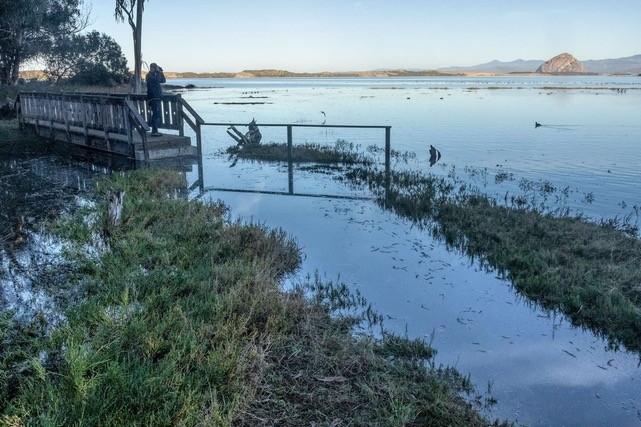
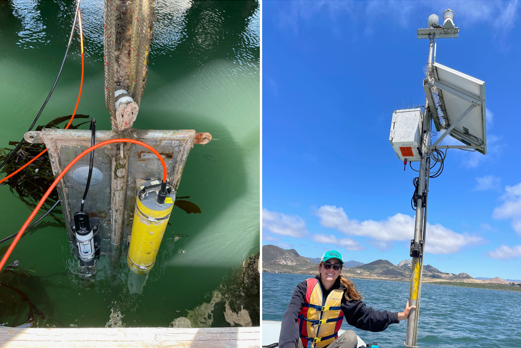
Morro Bay is fortunate to have two sensor arrays as part of the Central and Northern California Ocean Observing System (CeNCOOS). One station is located at the T-pier near the bay mouth, and the other is located in the back bay near the oyster farms. These stations measure continuous water quality data including temperature readings that we can utilize to track marine heatwave trends in the bay.
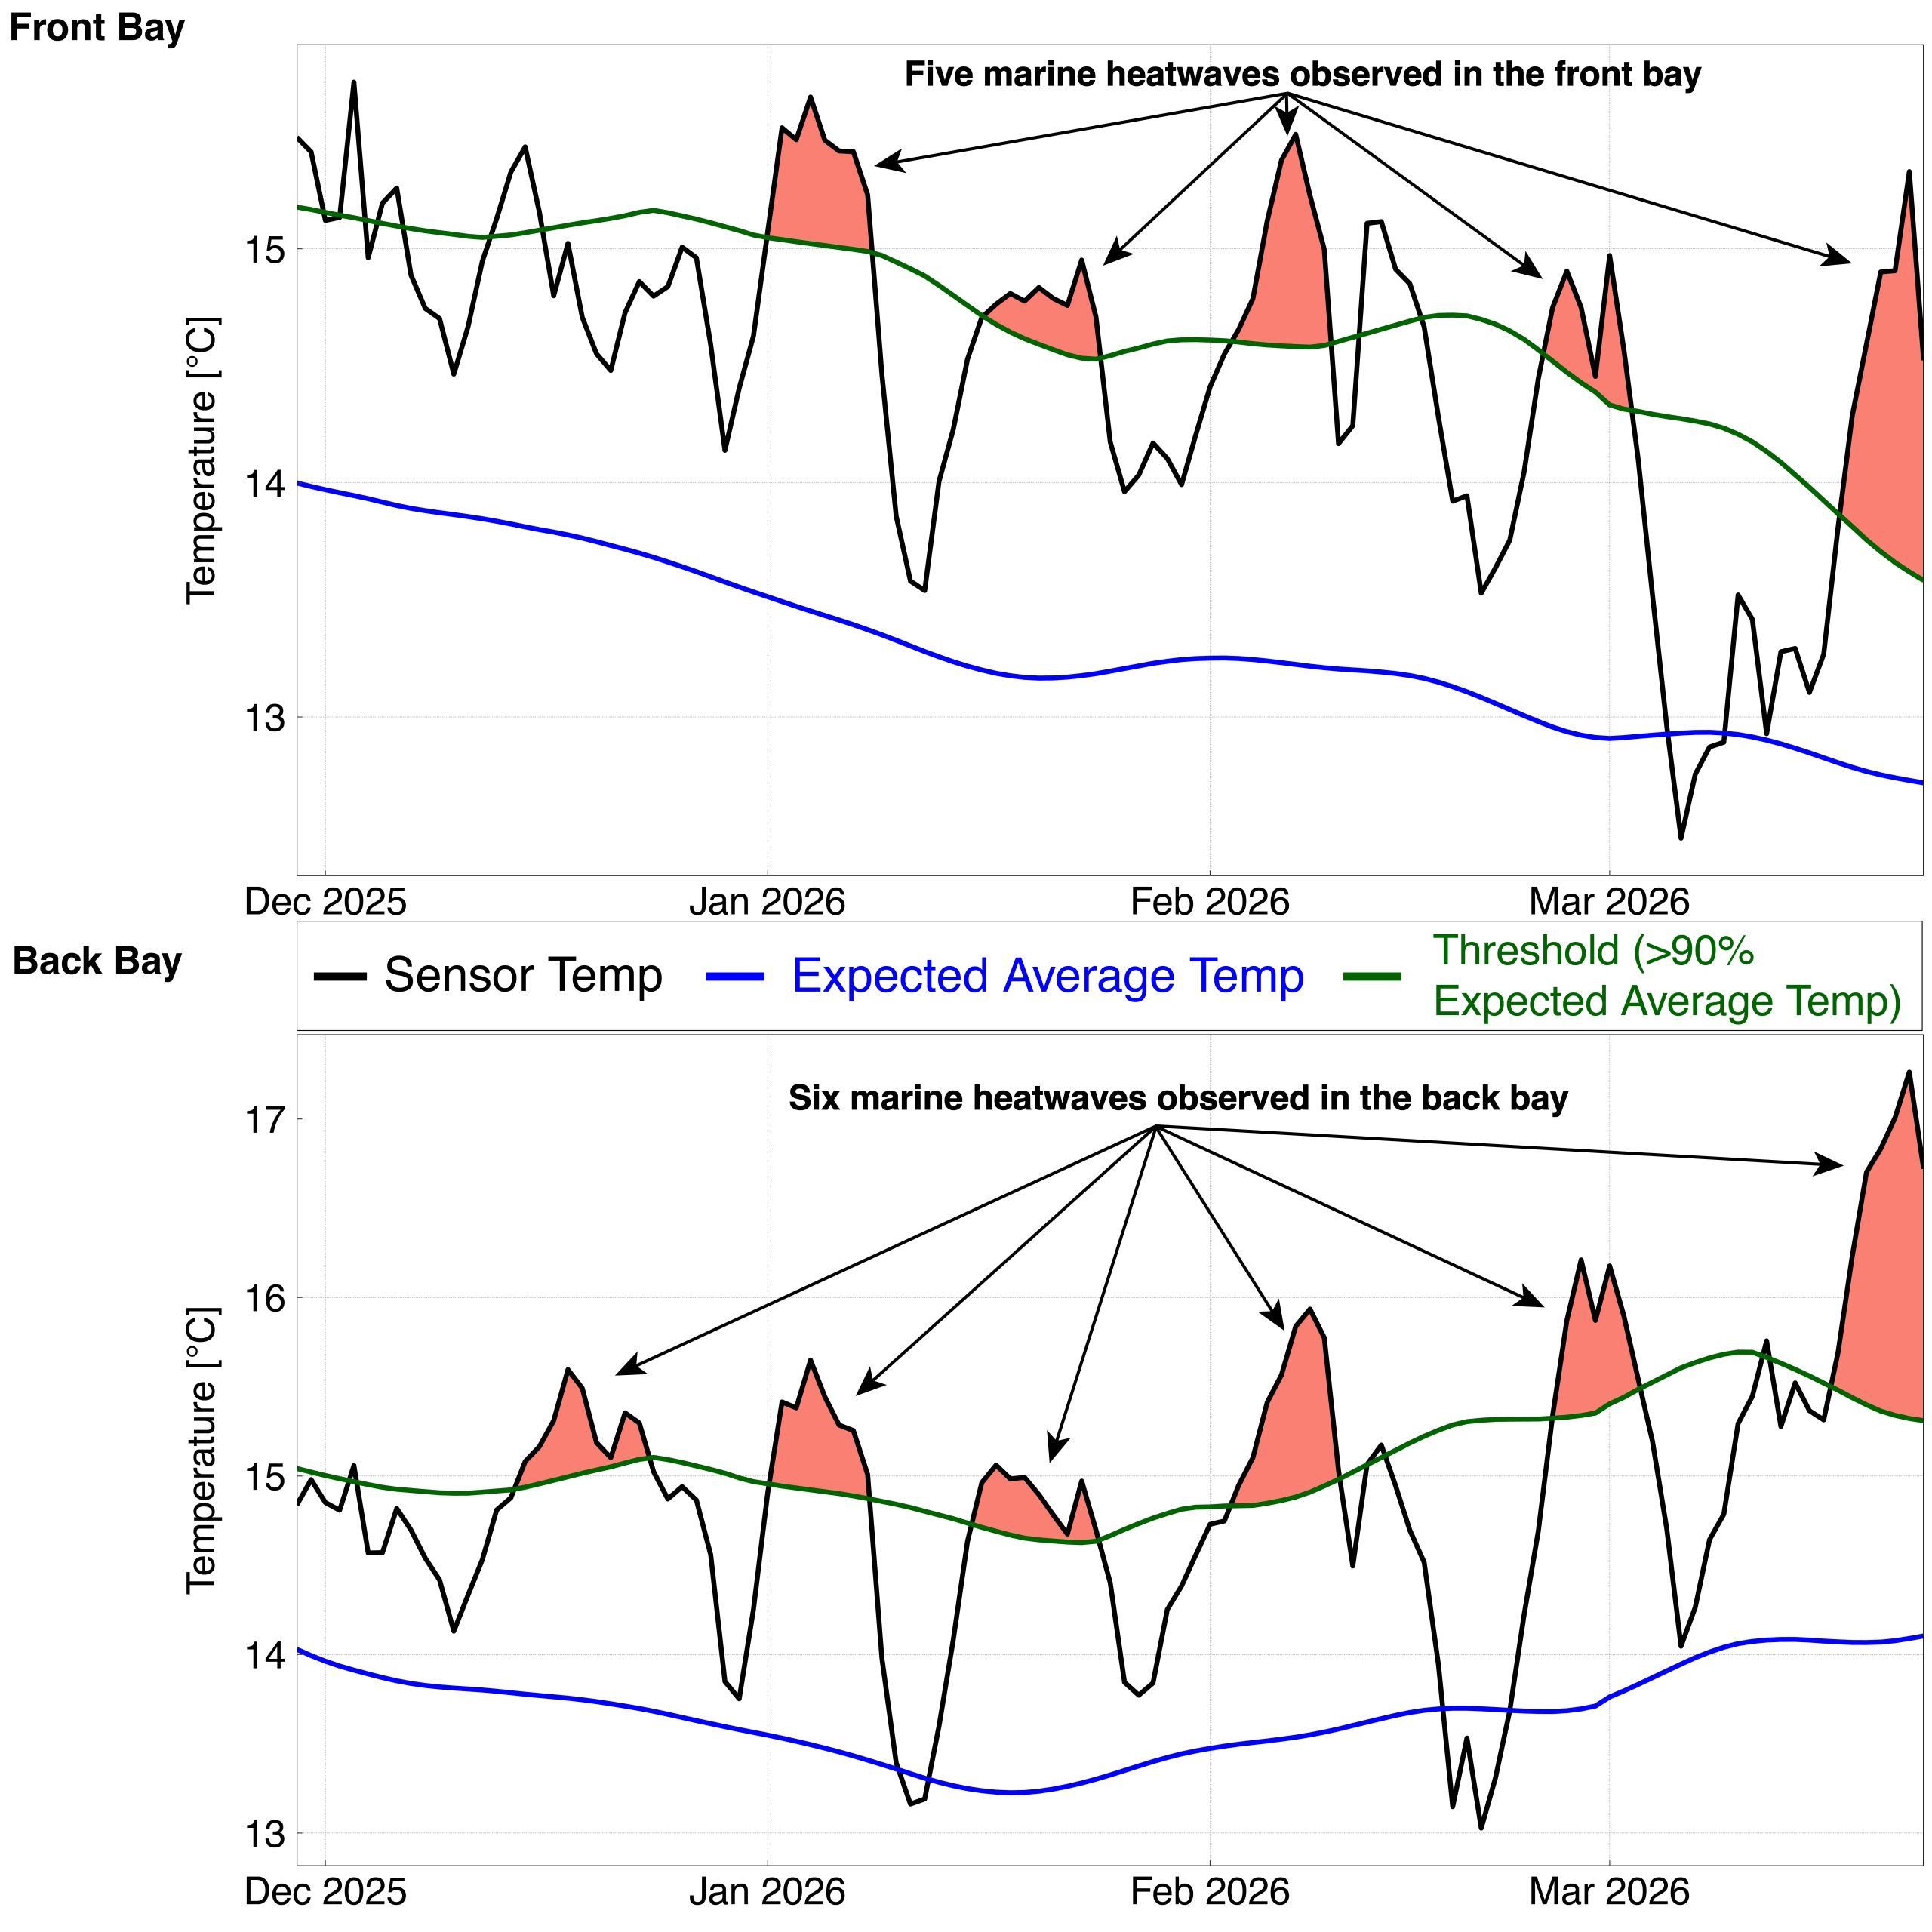
Temperature readings from these stations when compared with expected seasonal temperatures show that we have experienced several marine heatwave events since December. The front bay experienced five marine heatwaves, and the back bay experienced six marine heatwaves. The most intense of these marine heatwaves were over 4.5°F (2.5°C) higher than the expected temperatures.
NOAA’s heatwave forecasts suggest the marine heatwave will dissipate along the coast in the spring. However, we are predicted to enter into an El Niño cycle later this summer, which is where ocean temperatures offshore are increased. These warmer waters could change the ocean dynamics. Since the frequency of marine heatwaves is likely to increase in the future (Oliver et al. 2018), the Estuary Program will continue to track local ocean temperature trends and habitat responses over time.
How Can I Learn More?
- Check out a global marine heatwave tracker: https://www.marineheatwaves.org/tracker.html
- There is even a specific tracker for the California Current Ecosystem: https://www.integratedecosystemassessment.noaa.gov/regions/california-current/california-current-marine-heatwave-tracker-blobtracker
- A time-lapse current marine heatwave (named NEP25A) from Jan-Nov. 2025. The marine heatwave is outlined by a dark black line: https://www.youtube.com/watch?v=W3Awdw3-v0g
- For more information about one of the impacts of marine heatwaves, harmful algae blooms, check out our previous blog post
References:
Bond, N A., Cronin, M.F., Freeland, H., & Mantua, N. (2015). Causes and impacts of the 2014 warm anomaly in the NE Pacific. Geophysical Research Letters 42, 3414–3420. https://doi.org/10.1002/2015GL063306
Hobday, A.J., Alexander, L.V., Perkins, S.E. et al. (2016). A hierarchical approach to defining marine heatwaves. Progress in Oceanography 141, pp. 227-238. 10.1016/j.pocean.2015.12.014
NOAA. https://oceanservice.noaa.gov/education/tutorial_tides/tides08_othereffects.html
Oliver, E.C.J., Donat, M.G., Burrows, M.T. et al. (2018). Longer and more frequent marine heatwaves over the past century. Nature Communications 9, 1324. https://doi.org/10.1038/s41467-018-03732-9
Schlegel, R.W., and Smit, A.J. (2018). heatwaveR: A central algorithm for the detection of heatwaves and cold-spells. Journal of Open Source Software, 3(27), 821, https://doi.org/10.21105/joss.00821
Smith, K.E., Burrows, M.T., Hobday, A.J. et al. (2023). Biological impacts of marine heatwaves. Annual Review of Marine Science. 15(1), 119-145.
Wernberg, T., Thomsen, M.S., Burrows, M.T. et al. (2025). Marine heatwaves as hot spots of climate change and impacts on biodiversity and ecosystem services. Nature Reviews Biodiversity. 1, 461–479. https://doi.org/10.1038/s44358-025-00058-5