Morro Bay Elevation Change, Morro Bay National Estuary Program
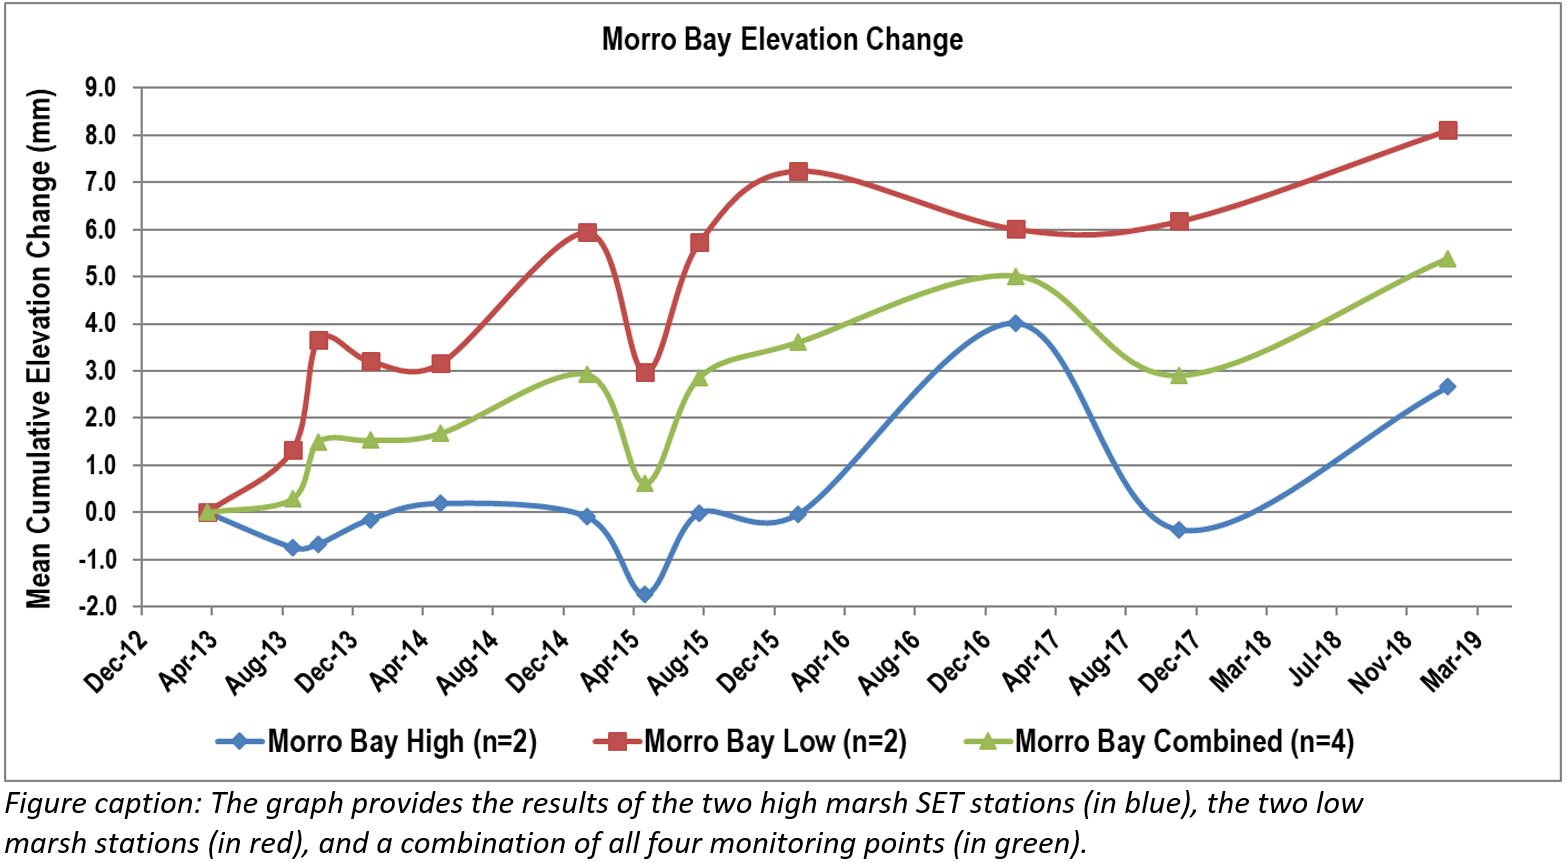
The graph provides the results of the two high marsh SET stations (in blue), the two low marsh stations (in red), and a combination of all four monitoring points (in green).
Morro Bay Elevation Change, Morro Bay National Estuary Program