What we learn from bioassessment survey results
One of the goals of the Estuary Program is to monitor the bay and the lands that surround it to better understand conditions and how they are changing over time. As part of this effort, the Estuary Program conducts spring bioassessment surveys. This data allow us to assess the health of our creeks and determine if they support sensitive aquatic life.
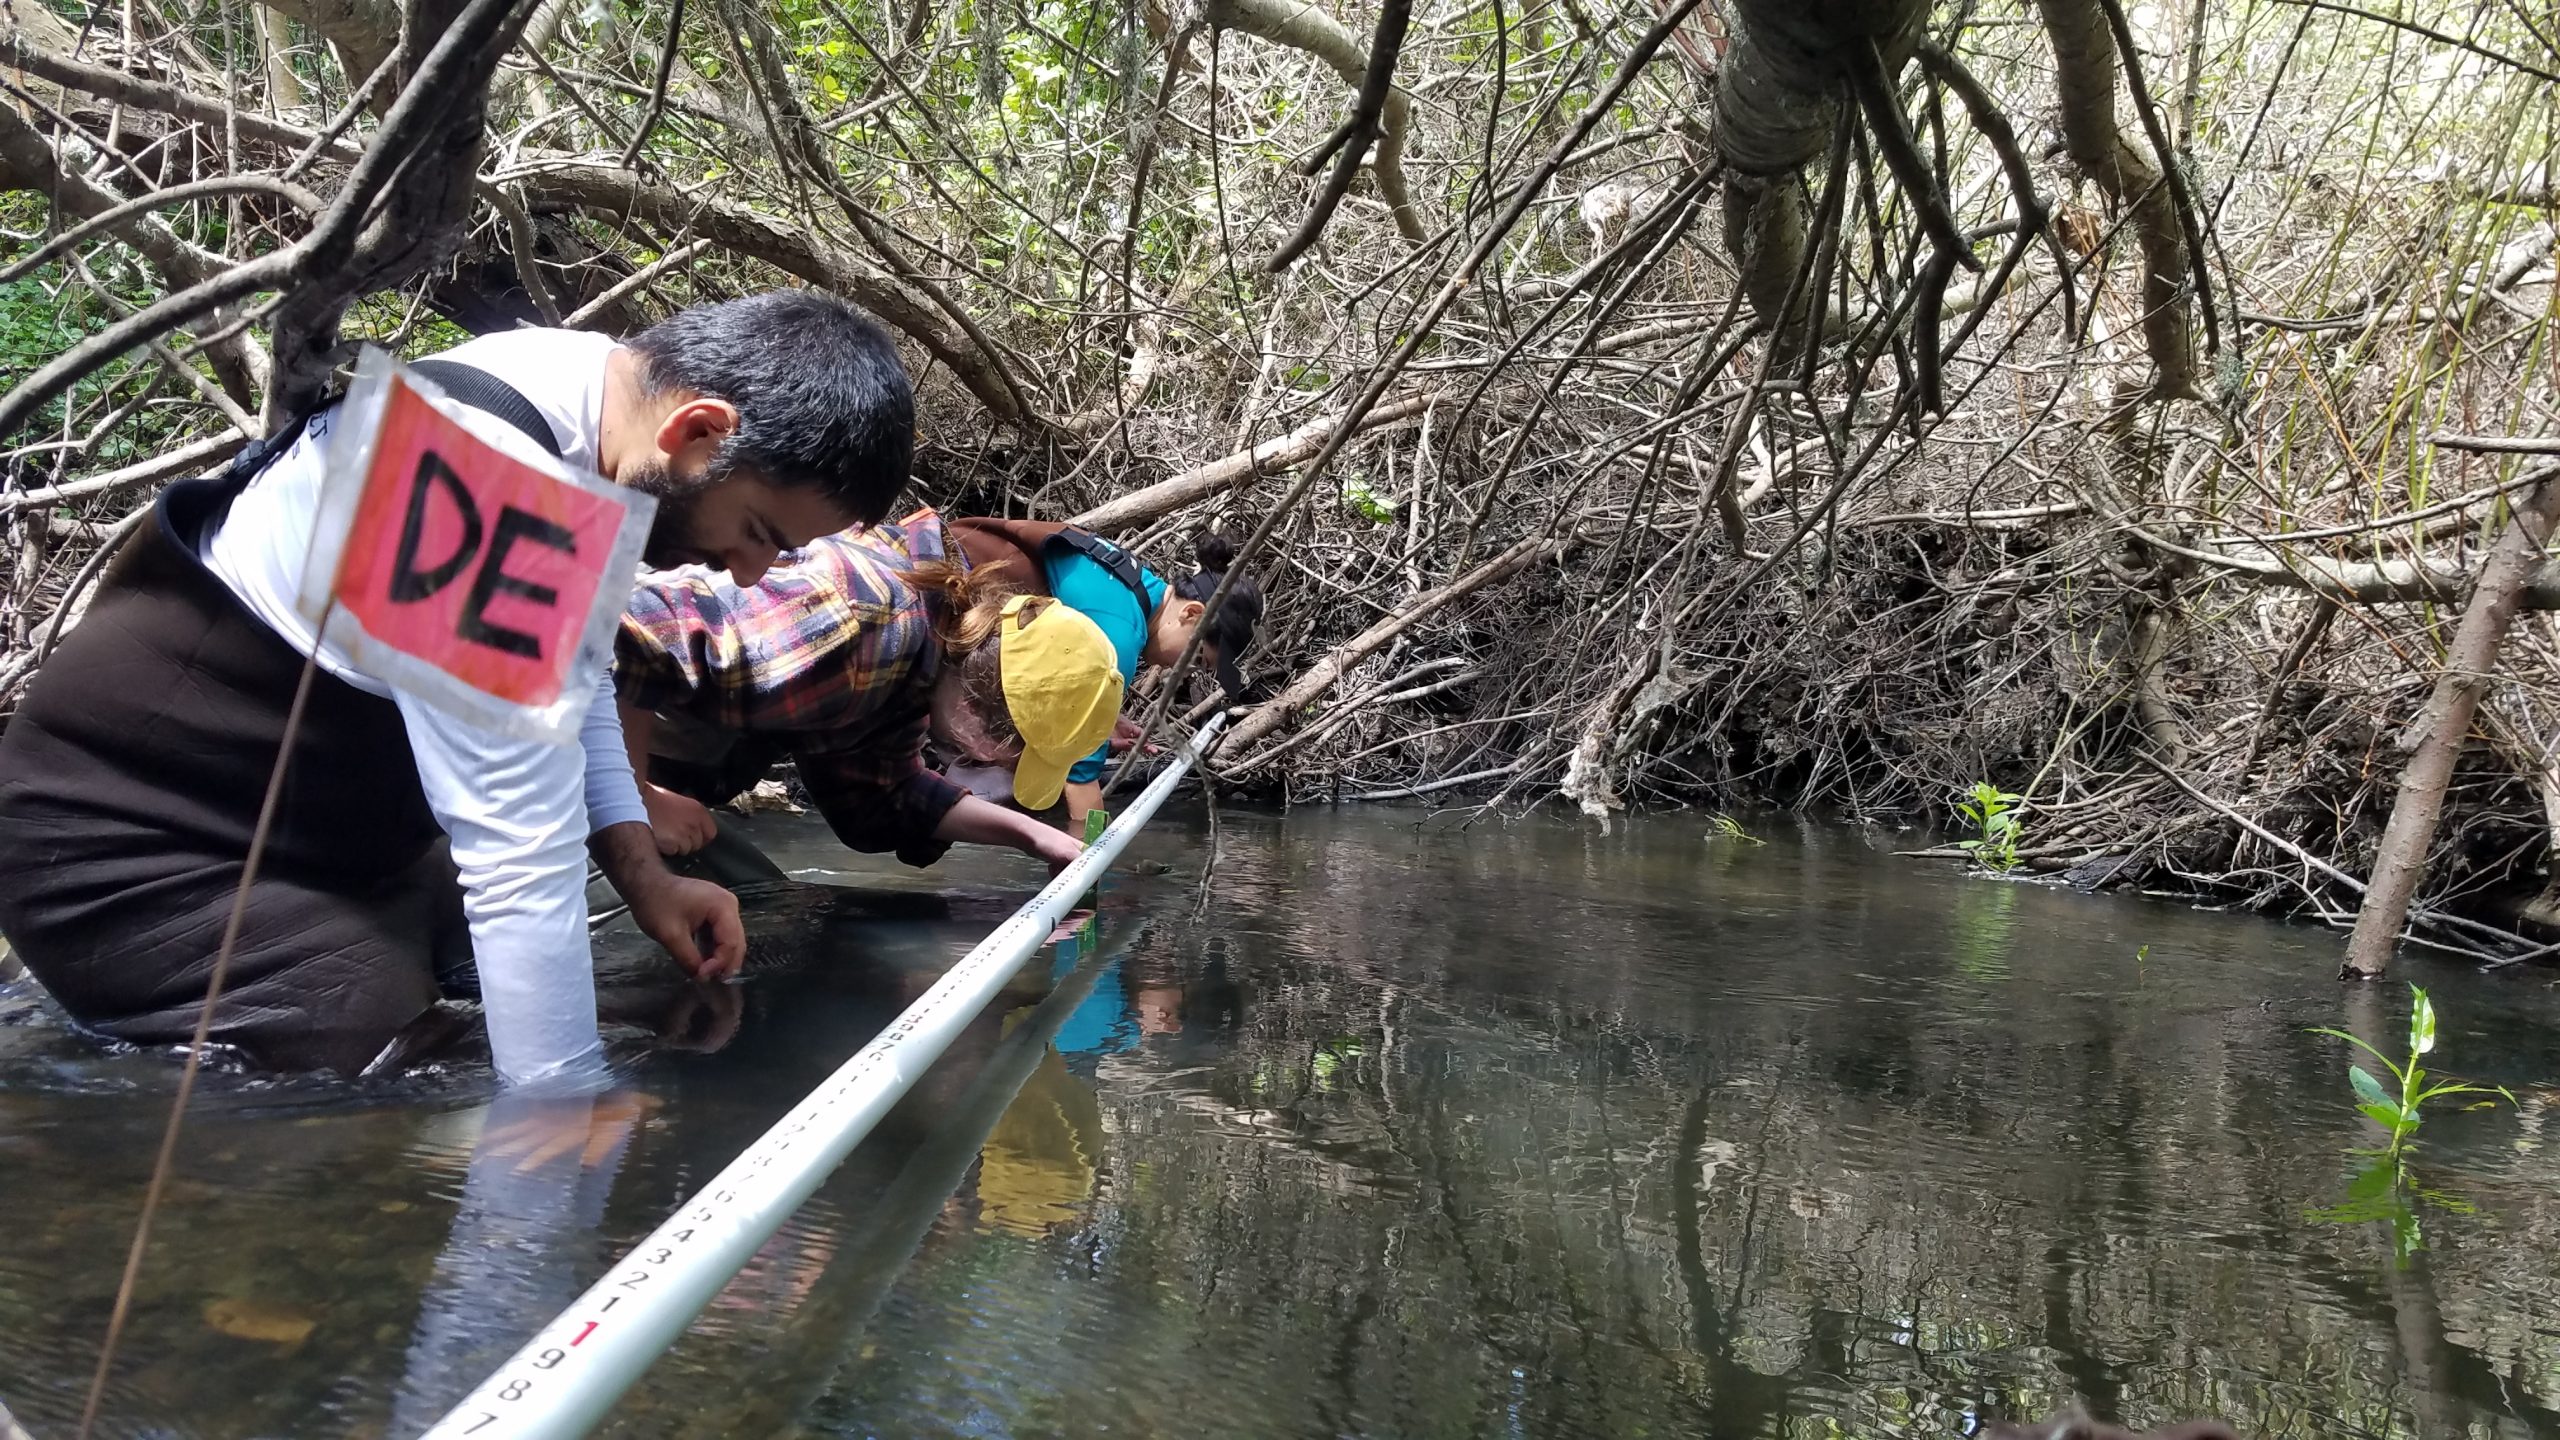
What we collect during bioassessment surveys
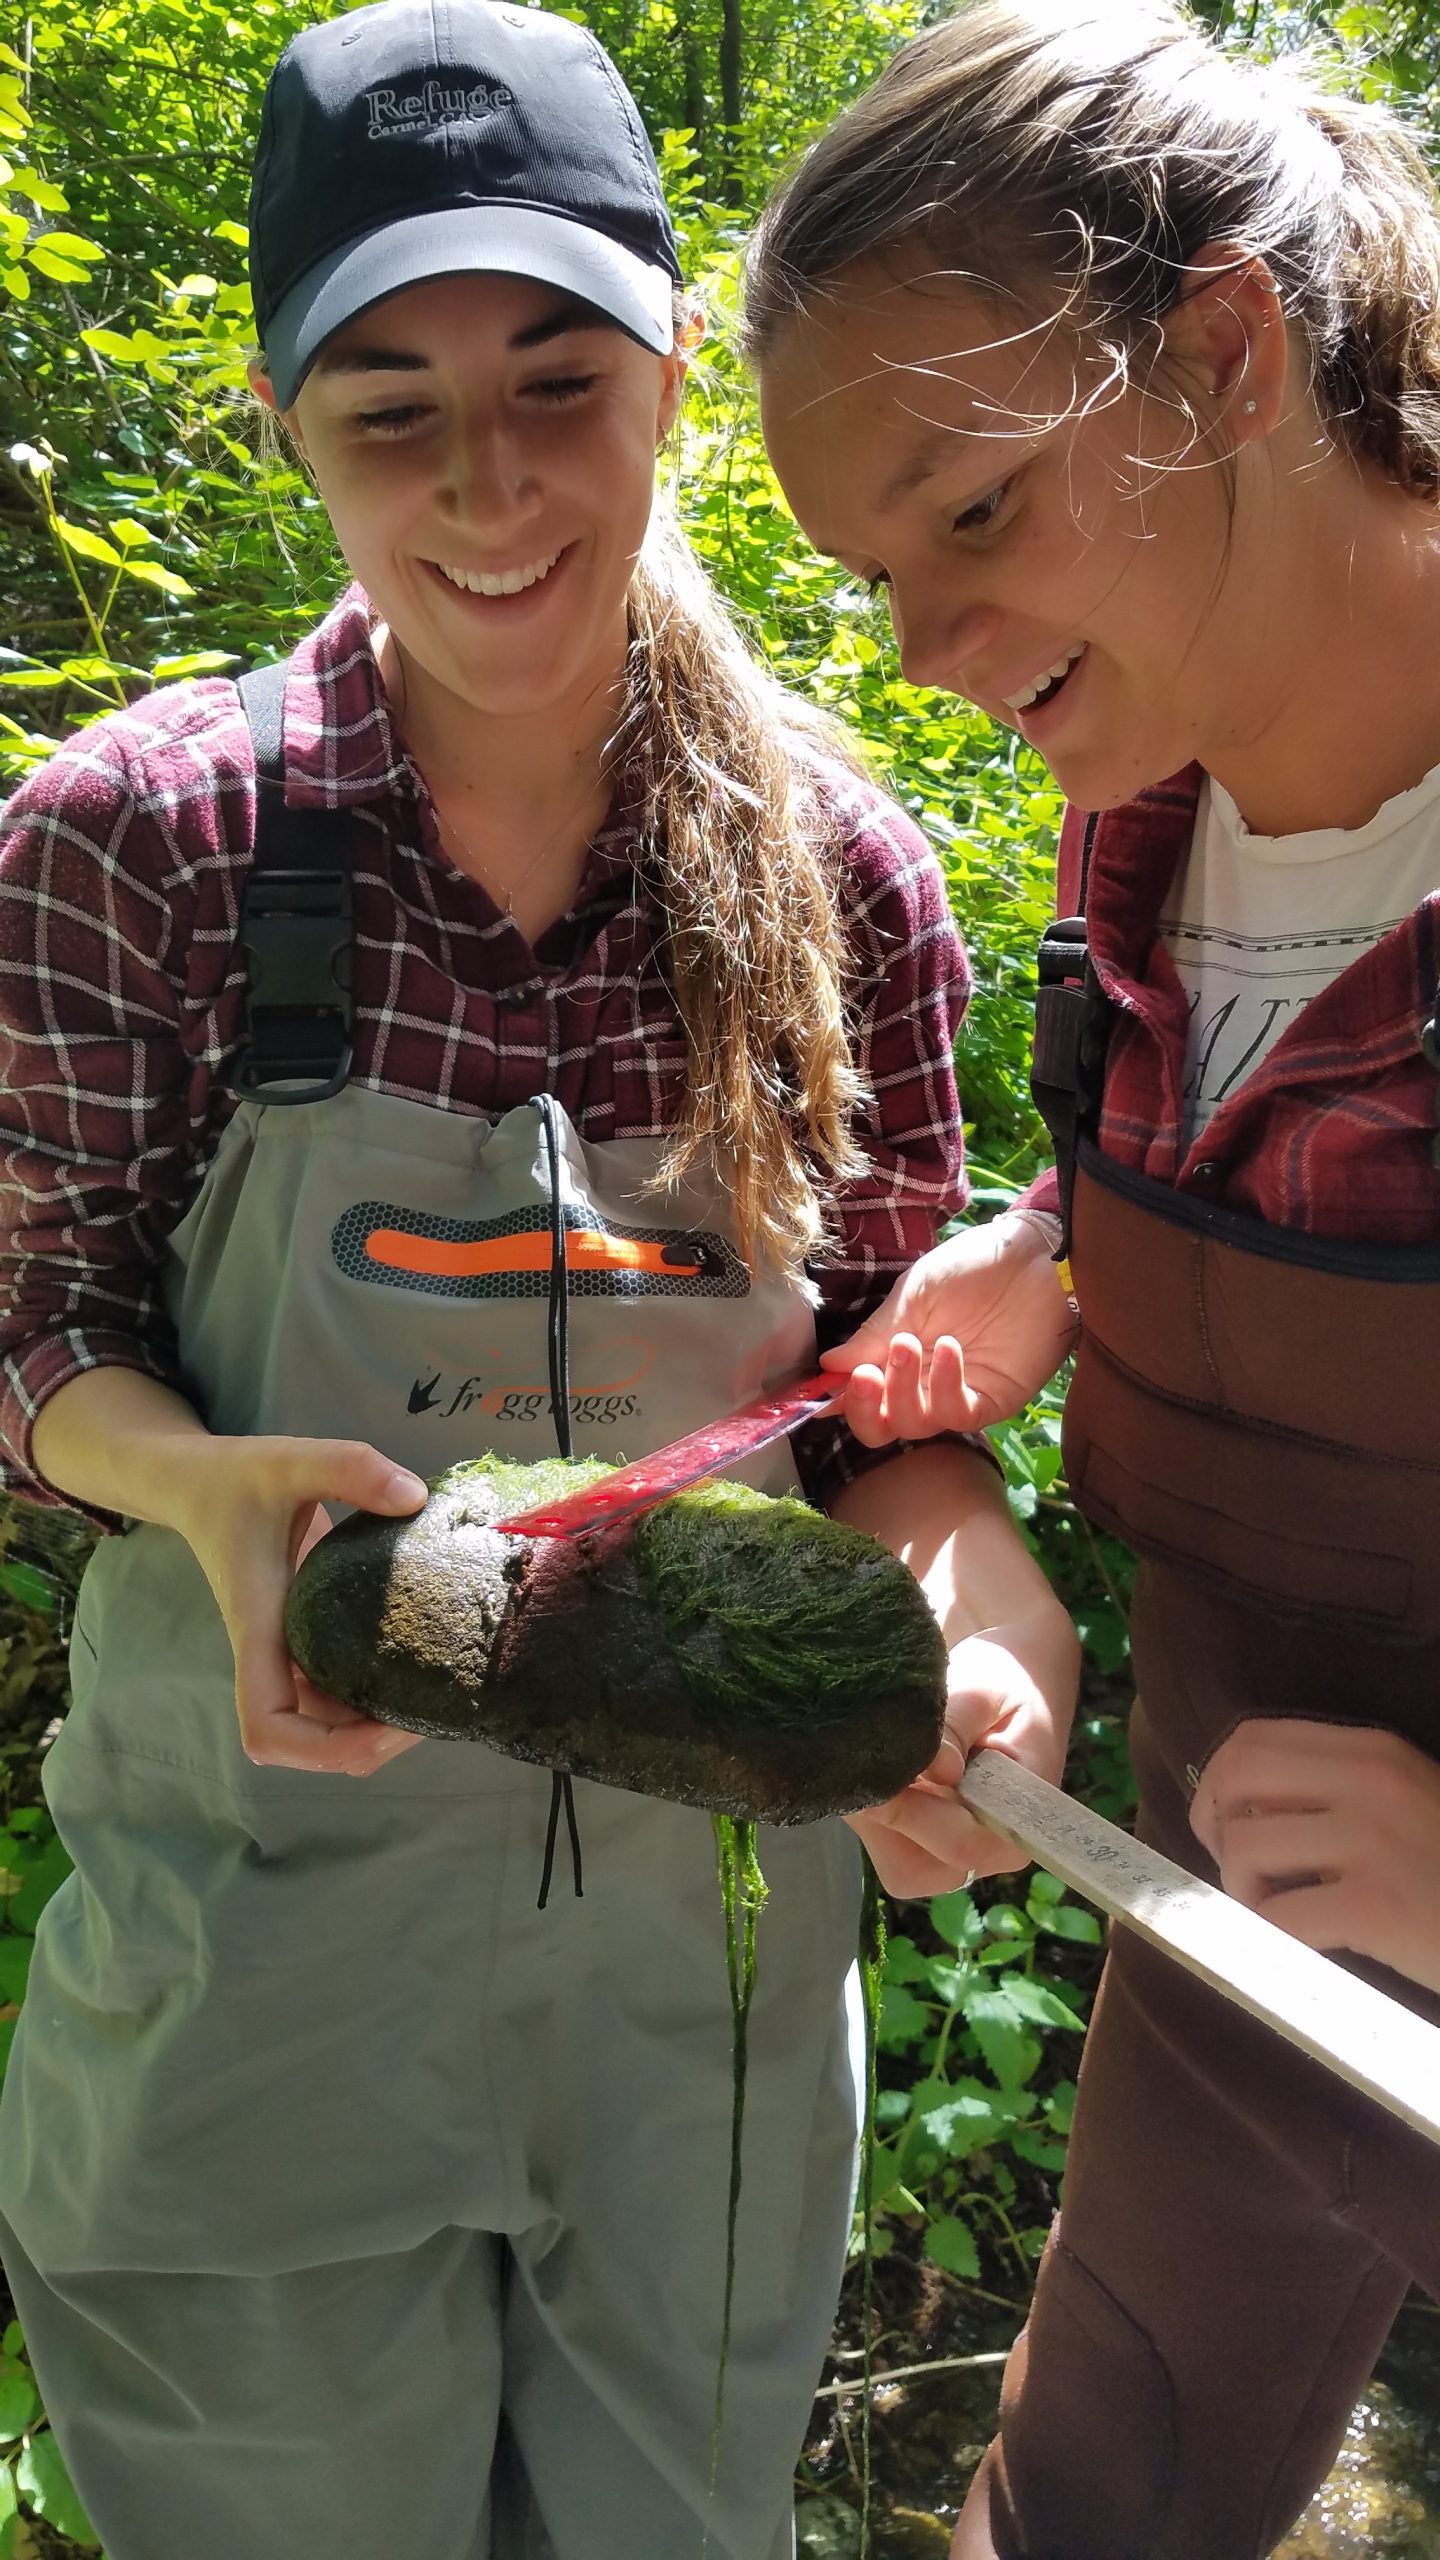
Each spring, staff and volunteers head out to local creeks to collect habitat measurements such as the depth of the water, the size of the rocks in the stream, and the amount of tree cover shading the creek. We also sample for benthic macroinvertebrates (BMIs) in the stream. These are animals that are “benthic” (live on the bottom of the creek), “macro” (visible to the naked eye), and “invertebrate” (lack a backbone). Many BMIs spend the early portion of their lives in the water, then emerge to become organisms such as dragonflies and mayflies. Other common BMIs include snails and worms.
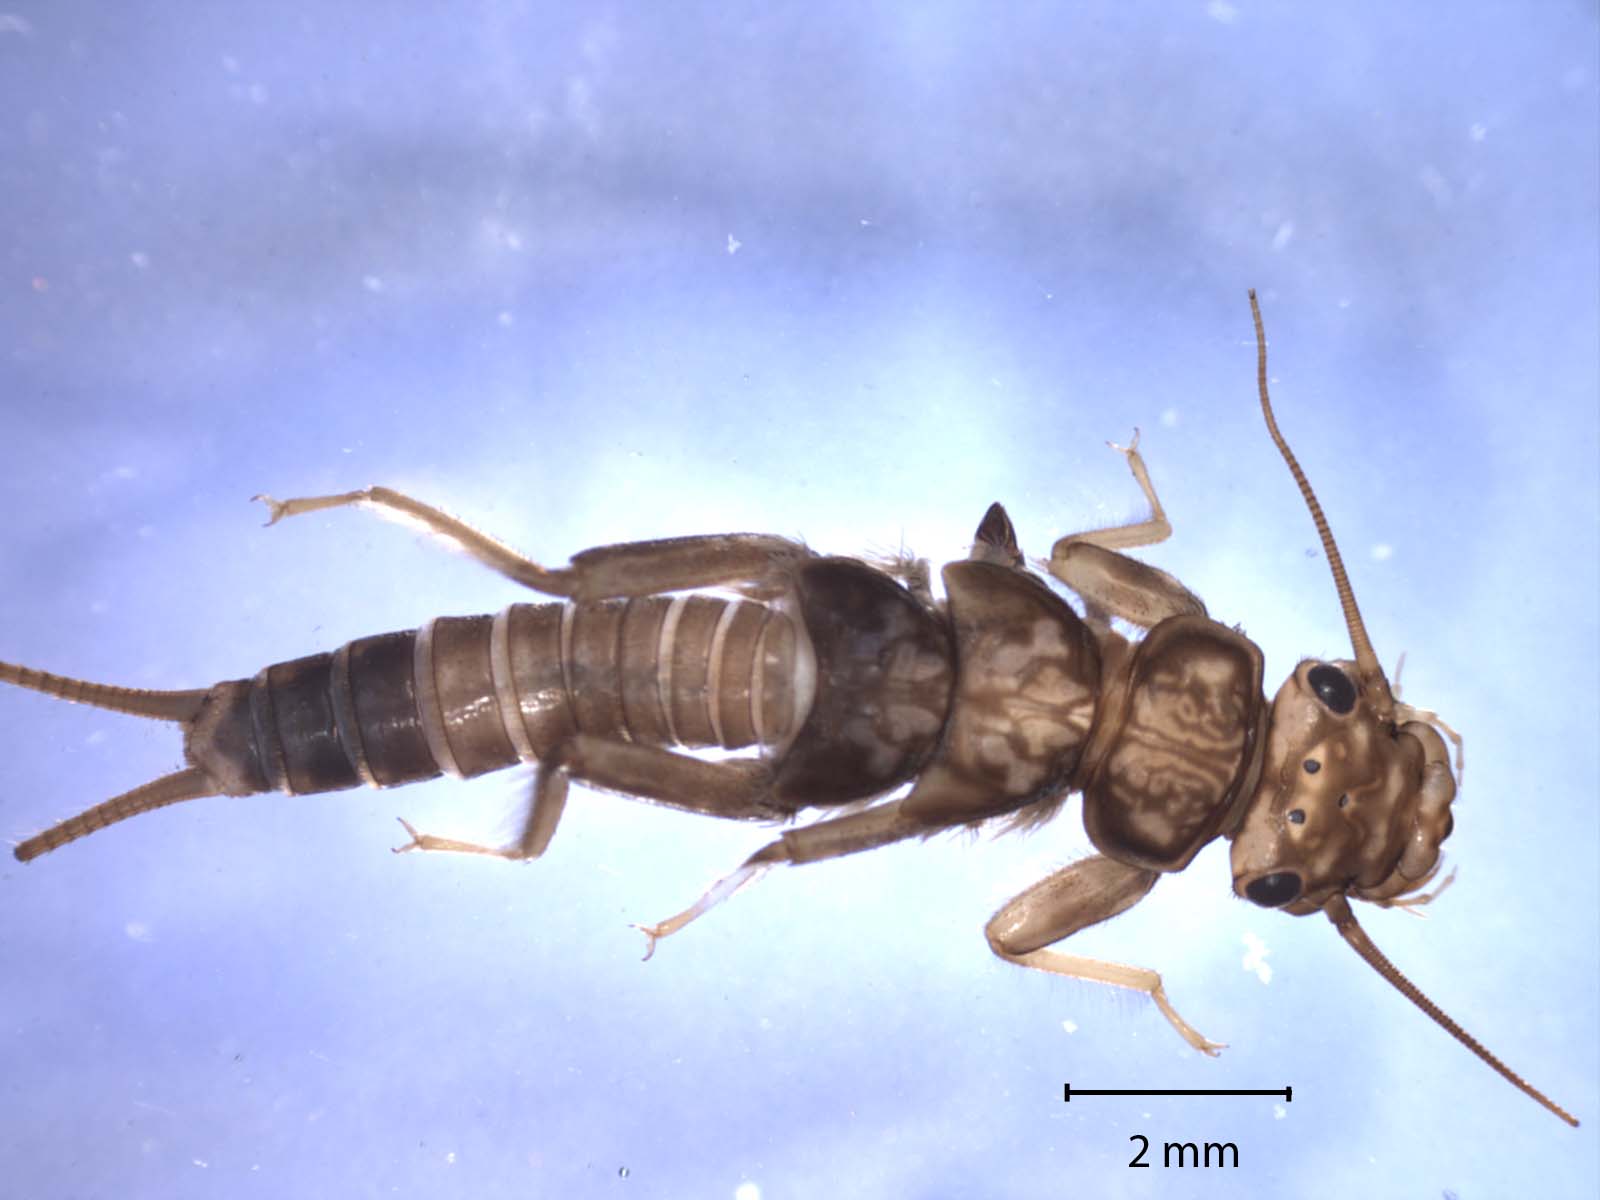
Benthic macroinvertebrates (BMIs) are important bio-indicators
BMIs are bio-indicators, meaning that the types we find give us insight into the health of a creek. Some, such as the stonefly pictured above, are sensitive to pollution. If you find those in the creek, you know that the water quality is likely good. Others, such as leeches, can live in poor water quality conditions. If you only find those in the sample, the water quality is likely poor. BMI samples are sent to a lab for counting and identification. The lab provides scores based on the number of type of BMIs found in the creek.
These BMI serve as food for fish, so a healthy BMI population means the creek is good habitat for fish such as the once-abundant but now threatened steelhead trout (Oncorhynchus mykiss).
2019 bioassessment survey results
In spring 2019, twenty-three volunteers headed out into the field with our staff to conduct ten surveys.
The map below shows the creek health scores for the Morro Bay watershed in 2019. The score we are using is called an Index of Biotic Integrity (IBI). This score was calibrated specifically for our part of the state.
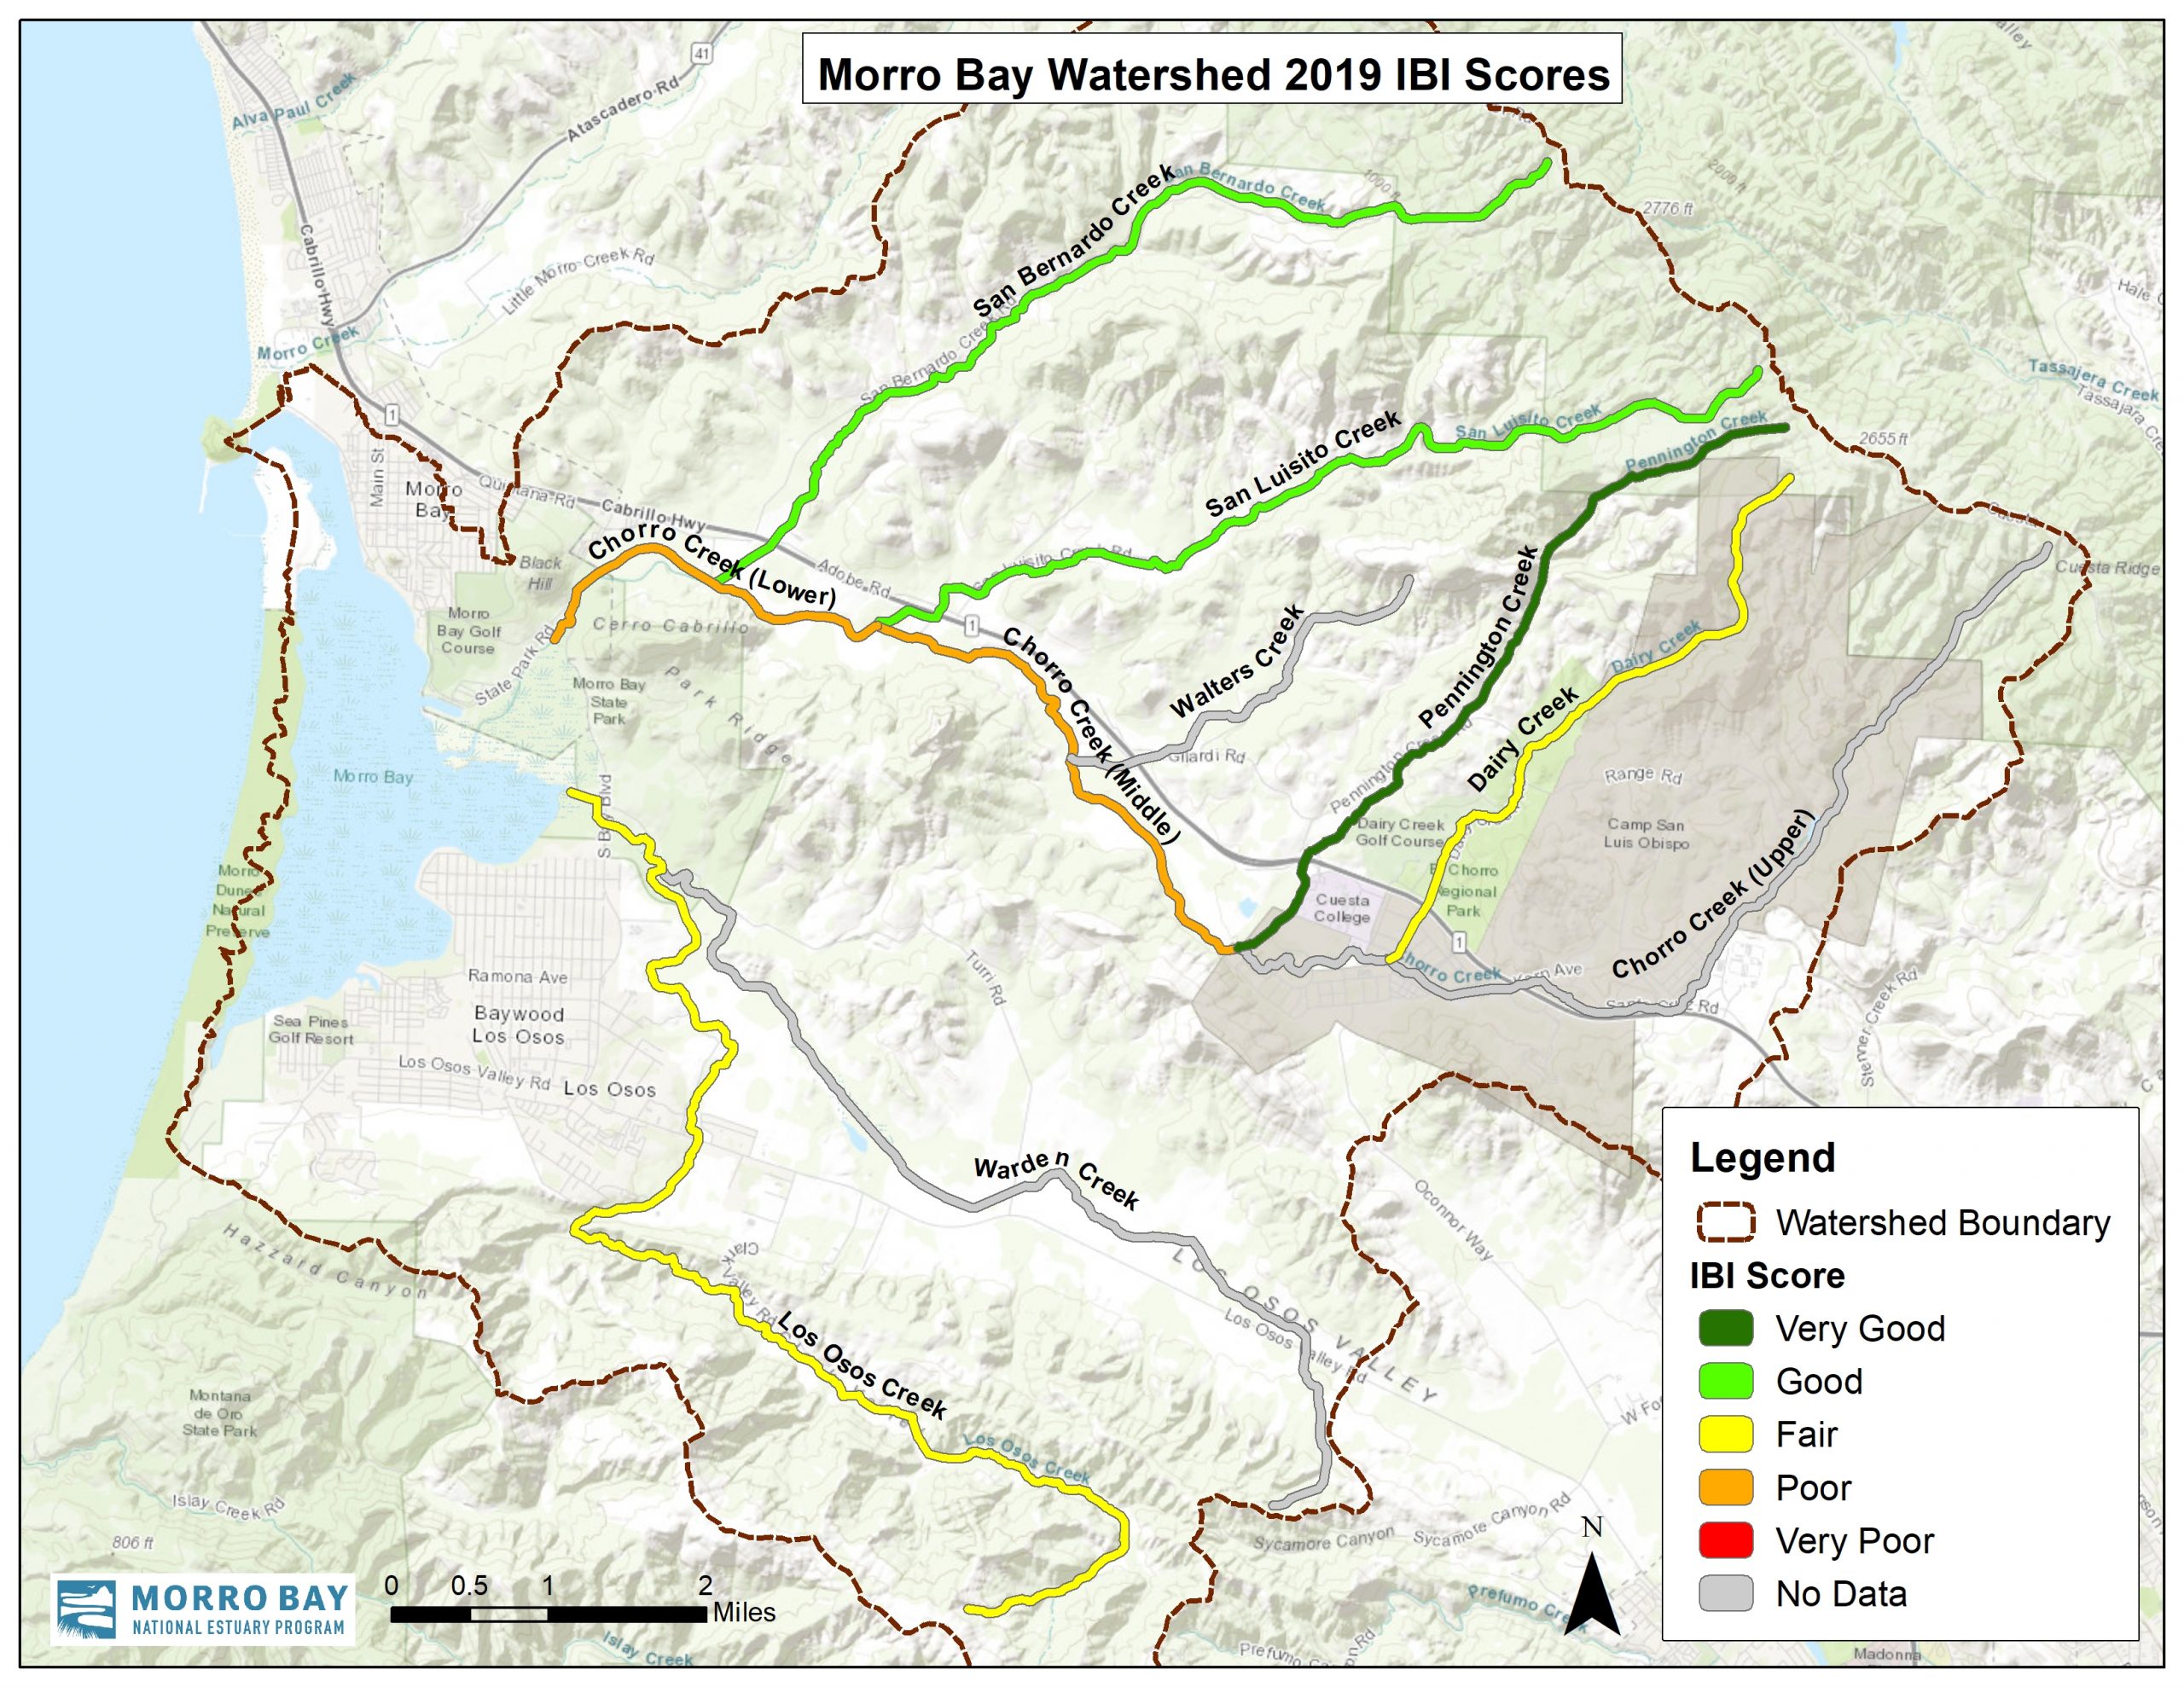
Pennington, San Luisito and San Bernardo Creeks consistently have some of the best scores in the watershed. These creeks have cold, clear, well-oxygenated water, with minimal nutrient and sediment pollution.
Dairy Creek and sites on Los Osos Creek do not always have enough water year-round to conduct these surveys. Though the scores were in the “Fair” category in 2019, the fact that they still had adequate stream flows for monitoring is an improvement over past years. These sites have good water quality and good substrate. With enough years of consistent flow, they would likely see improvement in scores. The 2019 scores for Middle and Lower Chorro Creek show the impacts of less-than-ideal water quality (elevated water temperature and nutrients) and habitat that does not always support the most sensitive BMIs.
How the 2019 scores compare to average scores
How do the 2019 bioassessment survey results compare to previous years? In the following map, the color of the creek segments indicate the 2019 score and the dot next to the segment indicates the average of historic data.
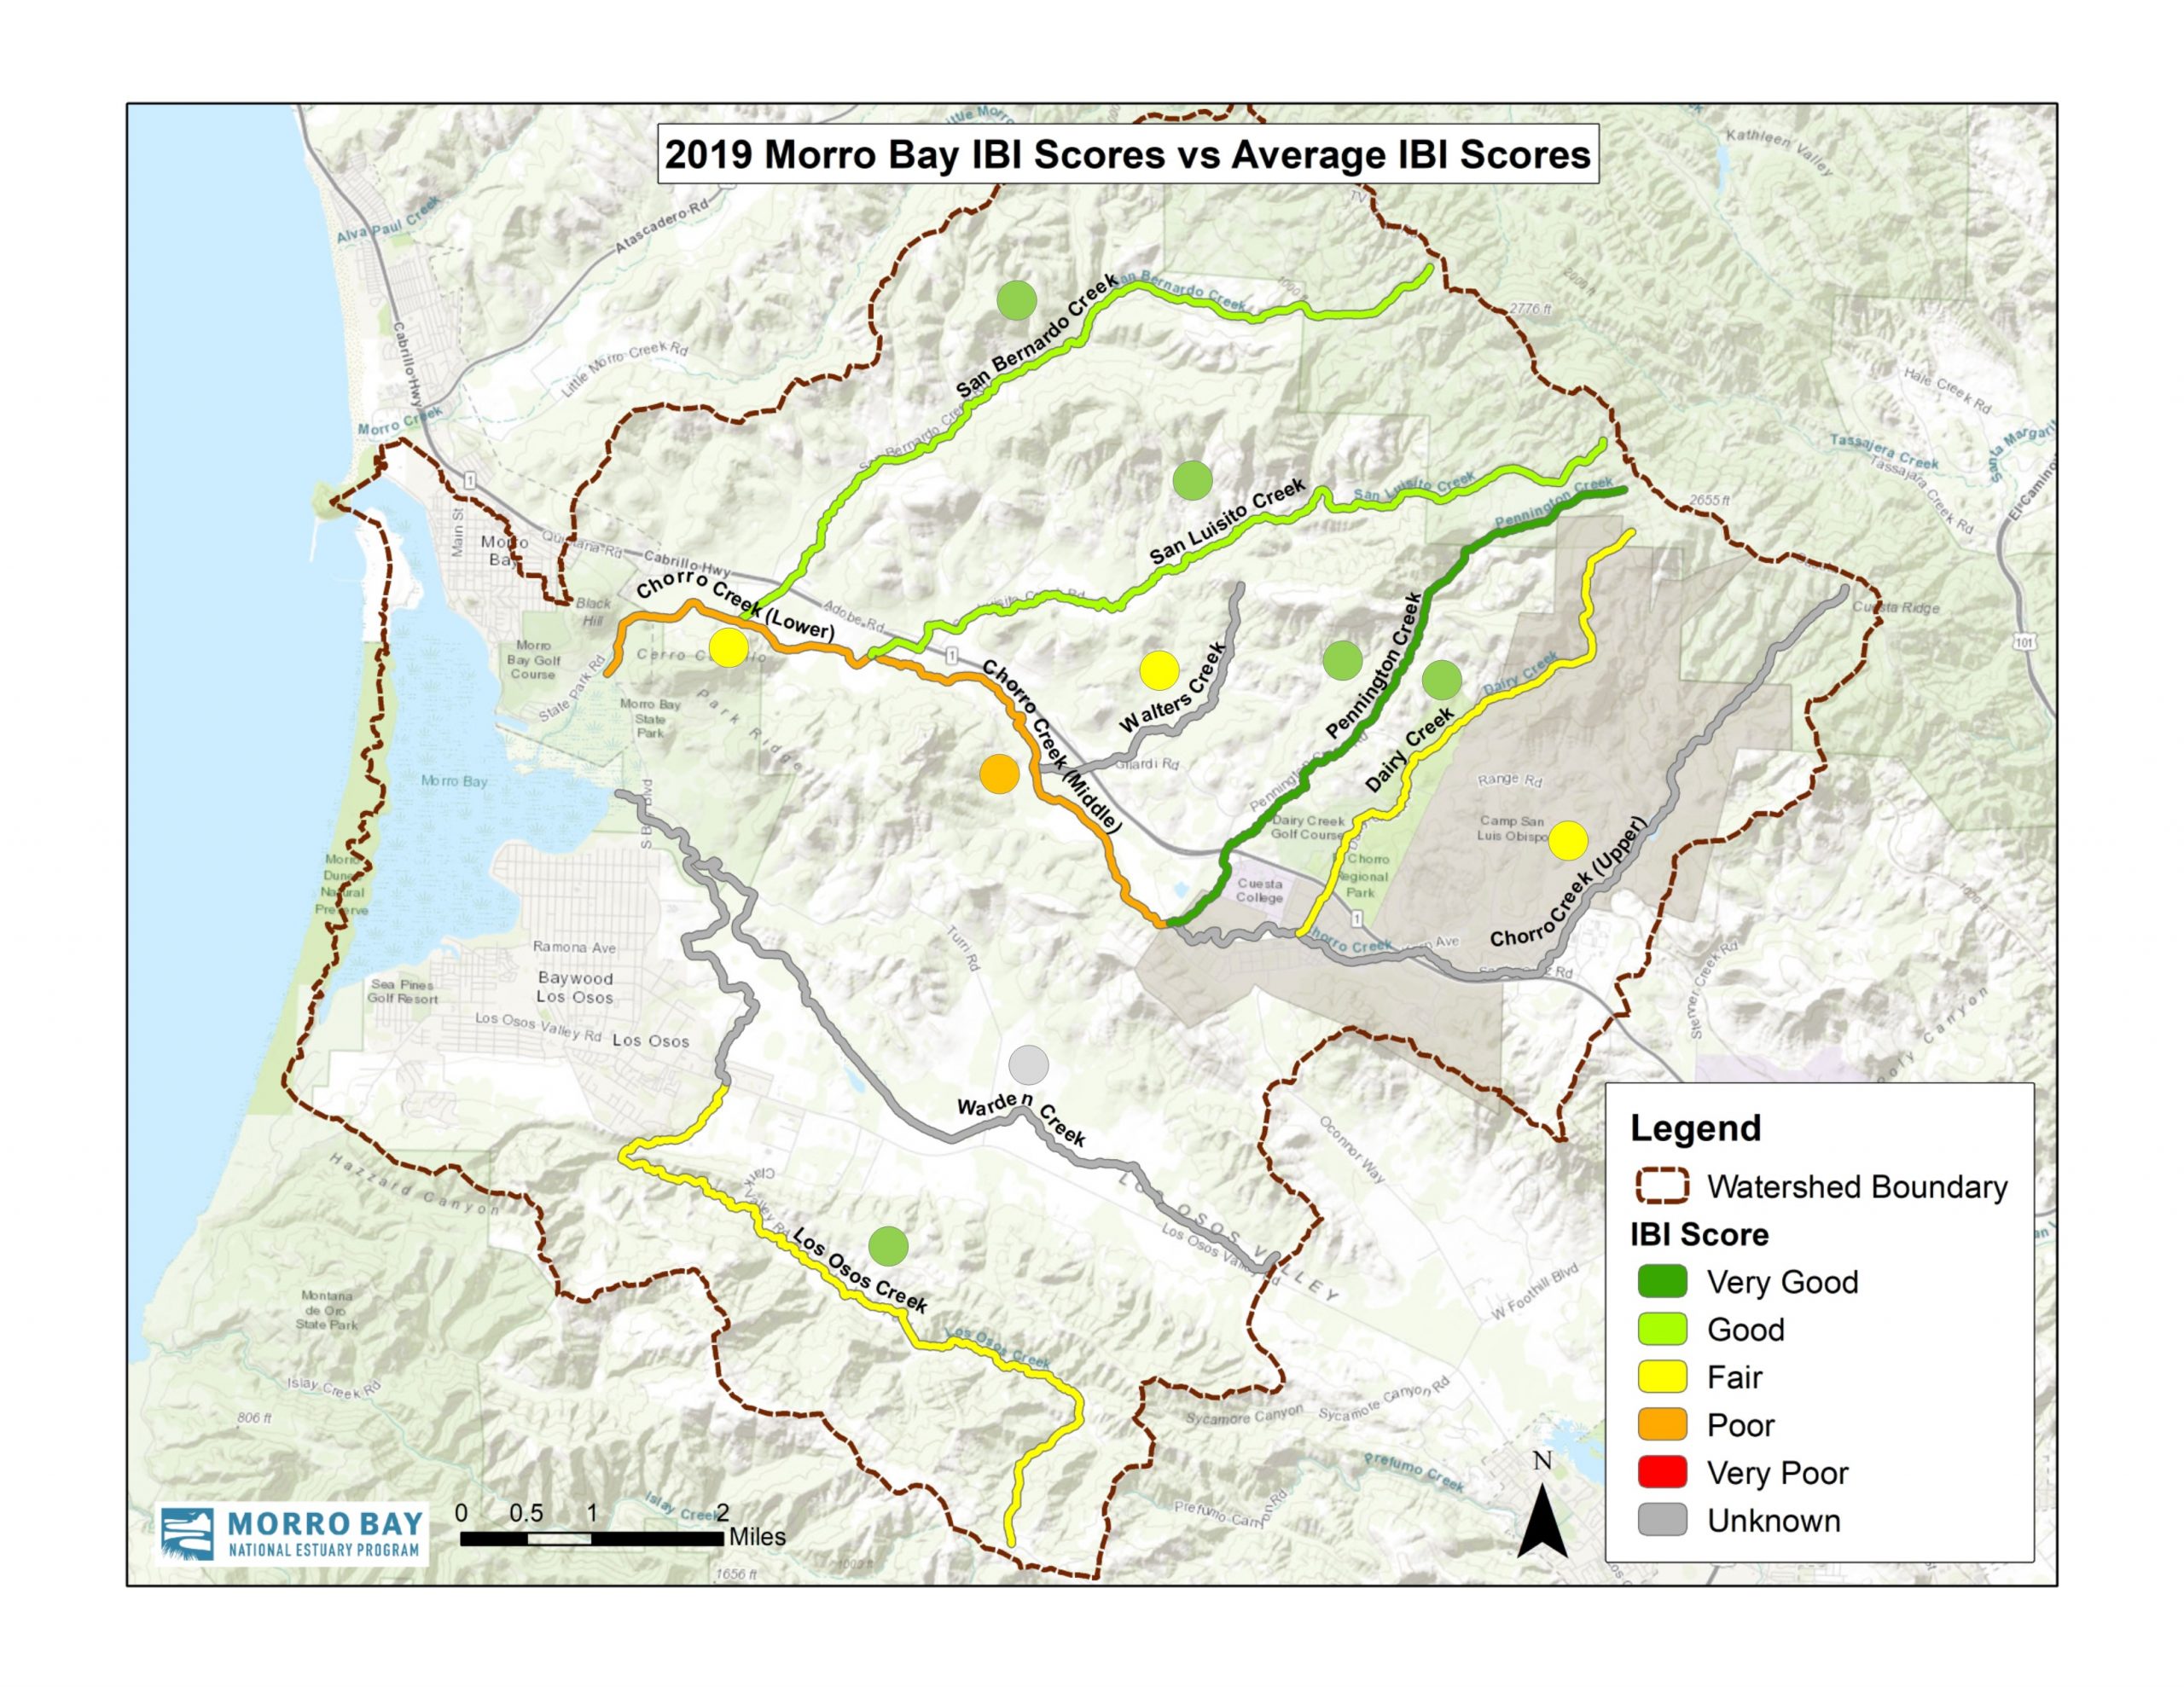
In 2019, we saw a slight decline from previous years on Lower Chorro and Dairy Creeks, although scores were similar to what we’ve seen in the past. Since 2011, individual scores have tended to be lower than average, which is thought to be due to California’s persistent drought. Though rainfall totals were higher in 2017 and 2019, scores were still on the low side, likely due to lasting impacts of the drought. Unseasonably high flows from unexpected storms in late spring can also reduce scores.
Recognizing the Contribution of the Miossi Trust
The Estuary Program has been fortunate in the long-time support of a strong partner in this monitoring effort. The Harold J. Miossi Charitable Trust first awarded a grant to the Estuary Program in 2013 to support bioassessment monitoring. To date, the Trust has helped fund seven seasons of the monitoring with a total contribution of $72,150.
Part of the value of this high quality data set is that it is long-running and collected in a consistent way. The results are loaded to the state’s online data portal so that it is available to all for research, education, and assessment. We thank the Miossi Trust for their crucial support that makes this valuable monitoring possible.
Works Cited
Harrington, J. and M. Born. 2000. Measuring the Health of California Streams and River: A Methods Manual for Water Resource Professionals, Citizen Monitors and Natural Resource Students. Sustainable Lands Stewardship International Institute. Sacramento, CA.
Subscribe to our weekly blog to have posts like this delivered to your inbox each week.
Help us protect and restore the Morro Bay estuary!
- Donate to the Estuary Program today and support our work in the field, the lab, and beyond.
The Estuary Program is a 501(c)3 nonprofit. We depend on funding from grants and generous donors to continue our work. - Support us by purchasing estuary-themed gear from ESTERO. This locally owned and operated company donates 20% of proceeds from its Estuary clothing line and 100% of Estuary decal proceeds to the Estuary Program. Thank you, ESTERO!
- Purchase items from the the Estuary Program’s store on Zazzle. Zazzle prints and ships your items, and the Estuary Program receives 10% of the proceeds. Choose from mugs, hats, t-shirts, and even fanny packs (they’re back!) with our fun Estuary Octopus design, our classic Estuary Program logo, or our Mutts for the Bay logo.