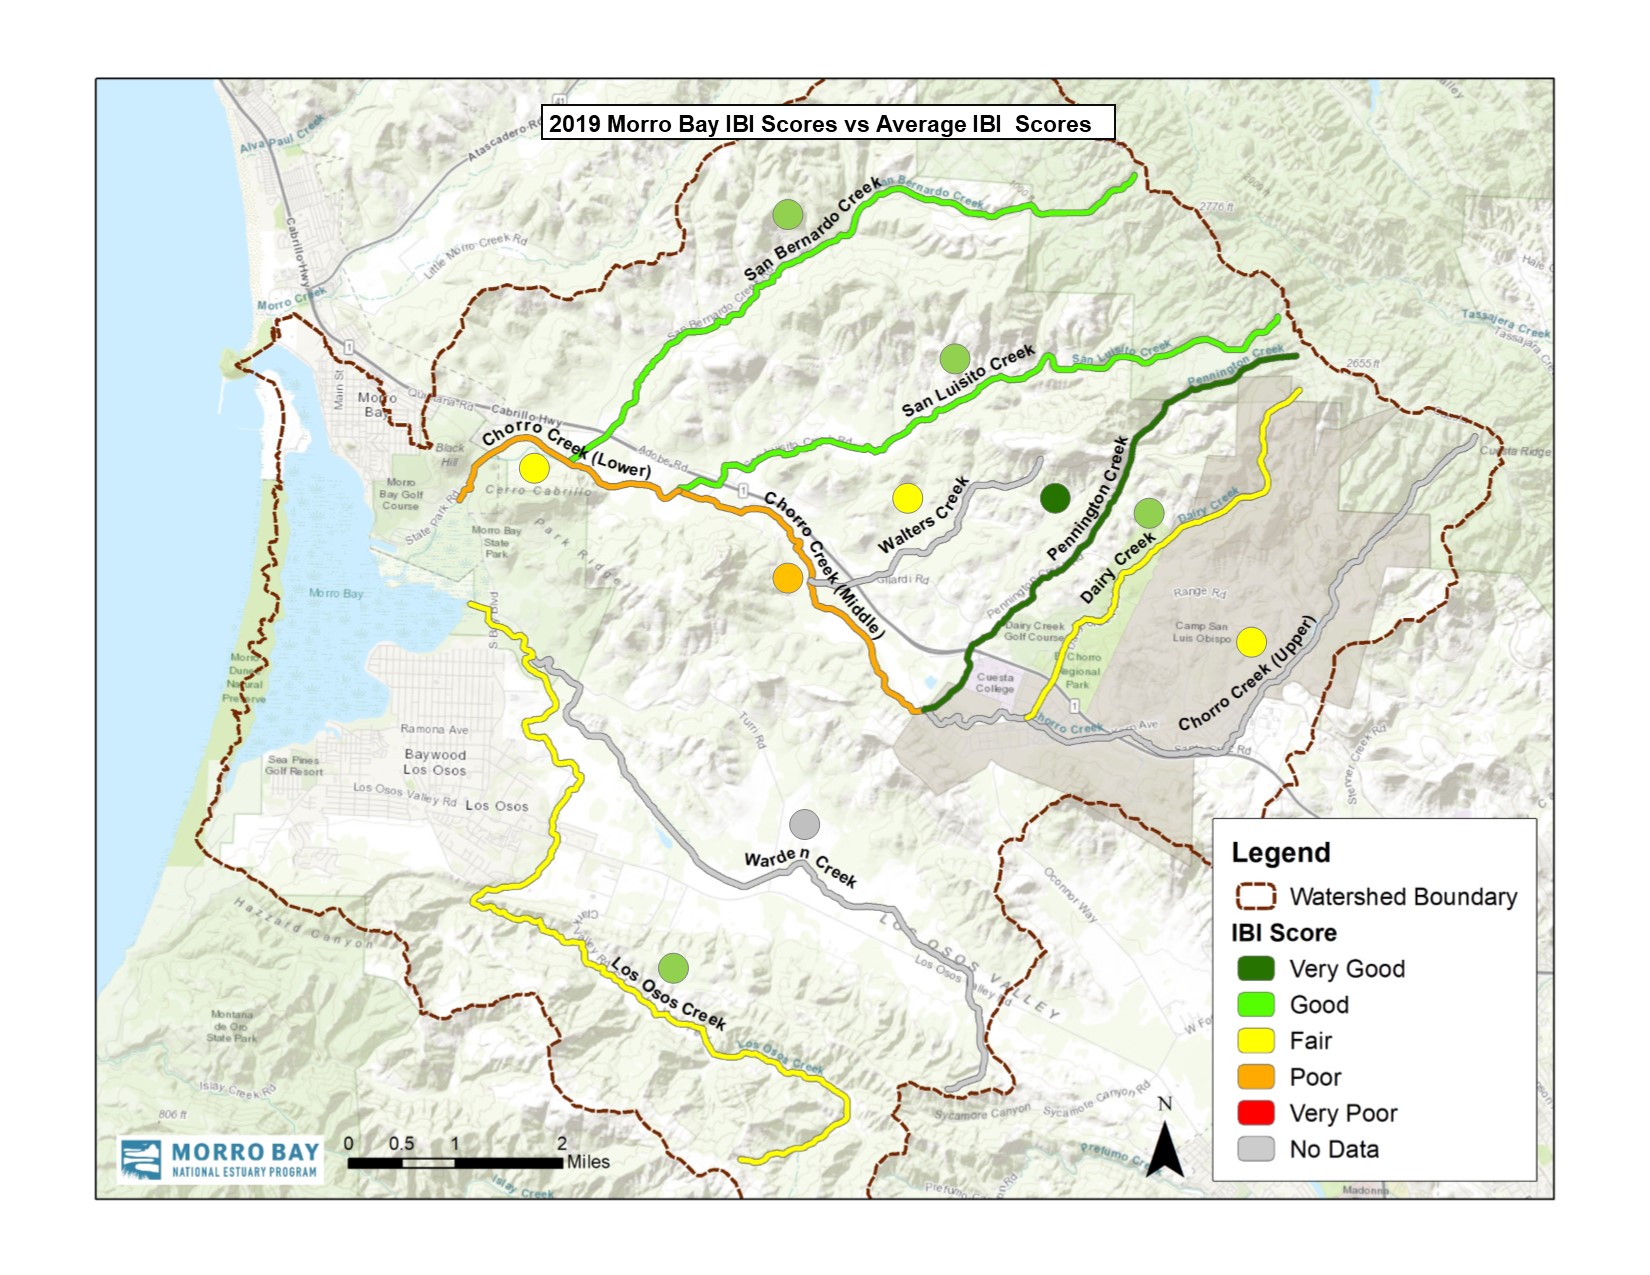
This map shows the average IBI Scores for each stretch of creek between 1994 and 2019 as a colored dot. The length of each creek stretch is colored with the 2019 scores. The scores are as follows. Los osos Creek average=Good, 2019=Fair. Chorro Creek mainstem average=Fair, 2019=Poor. Upper Chorro Creek average=Fair, 2019=Insufficient Data.Dairy Creek average=Good, 2019=Fair. Pennington Creek average=Very good, 2019=Very Good. Walters Creek average=fair, 2019=Insufficient Data. San Luisito average=Good, 2019=Good. San Bernardo Creek average=Good, 2019=Good.