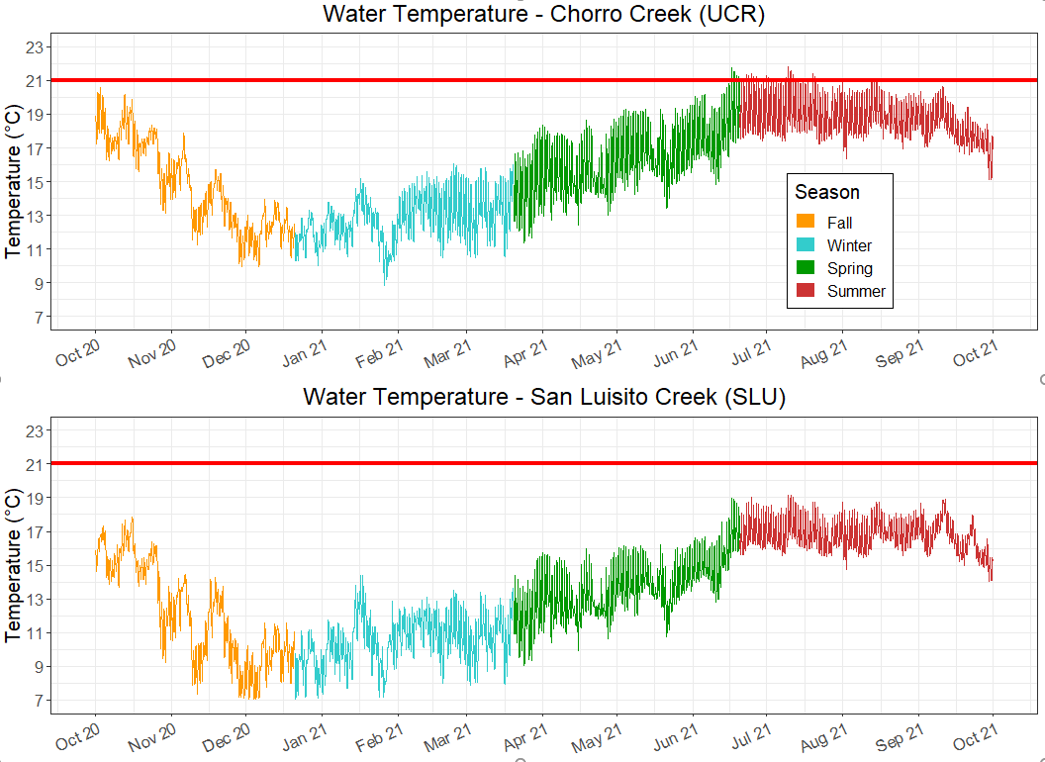
Two figures displaying water temperature from October 1, 2020 to September 30, 2021, color coded by season. The top figure displays data from a site along the mainstem of Chorro Creek and the bottom figure displays data from San Luisito Creek, a tributary that flows into Chorro Creek. The horizontal red line highlights the 21°C threshold that is protective of steelhead. Ideally the water temperatures remain below this threshold year-round.