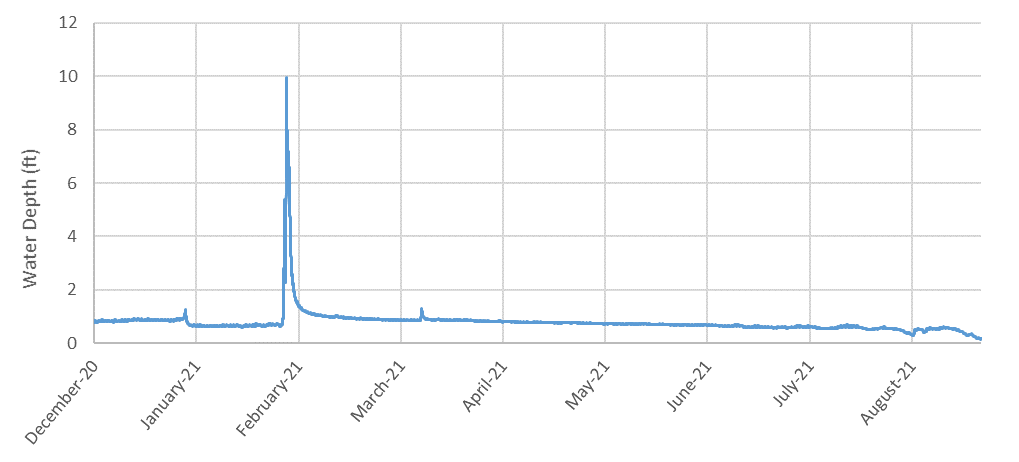
This graph shows an example of continuous water depth data from a pressure transducer. The blue line indicates the depth of water in the creek over time, and the steep increase on this graph indicates how water levels increased rapidly due to rainfall during a storm.