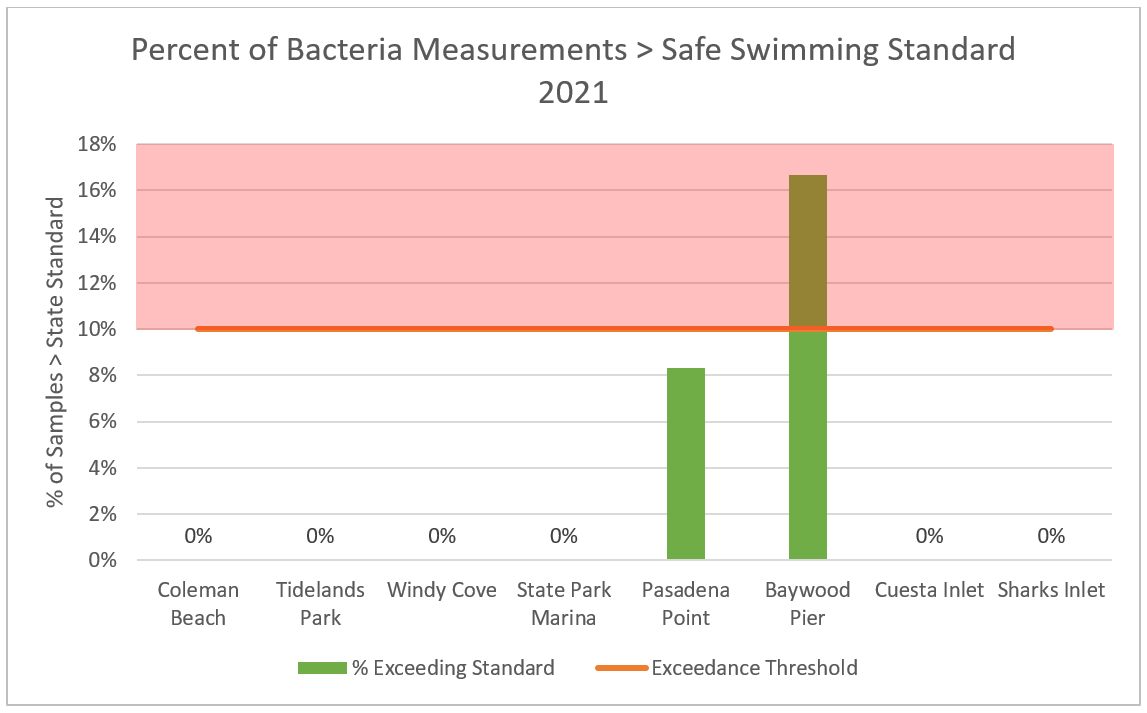
This figure displays the percentage of samples exceeding the safe swimming level during Water Year 2021 (October 2020 to September 2021). Six of the sites had no issues meeting safe swimming levels at the times we tested. Pasadena Point had unsafe bacteria levels in 8% of samples, which meets the water quality standards since ideally no more than 10% of samples are elevated. Baywood Pier had unsafe levels in over 16% of its samples, which exceeds the 10% target.