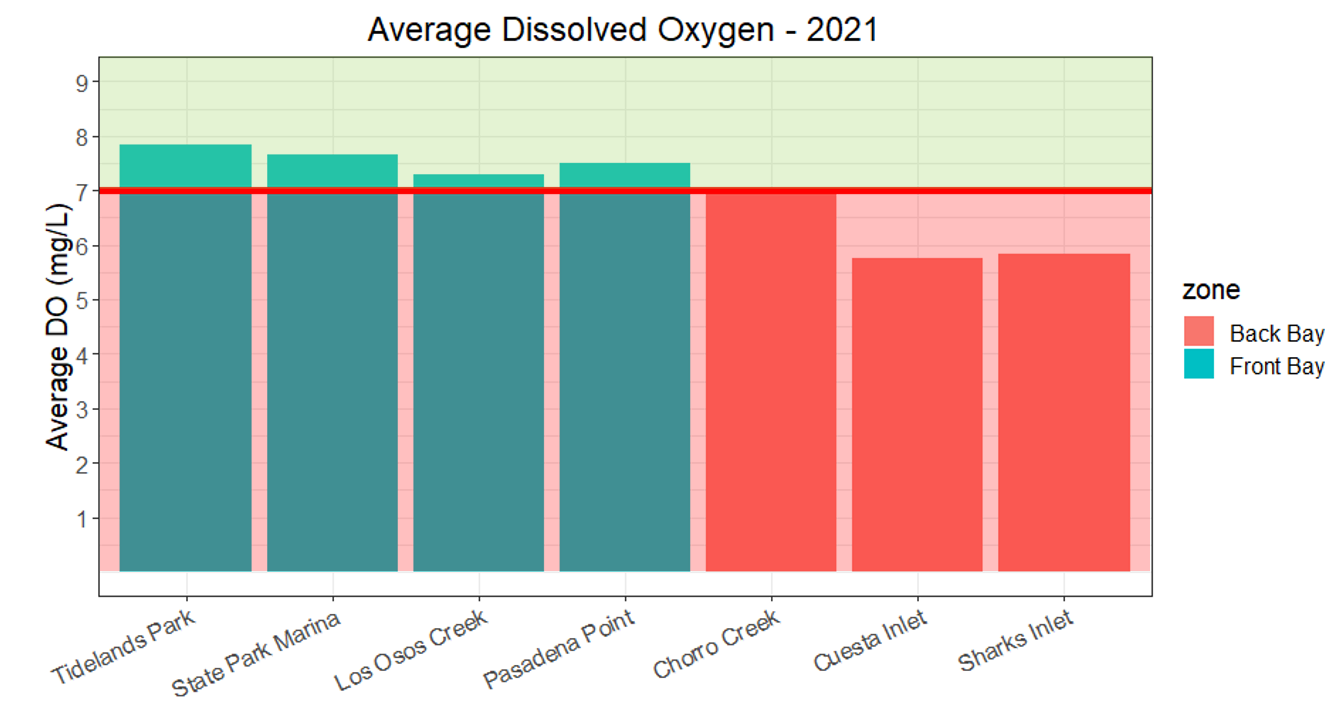
Figure displaying average Dissolved Oxygen concentration for each sampling site. Blue bars represent Front Bay sites and red bars represent Back Bay sites. Bars that extend above the red line indicate healthy levels of Dissolved Oxygen. The Front Bay sites typically have adequate oxygen levels to support sensitive aquatic life, while the Back Bay often has lower-than-desirable oxygen levels