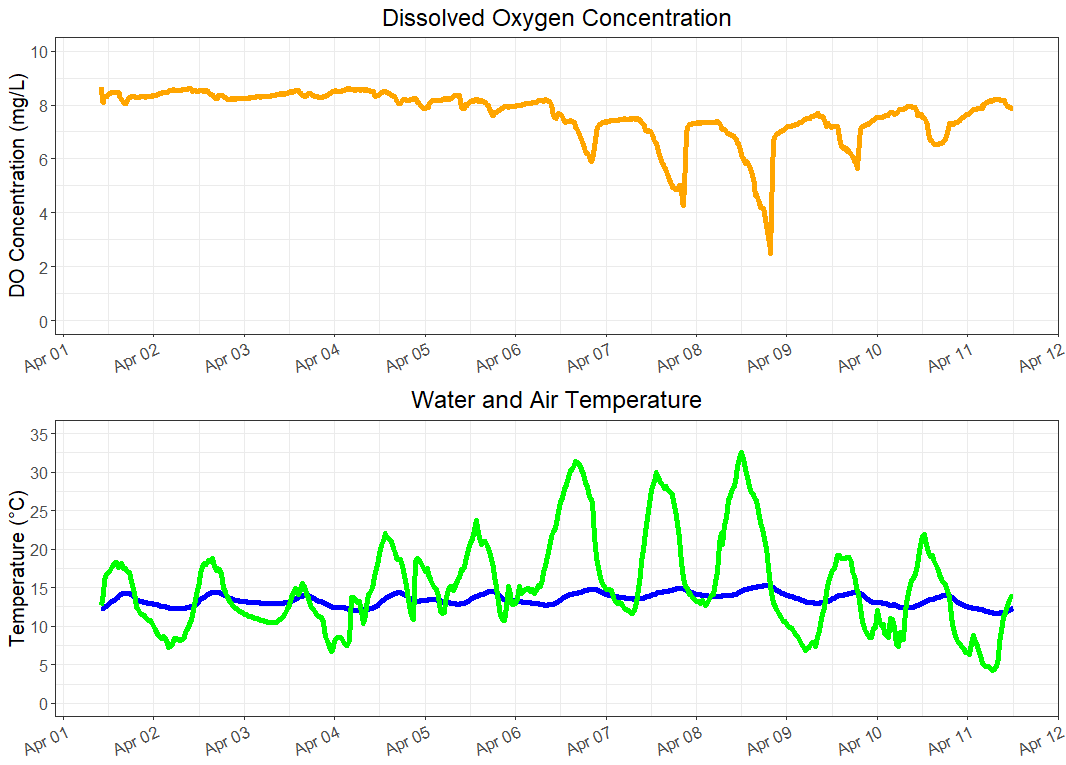
These figures display dissolved oxygen level (top, orange), water temperature (bottom, blue), and air temperature (bottom, green), over the course of an EXO3 sonde deployment at Dairy Creek in April.
These figures display dissolved oxygen level (top, orange), water temperature (bottom, blue), and air temperature (bottom, green), over the course of an EXO3 sonde deployment at Dairy Creek in April.
These figures display dissolved oxygen level (top, orange), water temperature (bottom, blue), and air temperature (bottom, green), over the course of an EXO3 sonde deployment at Dairy Creek in April.