The Estuary Program strives to monitor and understand the health of our estuary and the lands that surround it. To meet this goal, staff and volunteers venture out to collect various data on water quality parameters like temperature, oxygen and salinity levels, water depth, and how fast the water is flowing. This information helps us track conditions in the creeks and bay and see how they change over time.
Continuous monitoring equipment lets us connect the dots
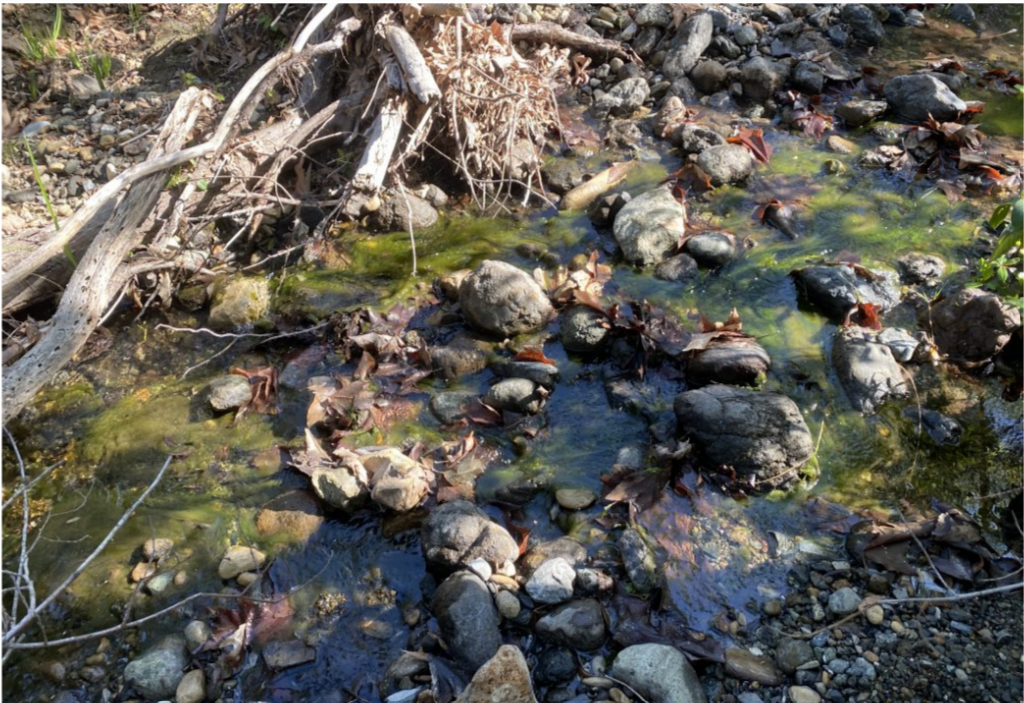
“If a tree falls in the forest and no one is around to hear it, does it make a sound?” While this thought experiment has many answers, it addresses an important point that is directly applicable to water quality monitoring. Creek systems are constantly changing. Higher, swifter water flows can scour out deep pools, create gravel bars, or deposit woody debris in new places. When the water levels go down or vegetation is removed, stretches of the creek can become shallow and warm, or thick mats of algae can grow. All of these changes alter the habitats available for fish, frogs, macroinvertebrates, and other aquatic lifeforms, and the creeks don’t wait for people to arrive before making these changes.
Monthly data collection versus continuous data collection
With monthly site visits, it’s possible for staff and volunteers to record the major changes that have occurred since their last visit, but many of the smaller changes, like daily temperature fluctuations for example, would go unnoted.
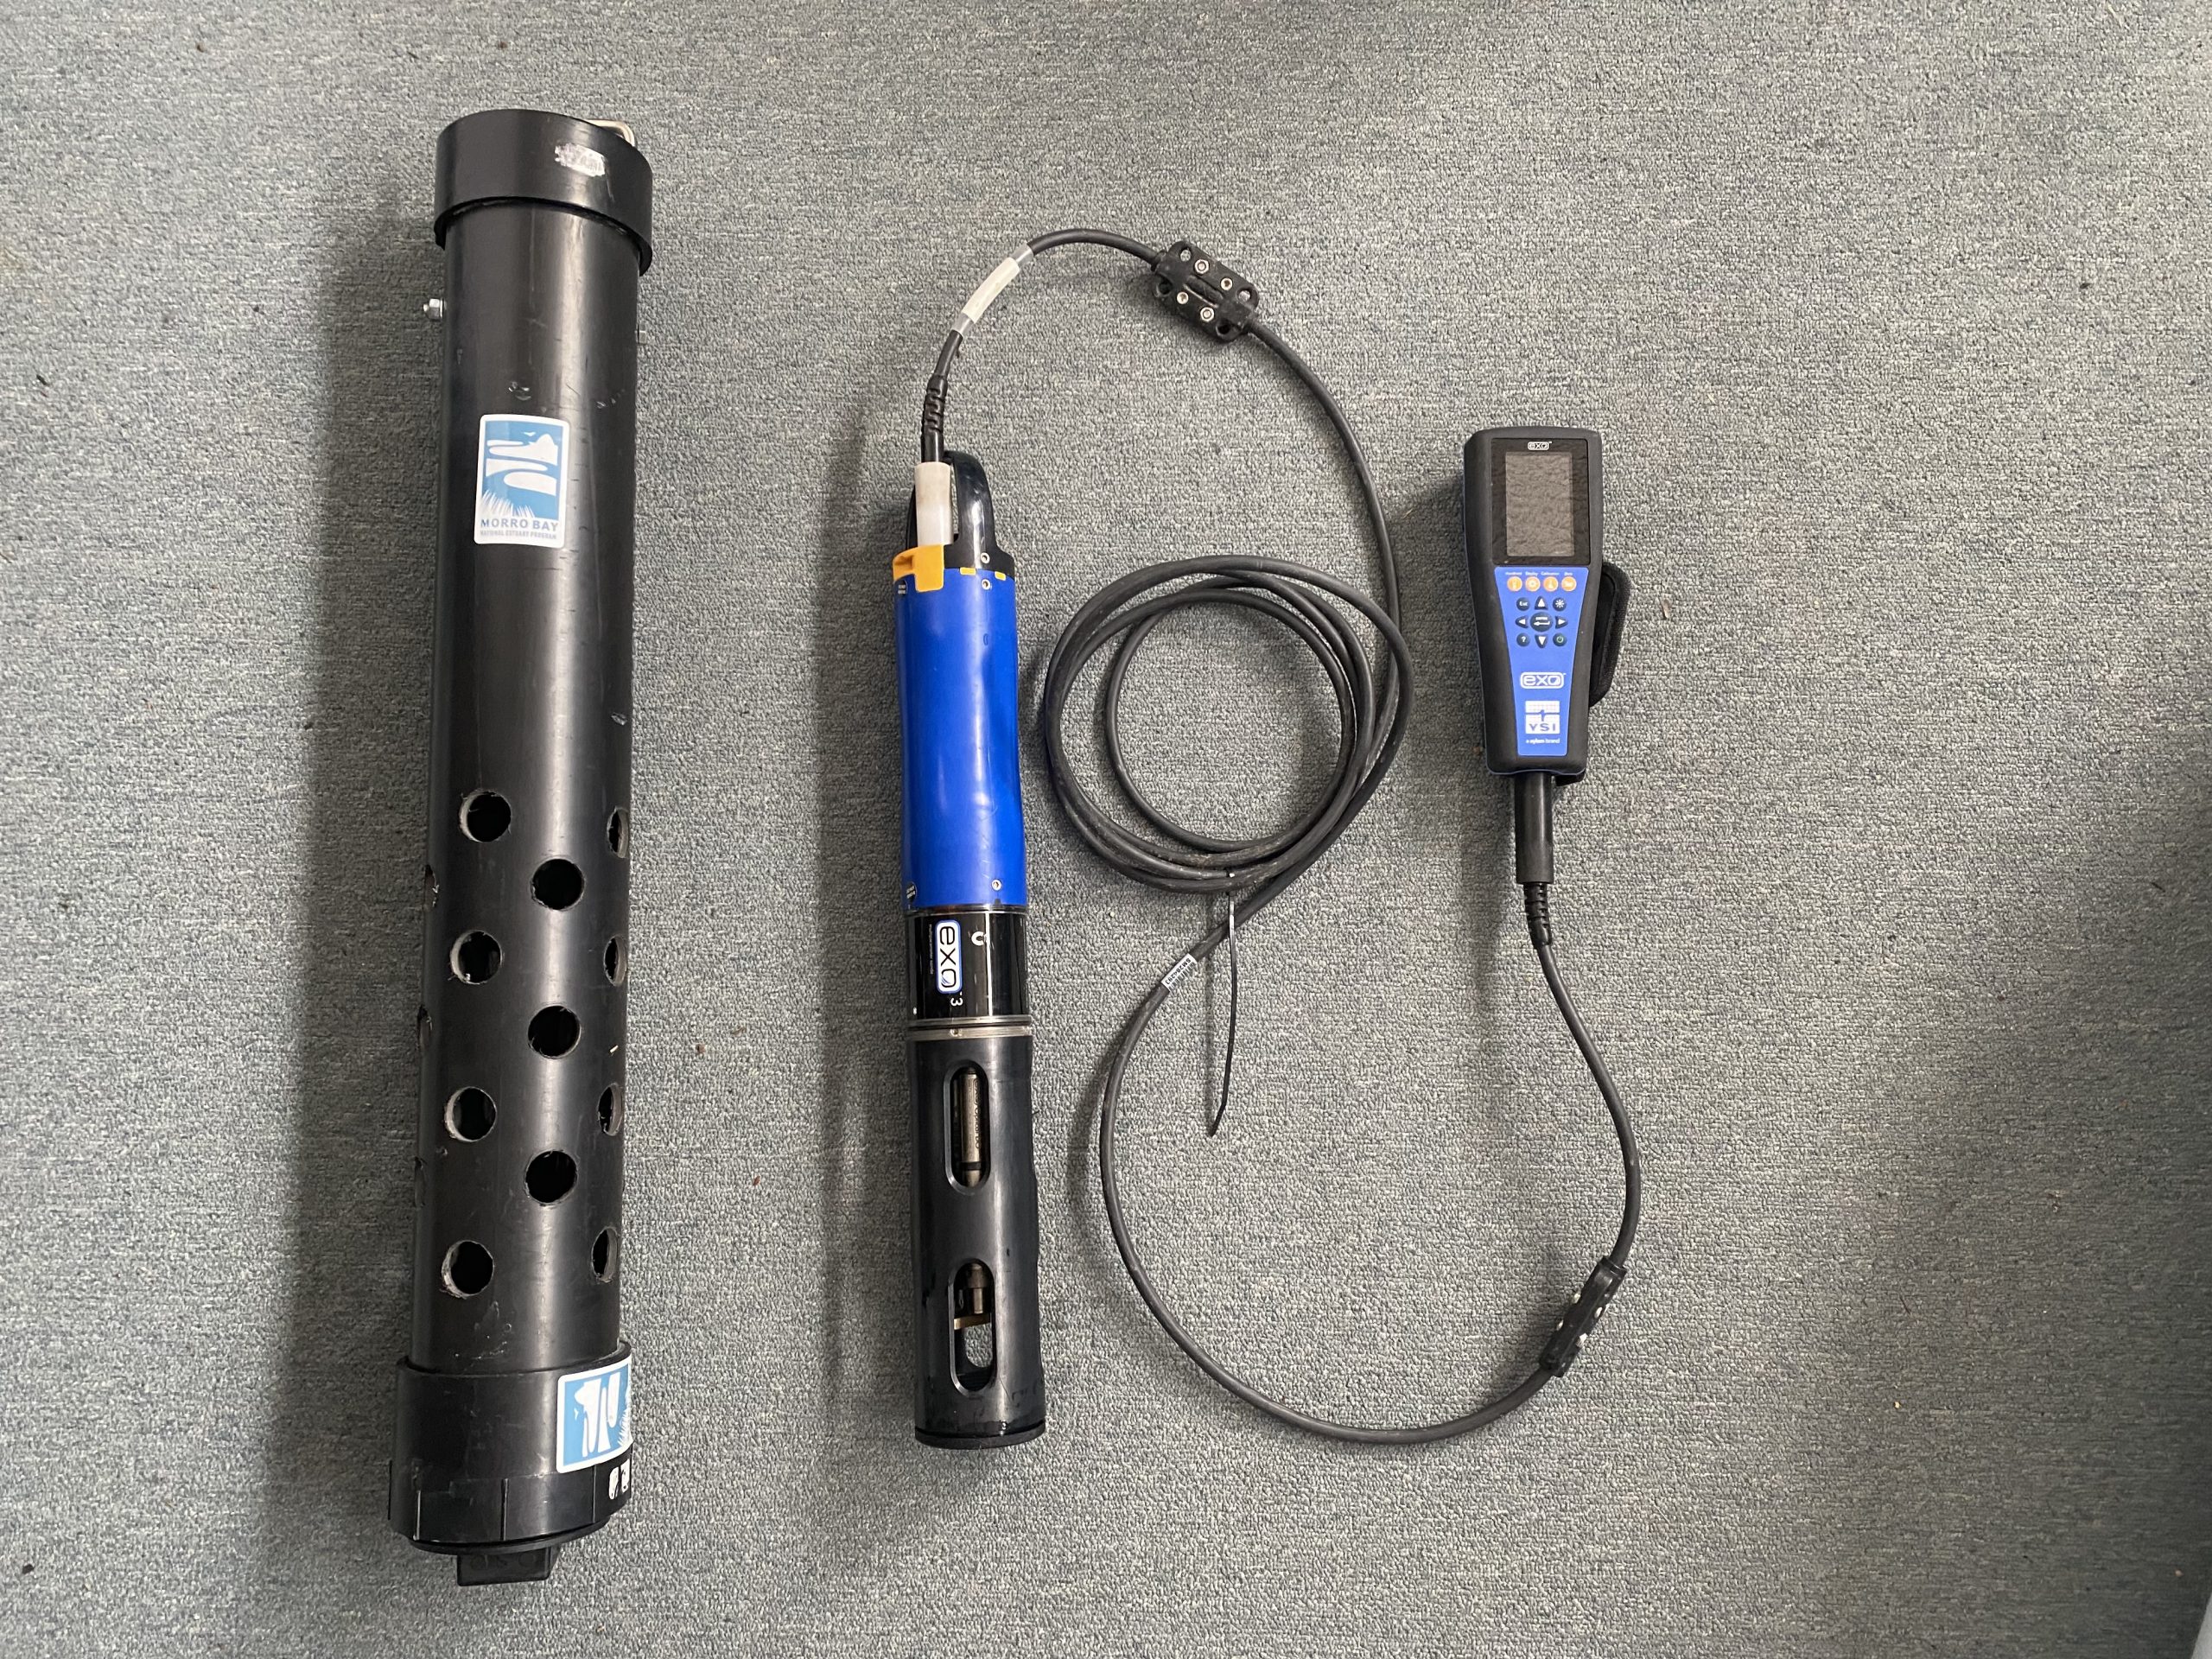
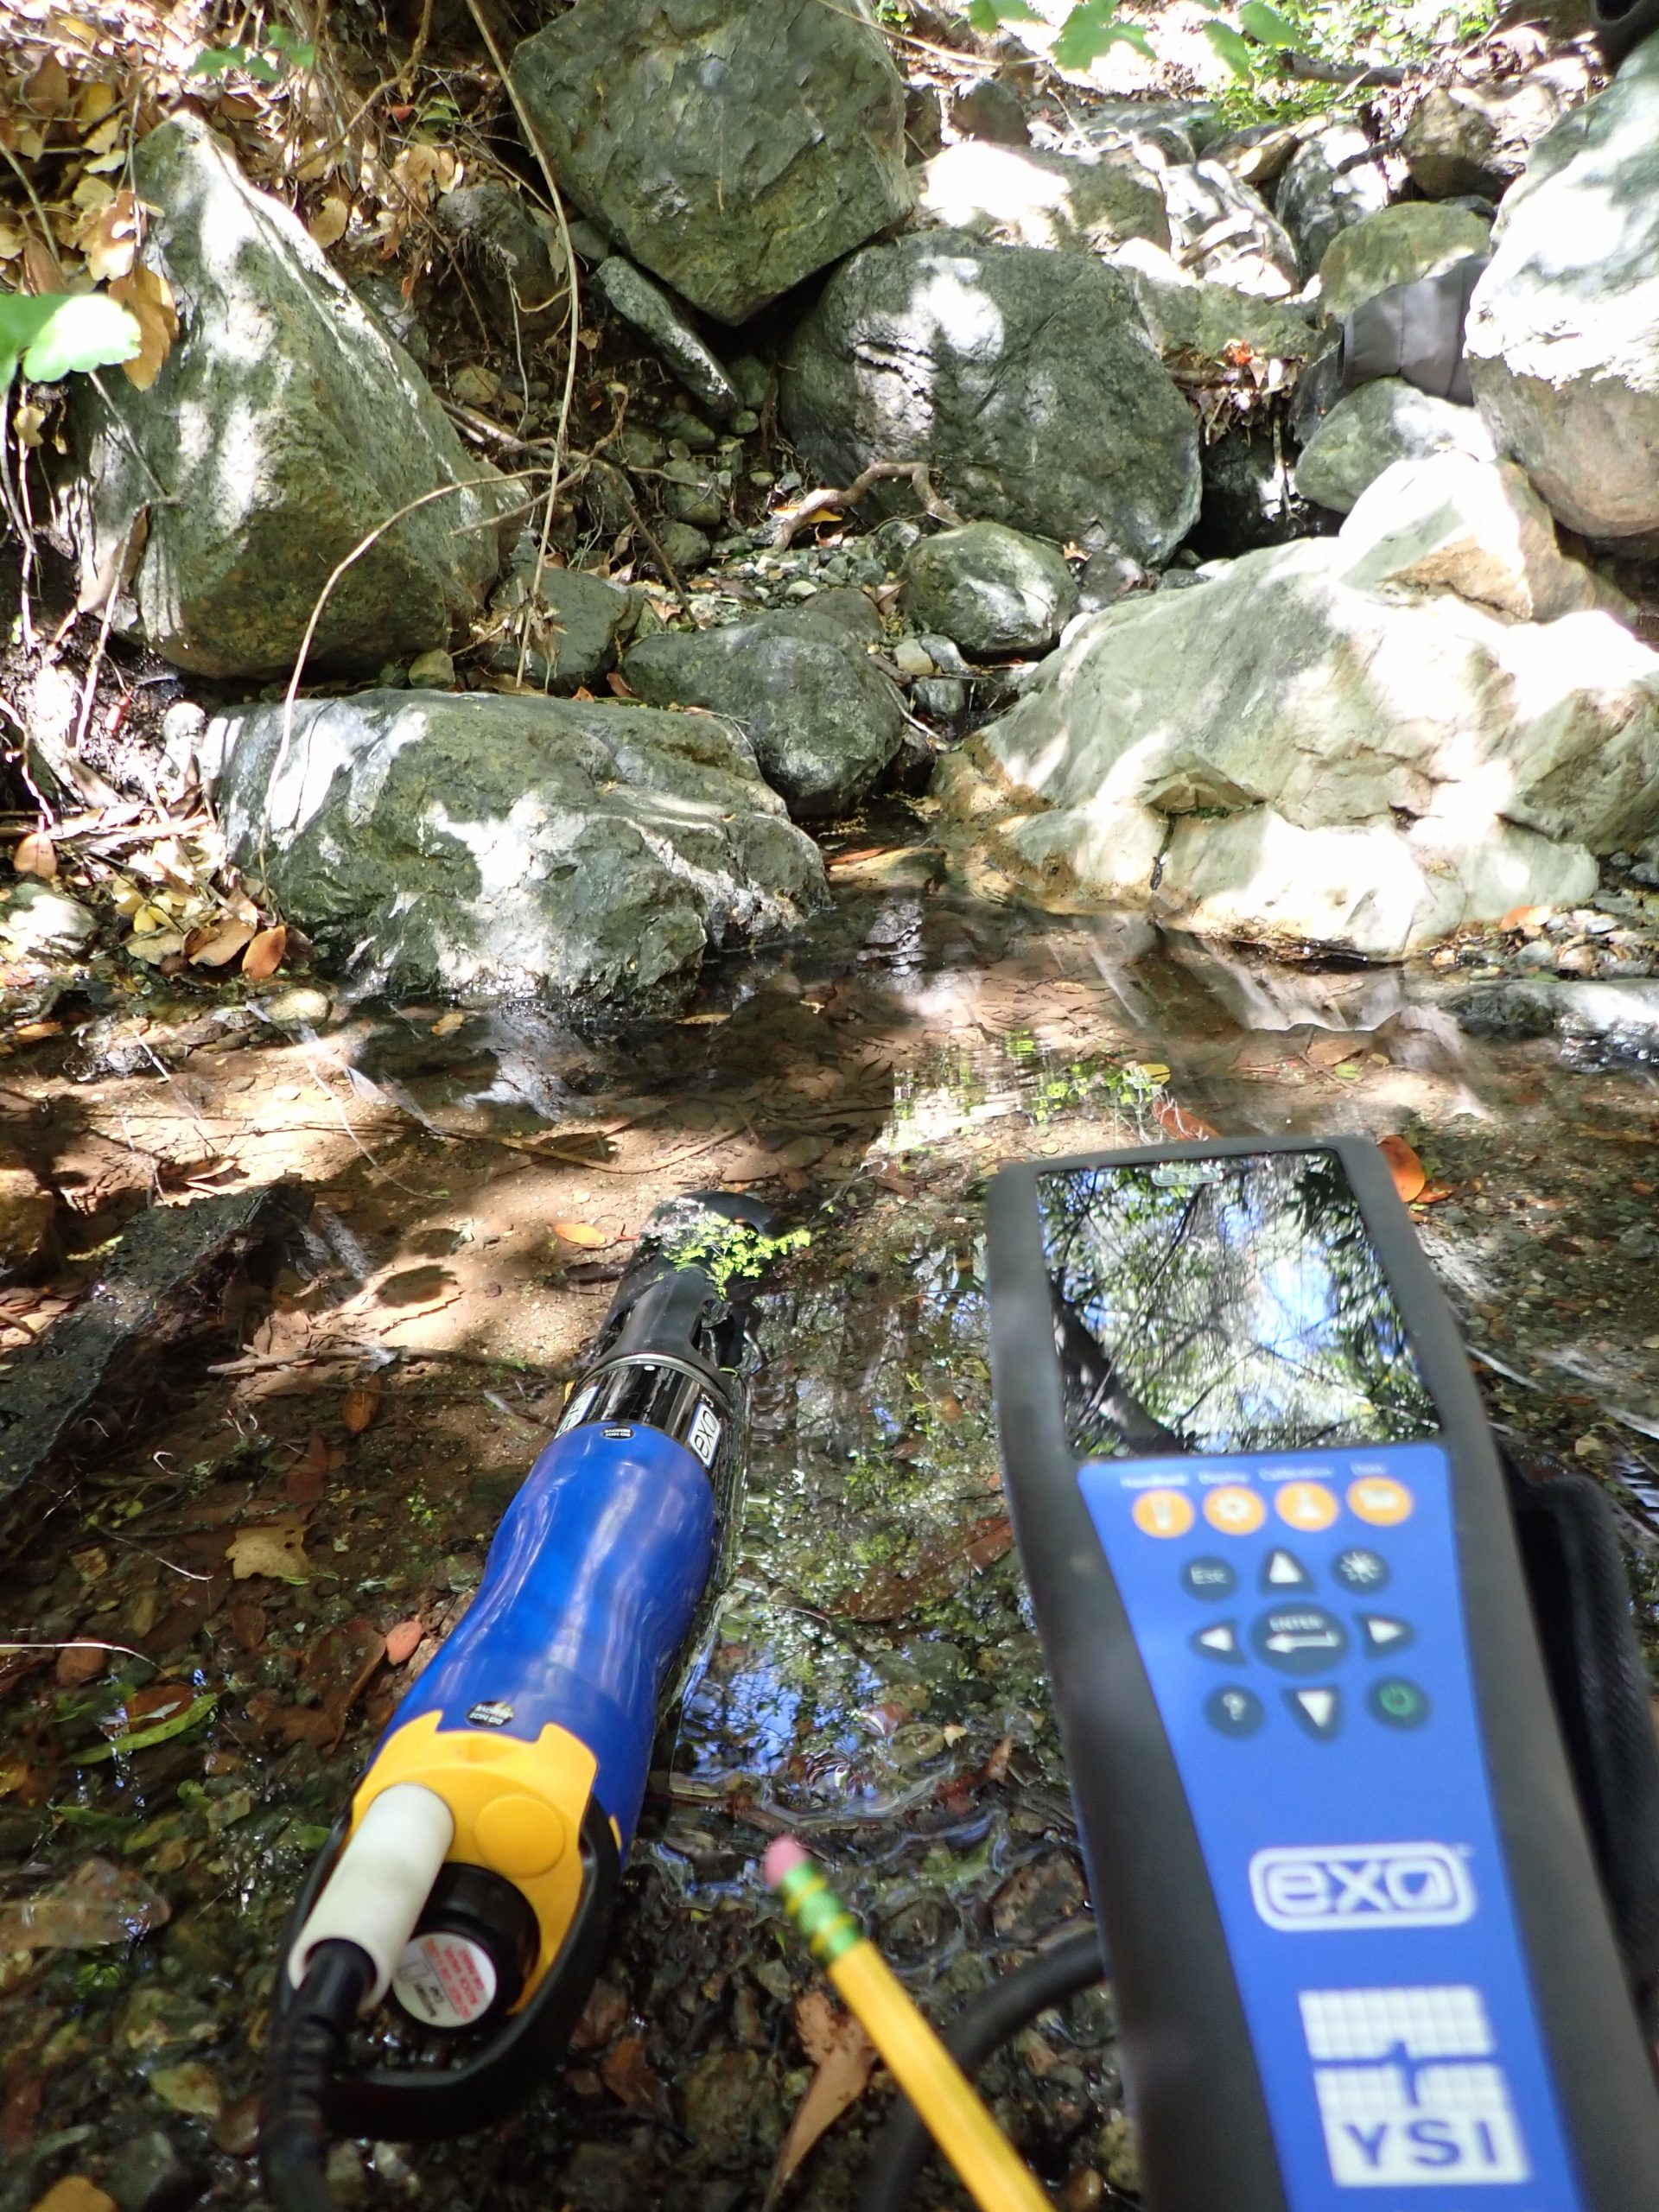
Because staff and volunteers can’t be on site all the time, we use technology that can. The Estuary Program has several types of continuous monitoring equipment, the latest being our EXO3 water quality sonde, which is equipped with water quality sensors that provide a more complete picture of the conditions at a specific monitoring site. We are excited about our ability to collect high quality continuous data to help us figuratively “hear when trees are falling” even when no one is around.
Diving into the data
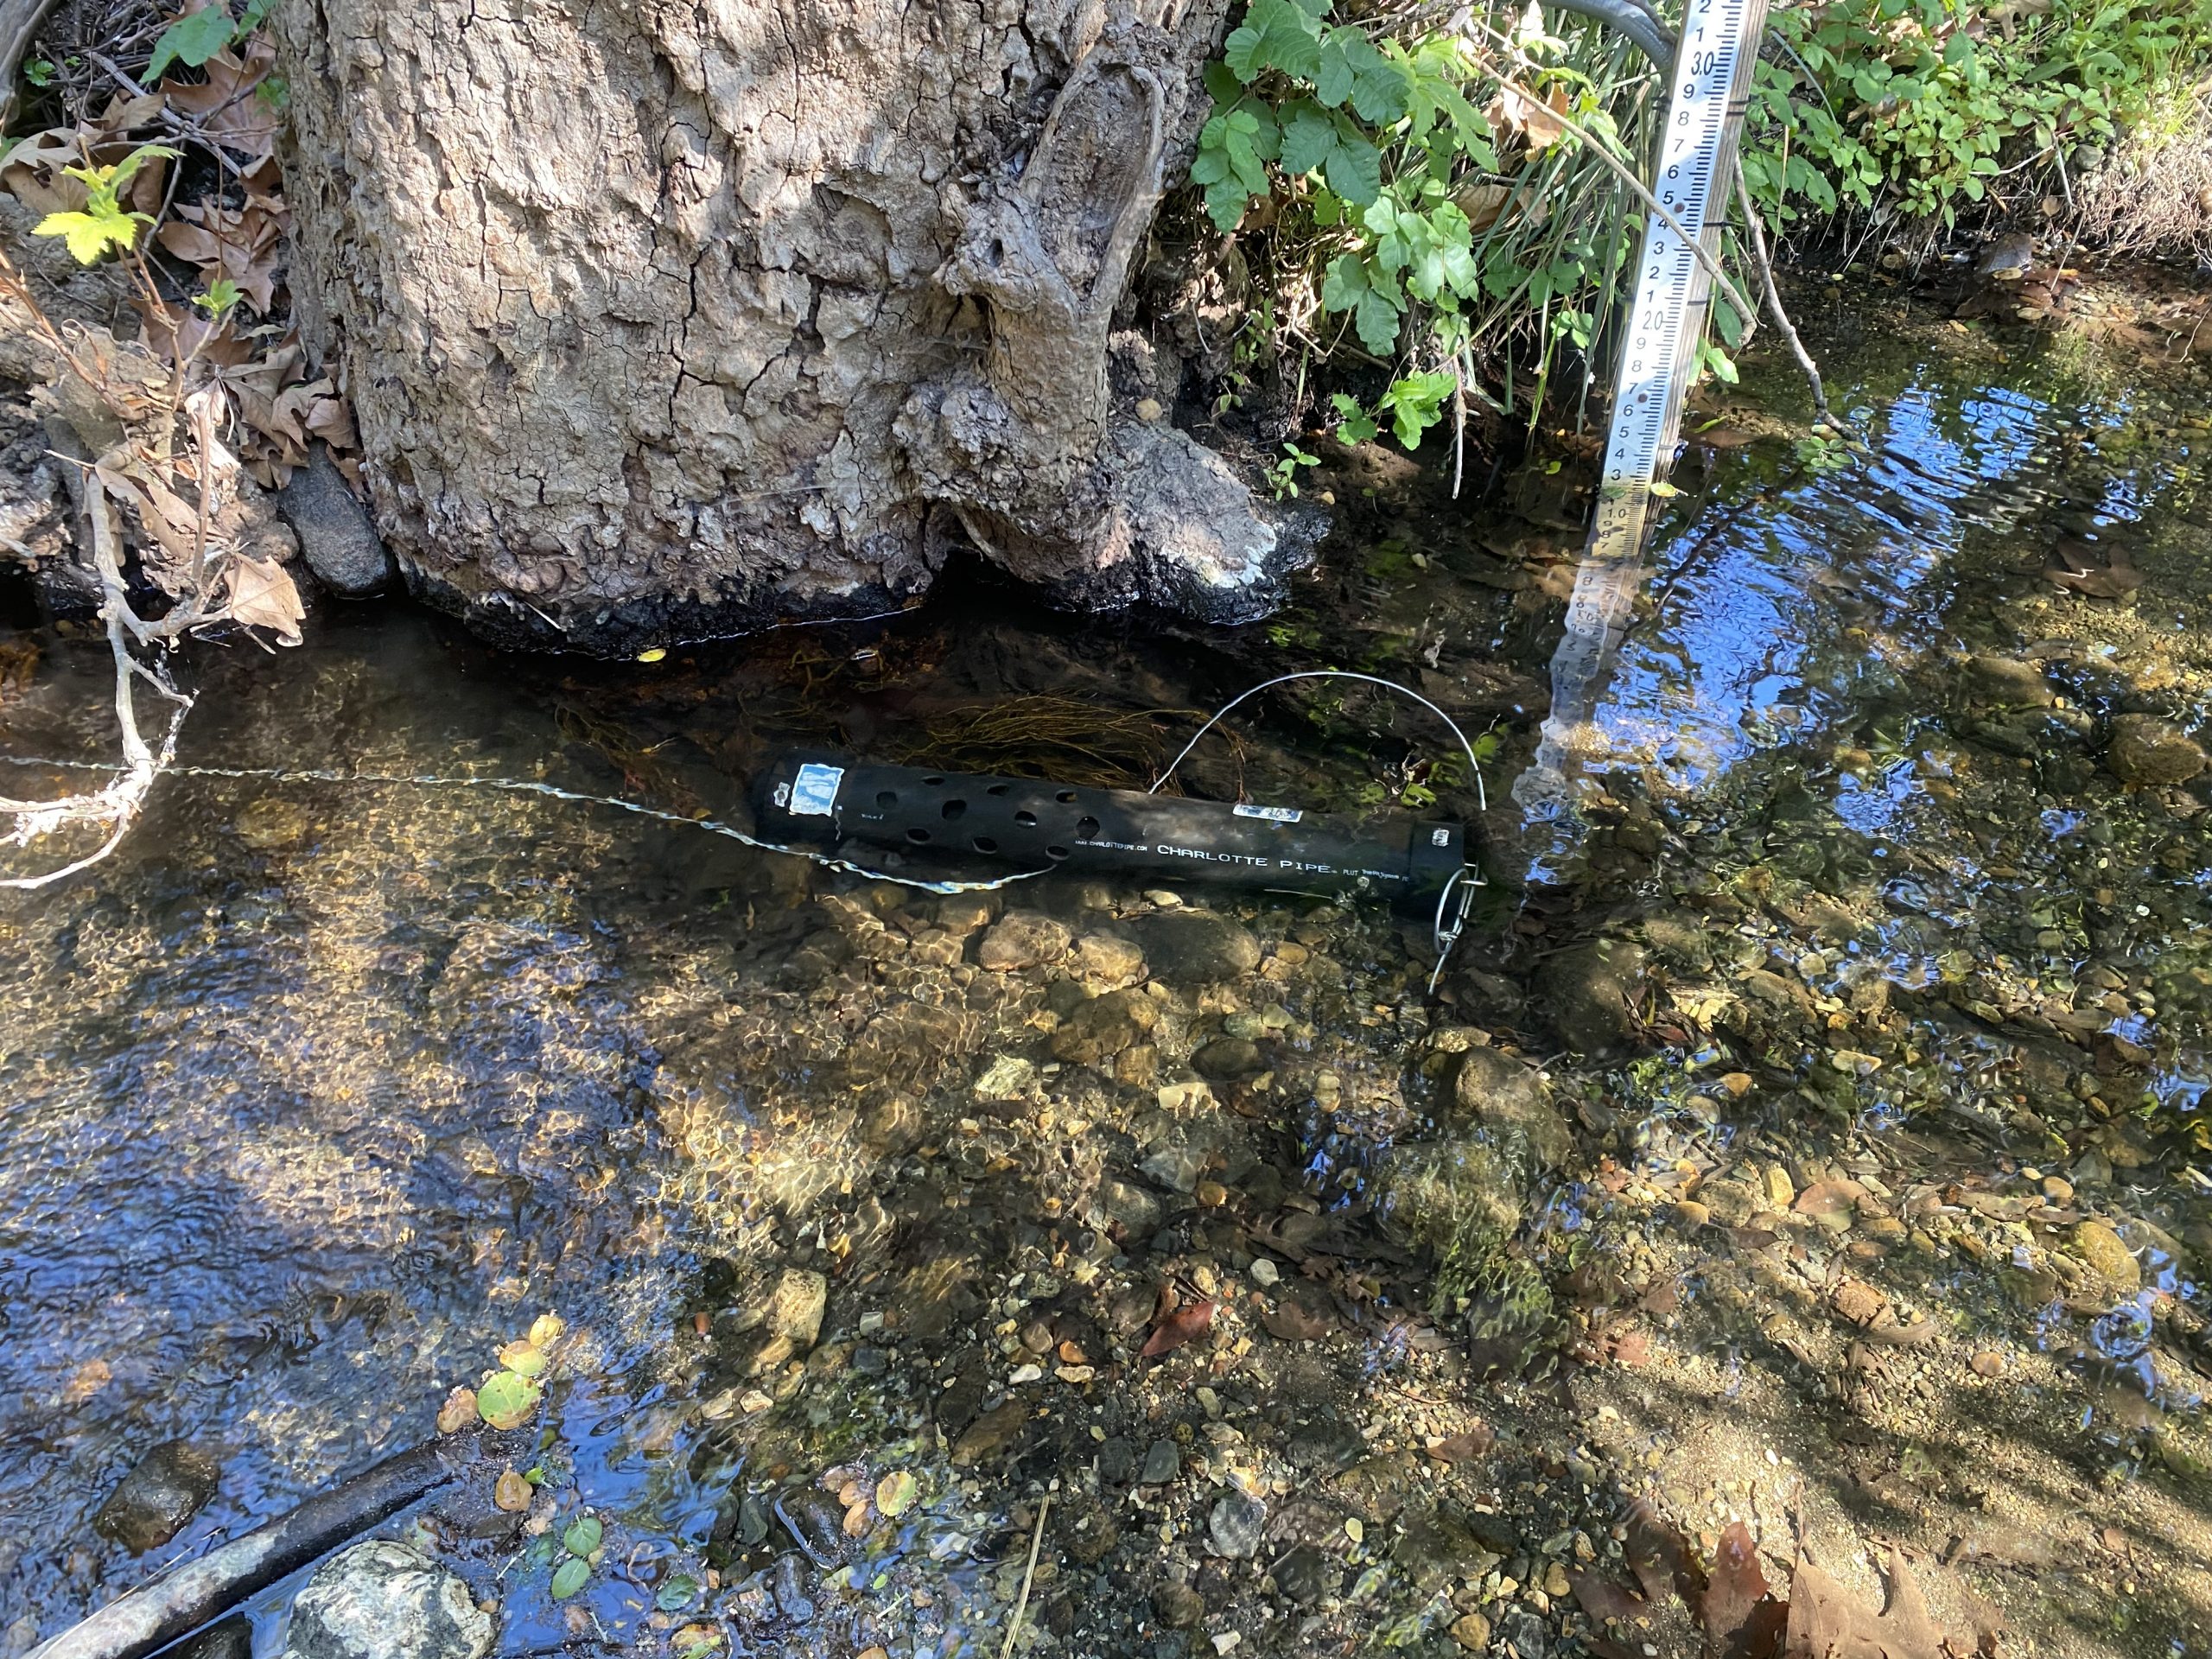
We typically deploy the EXO3 for about a week and program it to collect data every fifteen minutes on water temperature, conductivity, dissolved oxygen, pH, and depth measurements. The meter records the data on that schedule, storing it until we visit the site to download it.
The cyclical link between water temperature and dissolved oxygen levels
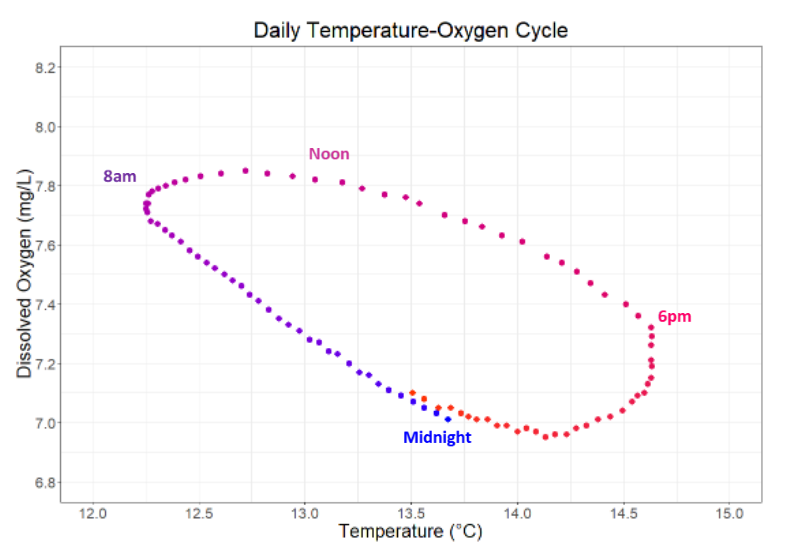
This data has allowed us to make an interesting observation about the relationship between water temperature and dissolved oxygen concentration, as displayed in the graph above. Over the course of a single day, there is a cyclical relationship between these two parameters that can be explained by water’s ability to hold onto more oxygen when it is colder. In the early morning, before the sun has risen, water temperatures decrease while dissolved oxygen increases (blue dots). These conditions are typically favorable for sensitive species such as steelhead trout, which prefer cool, well-oxygenated water. As things begin to warm up, the dissolved oxygen level flattens out before starting to decrease in the afternoon (purple dots). Water temperature increases throughout the afternoon before cooling back down in the evening, allowing dissolved oxygen to start rising again into the night (red dots).
Both water and air temperature affect the health of our creeks
The relationship between temperature and dissolved oxygen is not always a perfect circle, but by collecting these measurements for extended periods of time, we can begin to understand what is normal for our creeks and keep an eye out for any changes or issues that arise.
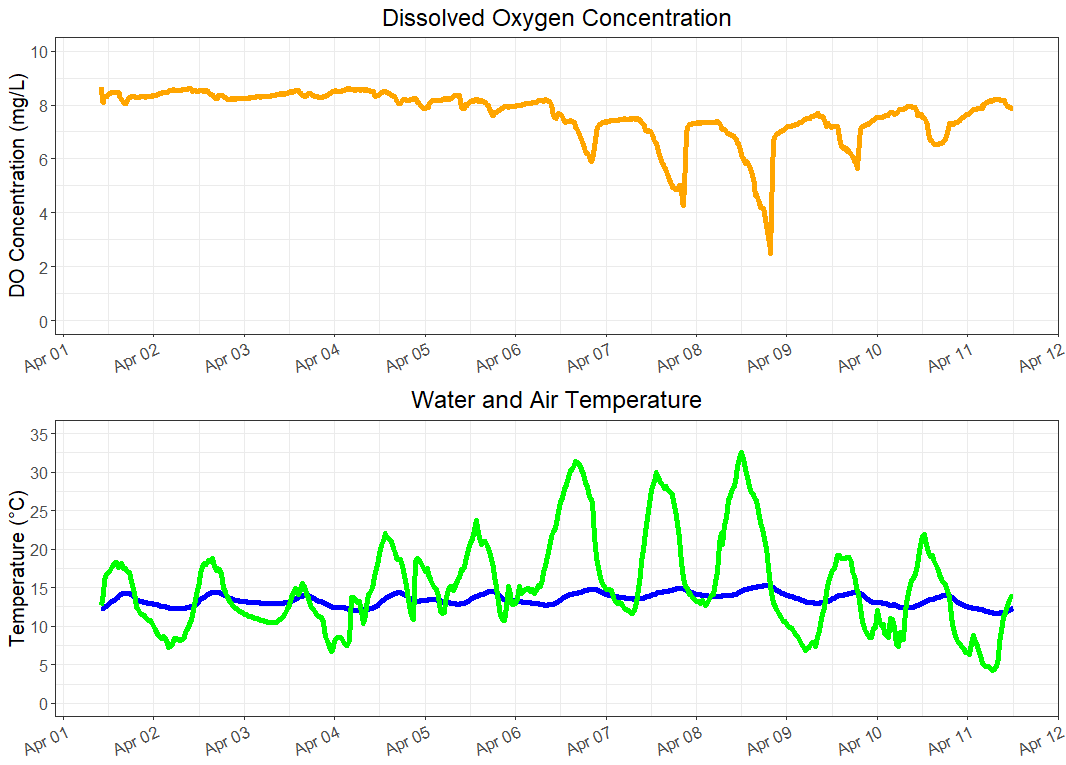
During the most recent deployment at Dairy Creek, the EXO3 picked up some unusually steep drops in dissolved oxygen concentration (see the orange line in the graph above). While the timing of these dips was consistent with the usual daily oxygen decline, the magnitude of the decrease was much more than water temperature alone could account for.
Fortunately, the Estuary Program has additional sensors deployed nearby, one of which records air temperature. The data showed a significant increase in air temperature prior to the oxygen dips. Higher air temperature can increase creek water evaporation, causing a creek segment with a low water level to go dry. Using the air temperature data alongside site observations, these oxygen dips can be identified as points in time when the creek became disconnected, meaning that segments of it dried up completely.
When a creek is disconnected, oxygenated water stops flowing downstream, and the downstream water becomes more stagnant. Especially during hot days, the effects of disconnection and warming can cause dissolved oxygen to drop to extremely low levels, which can stress or even harm aquatic life.
What these disconnection events mean for wildlife
Even though we set the EXO3 to collect data at this site for only eleven days, it was in the right place at the right time to capture these small disconnection events. The creek reconnected again after the weather cooled off, but this is a clear signal that Dairy Creek is beginning to dry up for the summer.
In our experience, intermittent disconnection is a common occurrence at this time of year on Dairy Creek, but it is still important to track as it comes with several ecological impacts. The data illustrates that creek disconnects mean low levels of dissolved oxygen, which can be especially harmful to organisms when concentrations fall too low for aquatic life to thrive (this is defined as 7 milligrams of dissolved oxygen per liter in the Central Coast Basin Plan).
A disconnected creek also means that steelhead trout are unable to migrate upstream to spawn, and fish that are already upstream are stranded until water levels rise. Insects also rely on water for reproduction, and as their numbers decline, the animals that feed on the insects have less food to sustain them.
Continuing to collect data
The Estuary Program will strategically deploy the EXO3 to capture important events in the future, whether that be large rain events or disconnects. By comparing our data from baseline conditions with these more extreme events, we can better understand how such conditions impact our watershed.
Subscribe to our weekly blog to have posts like this delivered to your inbox each week.
Help us protect and restore the Morro Bay estuary!
- Donate to the Estuary Program today and support our work in the field, the lab, and beyond.
The Estuary Program is a 501(c)3 nonprofit. We depend on funding from grants and generous donors to continue our work. - Support us by purchasing estuary-themed gear from ESTERO. This locally owned and operated company donates 20% of proceeds from its Estuary clothing line and 100% of Estuary decal proceeds to the Estuary Program. Thank you, ESTERO!
- Purchase items from the the Estuary Program’s store on Zazzle. Zazzle prints and ships your items, and the Estuary Program receives 10% of the proceeds. Choose from mugs, hats, t-shirts, and even fanny packs (they’re back!) with our fun Estuary Octopus design or our Mutts for the Bay logo.
Thank you for helping our beautiful, bountiful, biodiverse bay!