Eelgrass monitoring at the Estuary Program is a task that takes place both in the field and on the computer. Even when we’re not measuring eelgrass blades and recording shoot counts directly, we are working behind the scenes to process data from previous monitoring efforts and schedule future surveys. While there was no fieldwork conducted along the eelgrass beds in October, this post highlights the work that goes into processing photos to assess eelgrass health and the challenges associated with planning ahead for upcoming monitoring efforts.
Photos Fill in the Gaps
Assessing eelgrass health while in the field can be difficult, since we need to cover a large area in a short amount of time and are typically racing against incoming tides. Taking detailed pictures is a great way to save time and obtain extra information that’s easily overlooked in the field. Staff use pictures of eelgrass blades to determine how healthy they are with the help of indicators such as how much of the blades are covered by dead tissue, small invertebrates, and algae. The general methods for the photo processing were outlined in a previous blog post.
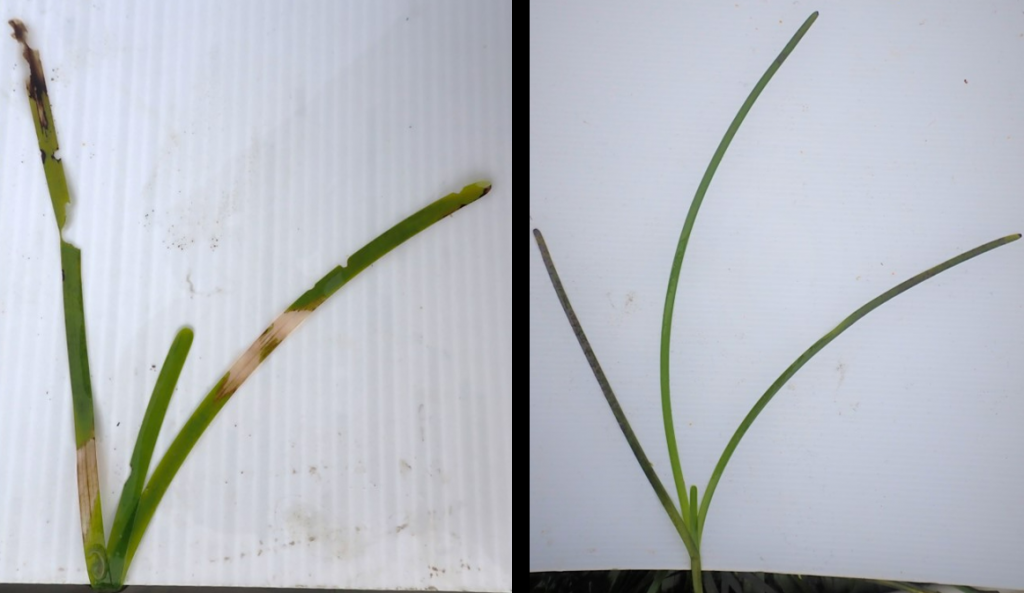
The presence of dead tissue is a significant indicator of eelgrass blade health. Dead tissue is unhealthy tissue that is dark, brittle, and doesn’t photosynthesize properly, as opposed to the stronger, green tissue of thriving eelgrass blades. The more dead tissue present, the less healthy the eelgrass tends to be.
While data collected in the field measures the number of blades that contain sections of dead tissue, this does not account for the amount of dead tissue on those blades. Photo processing allows us to get more precise data and provides the percent cover of dead tissue on each individual blade.
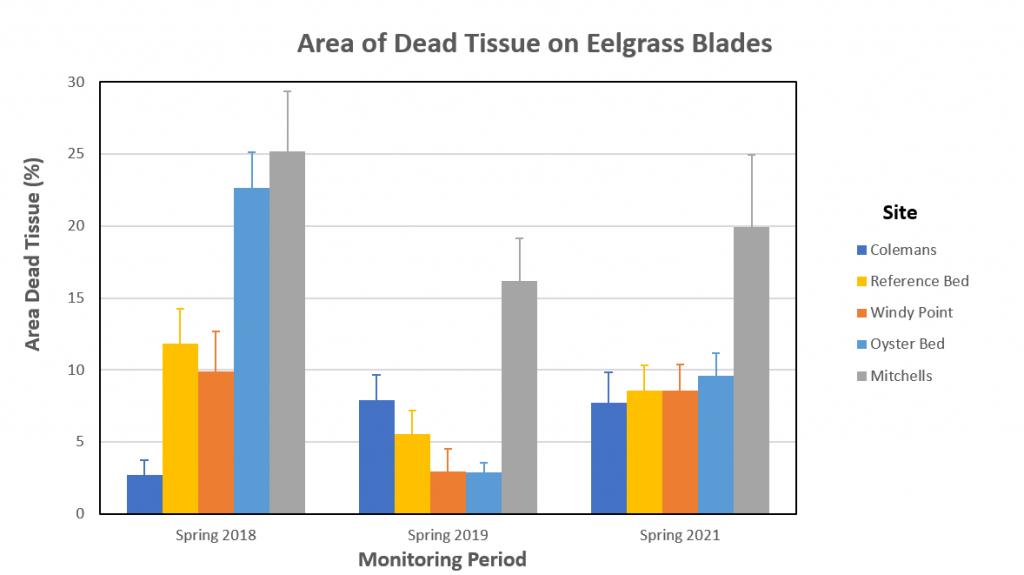
The graph above shows that the site located further back in the bay near Mitchell Drive (represented in gray) consistently has more dead tissue on each eelgrass blade compared to the other sites. Photo processing has allowed us to uncover that eelgrass at Mitchell is unhealthy compared to the other sites, which is valuable for narrowing down the conditions that favor eelgrass within the estuary.
Preparing for the Winter Monitoring Season
At any one moment, the water that has made its way into Morro Bay has been brought there by a complex combination of winds, currents, and tides. While accounting for all of these factors when scheduling monitoring efforts can be a bit dizzying at first, we are fortunate to have a wide array of predictive tools at our disposal. Our team utilizes an essential toolkit of forecasts to select dates and times with ideal conditions for our work.
Changing Tides
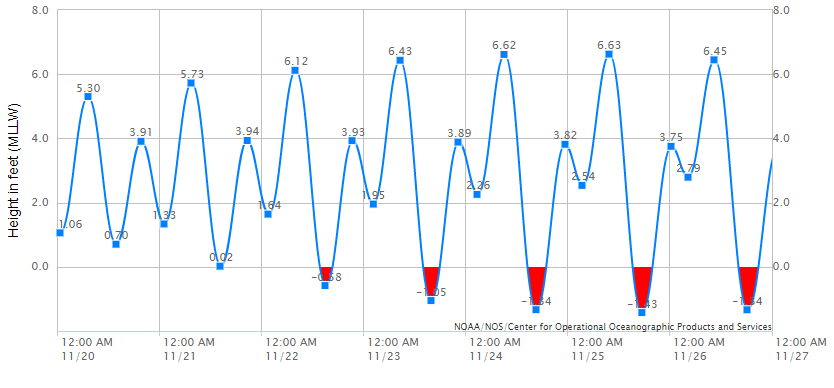
The first component of scheduling a successful eelgrass survey is checking the tides. NOAA has a user-friendly tool for predicting tides utilizing data collected by a network of buoys. Since the tides are a product of the sun and moon’s distance from the earth along with the earth’s rotation, there is an inherent predictability to them, which can be modeled years in advance. However, for the sake of our planning, we typically use tide predictions from two to three months in advance. To survey eelgrass effectively, we need a negative tide, with some sites requiring a tide of –1ft or lower in order to have enough time to complete the survey!
Keeping Track of Daylight
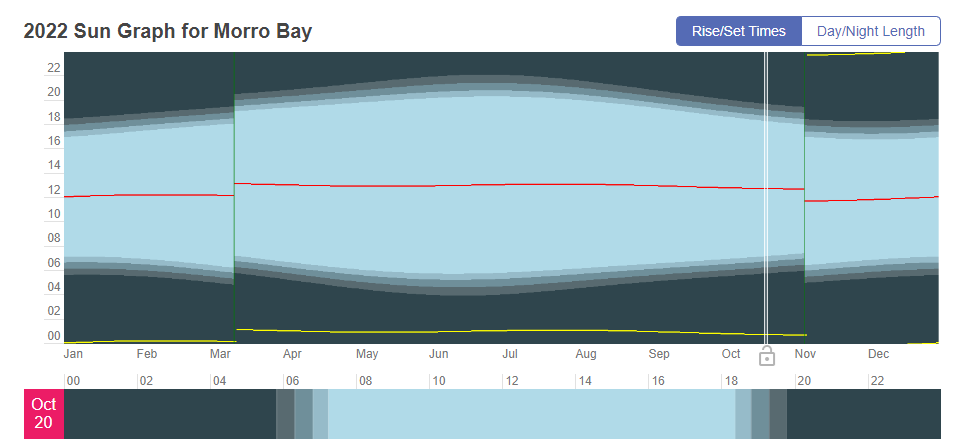
After we determine the optimal tides, we have to take into consideration the amount of available daylight. Monitoring eelgrass accurately requires adequate light, and attempting to paddle back to shore after the sun has set is not ideal either. The winter months typically have late afternoon low tides, which means our work is often limited by daylight rather than available low tides, especially after daylight savings time ends. Because of this, keeping track of sunset times is an essential component of scheduling our upcoming eelgrass monitoring.
Adjustments for Windy Weather
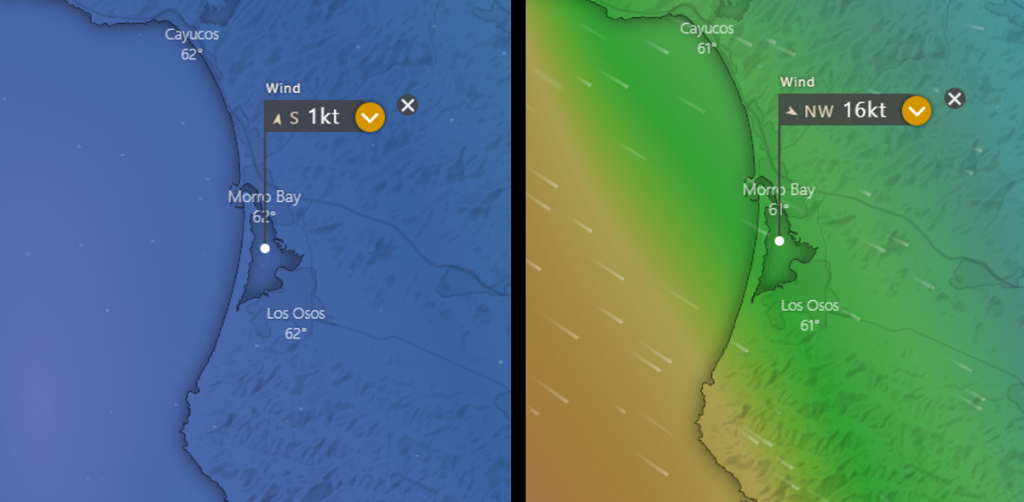
After checking the tide and daylight information, we’ll produce a draft of the monitoring schedule. But years of field experience have taught us to always expect the unexpected. Even with our carefully made plans, we can’t predict the weather as far in advance, and this may mean adverse conditions will descend upon the estuary during our scheduled dates. We deal with this uncertainty by scheduling backup dates and frequently checking weather applications like Windy, which can predict wind and precipitation over a week in advance.
When the tides, sunset times, and last-minute weather conditions align, then we’re ready to head out into the field for the next round of monitoring!
Help us protect and restore the Morro Bay estuary!
- Donate to the Estuary Program today and support our work in the field, the lab, and beyond. The Estuary Program is a 501(c)3 nonprofit. We depend on funding from grants and generous donors to continue our work.
- Support us by purchasing estuary-themed gear from ESTERO. This locally owned and operated company donates 20% of proceeds from its Estuary clothing line and 100% of Estuary decal proceeds to the Estuary Program. Thank you, ESTERO!
- Purchase items from the Estuary Program’s store on Zazzle. Zazzle prints and ships your items, and the Estuary Program receives 10% of the proceeds.
Thank you for helping our beautiful, bountiful, biodiverse bay!