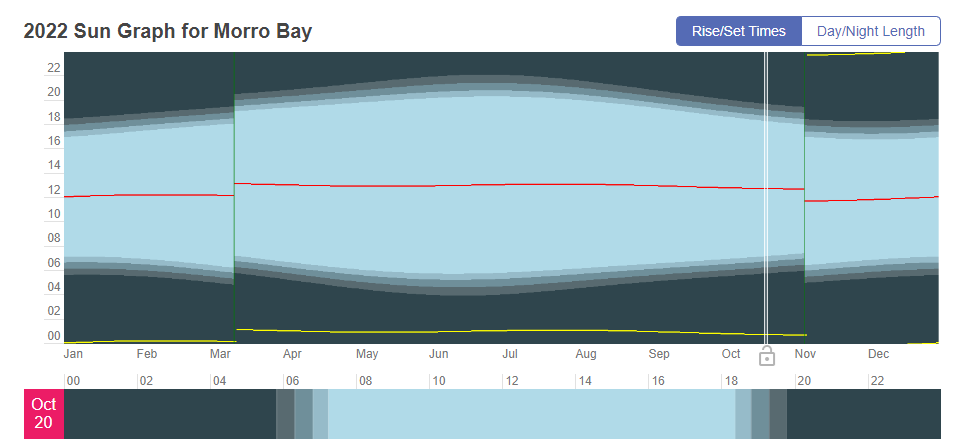
A sun graph for Morro Bay illustrating changes in the amount of available daylight over the course of the year. The shifts in March and November represent daylight savings time. Graphic courtesy of timeanddate.com.
Enter your email address to subscribe to this blog and receive notifications of new posts by email.
Email Address
Subscribe