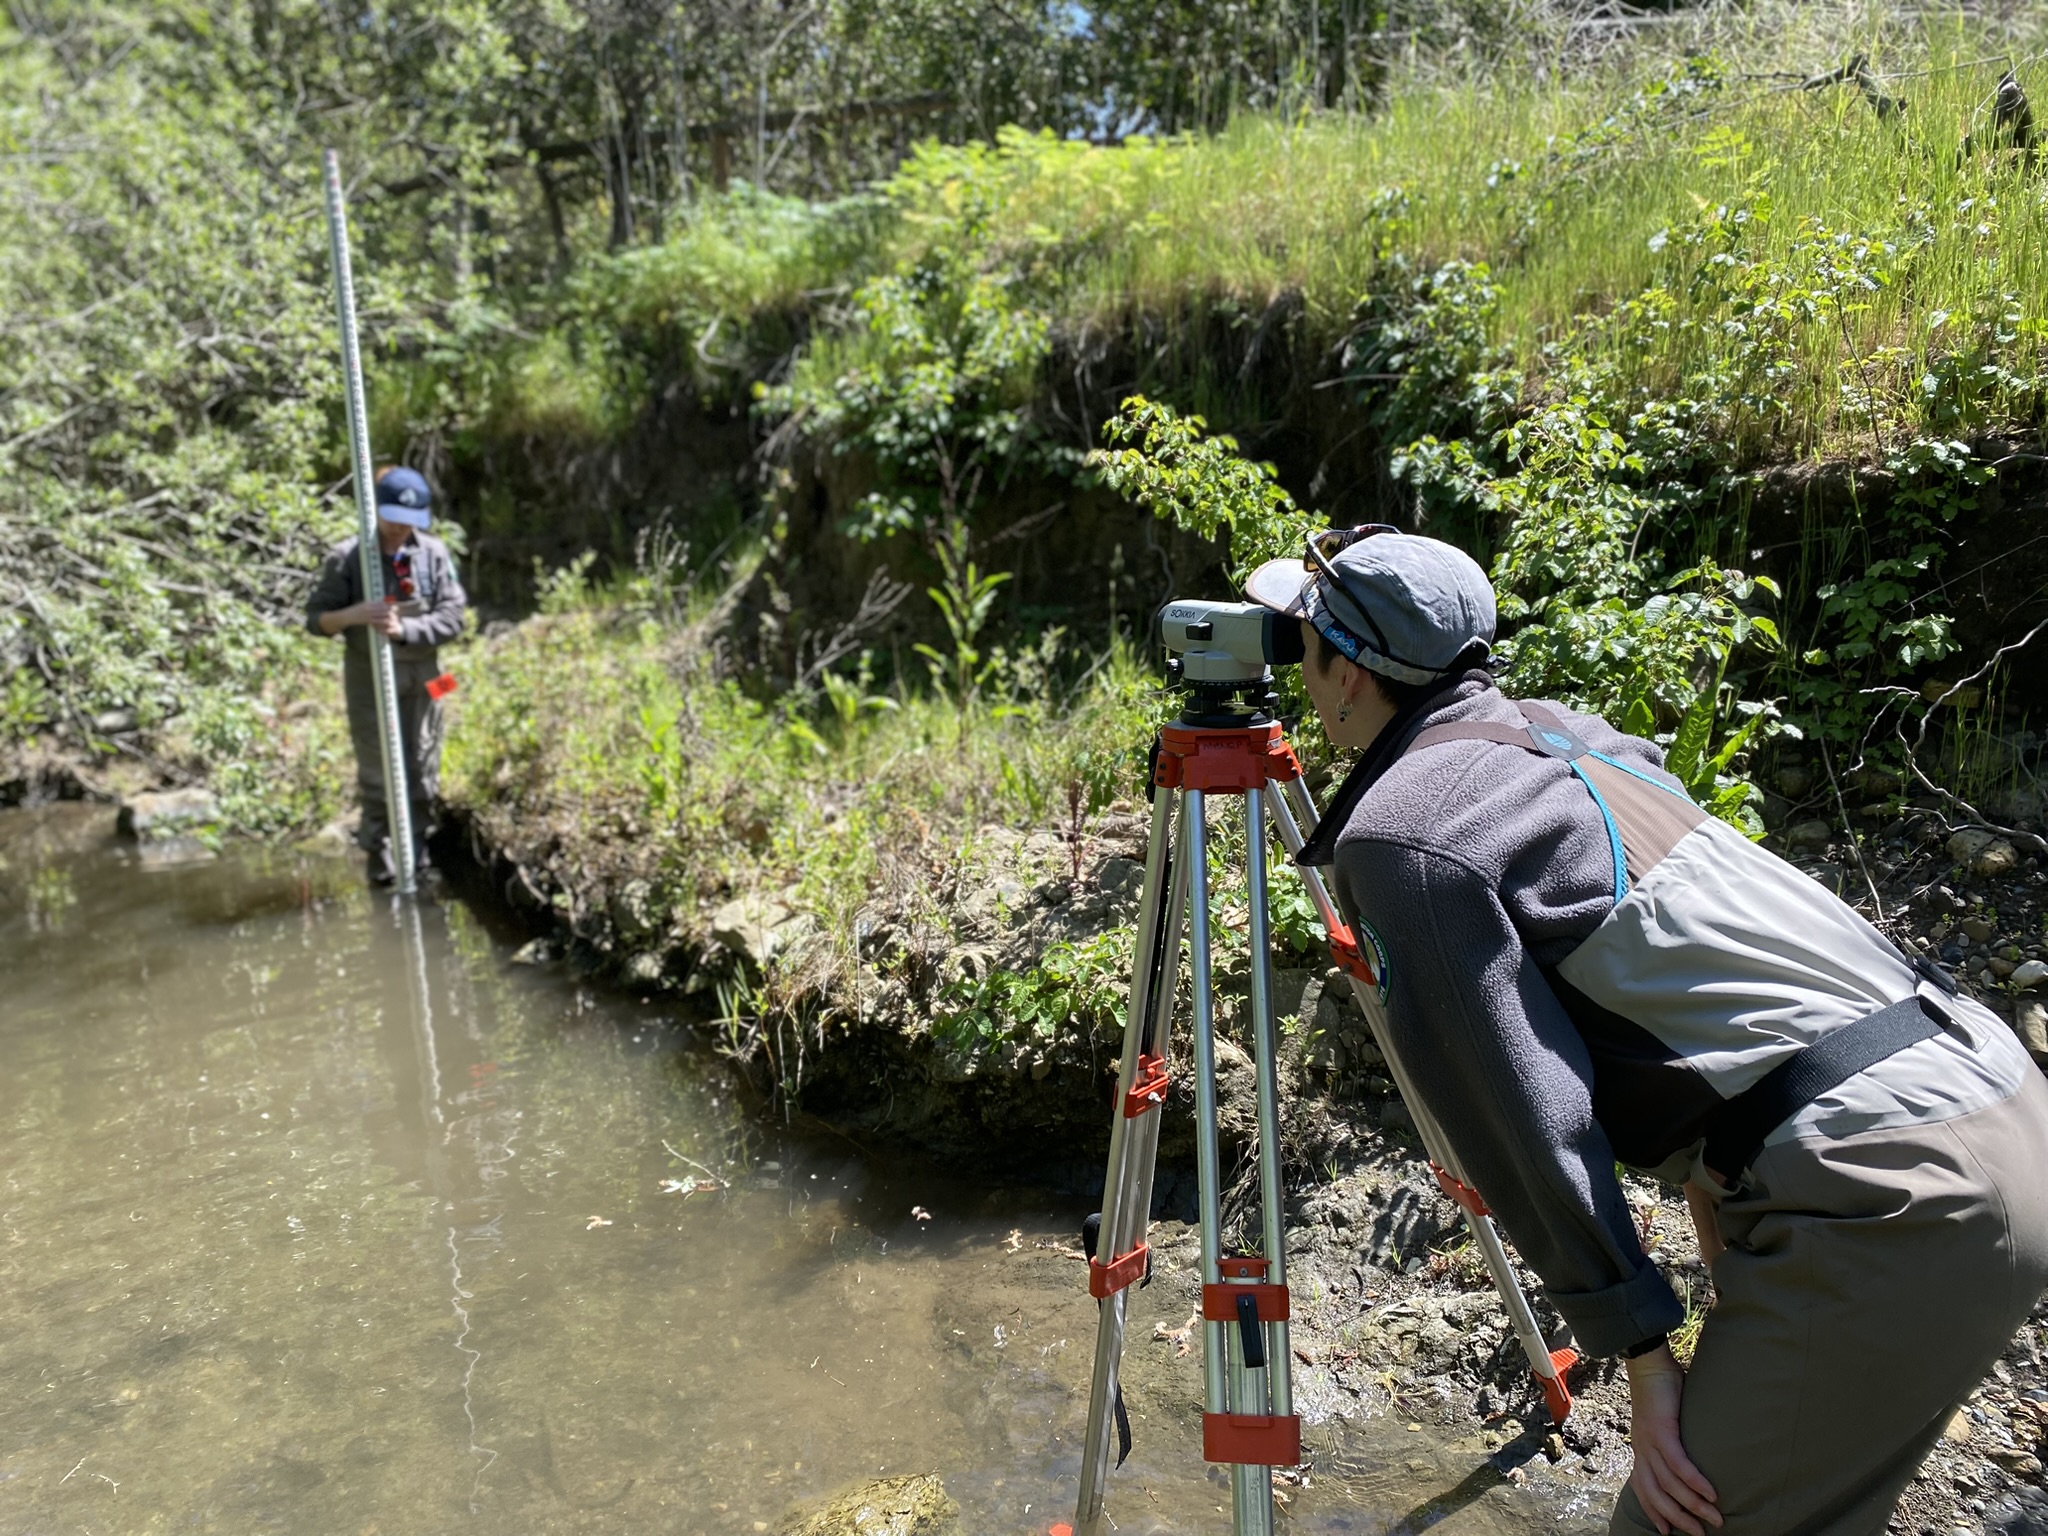
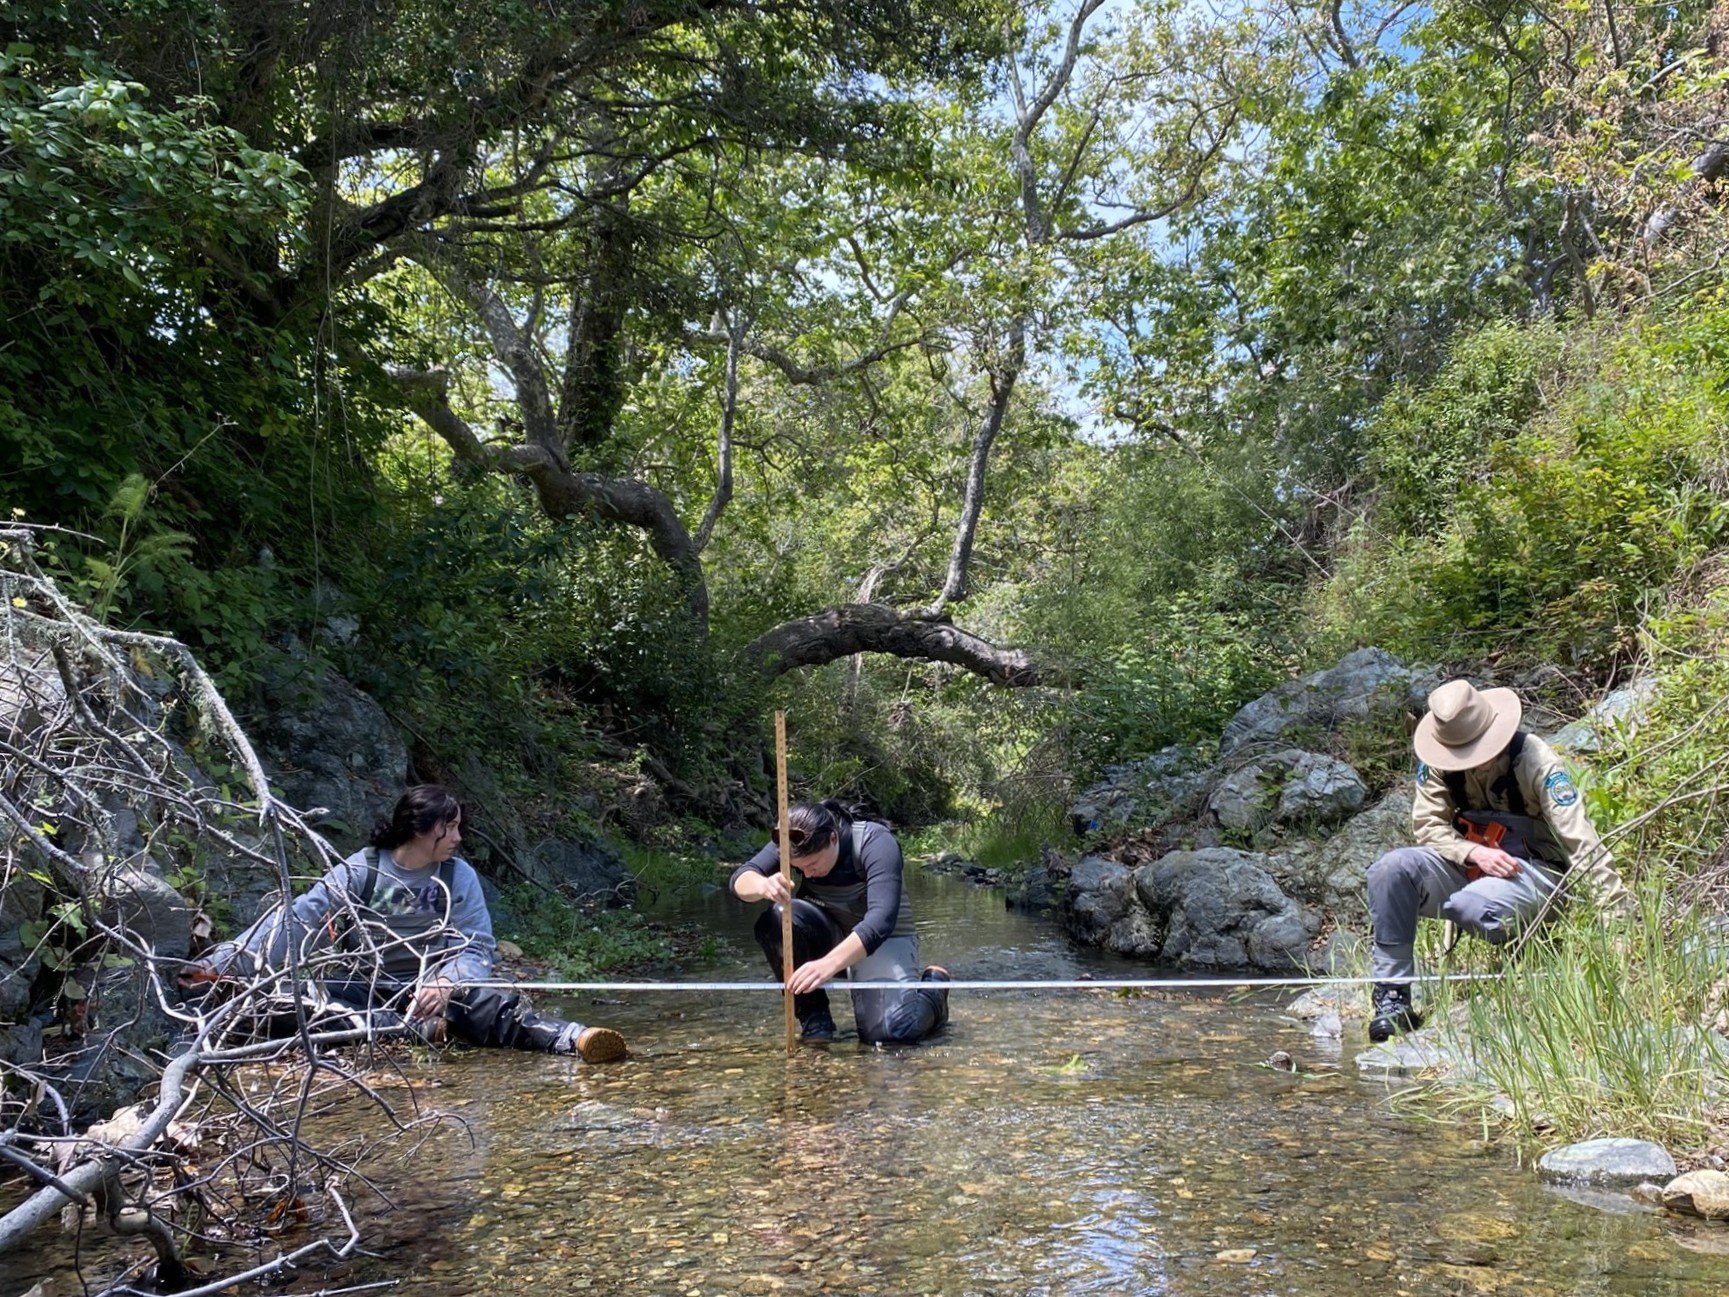
Every spring, staff and volunteers head out to sites throughout the watershed to conduct bioassessment surveys. Each survey is an intensive effort to collect nearly 1,500 measurements that describe creek health. The results help us to determine how creeks are changing over time and if they can support sensitive aquatic species. We completed our 2025 survey effort in June and received our results this fall.
How We Measure Creek Health
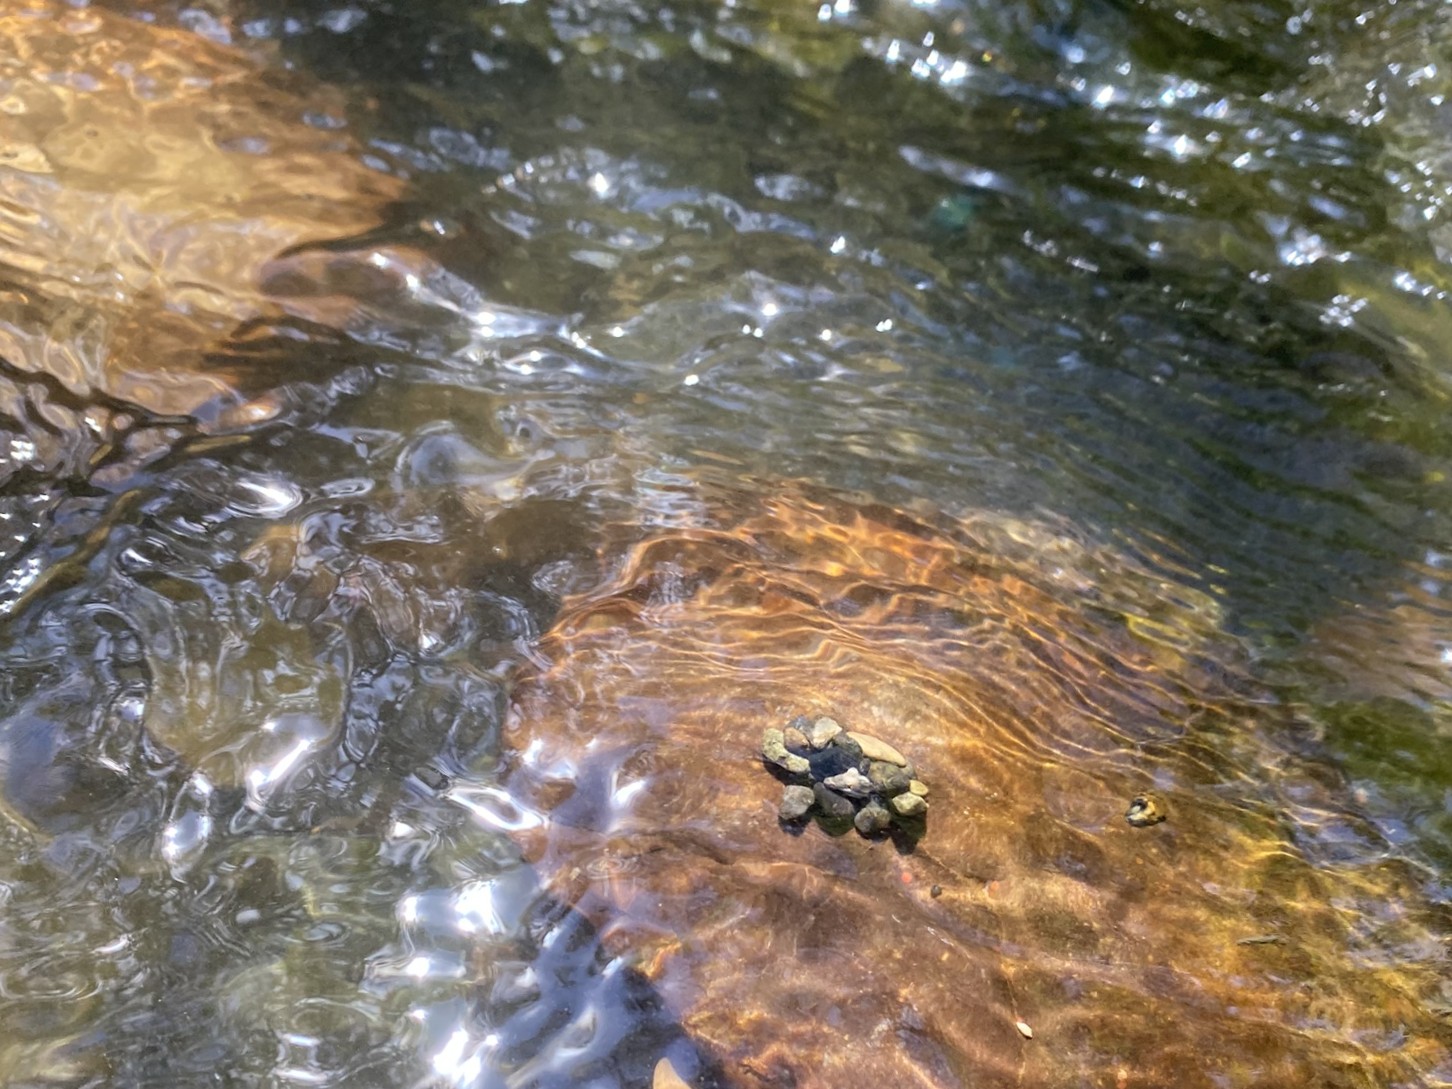
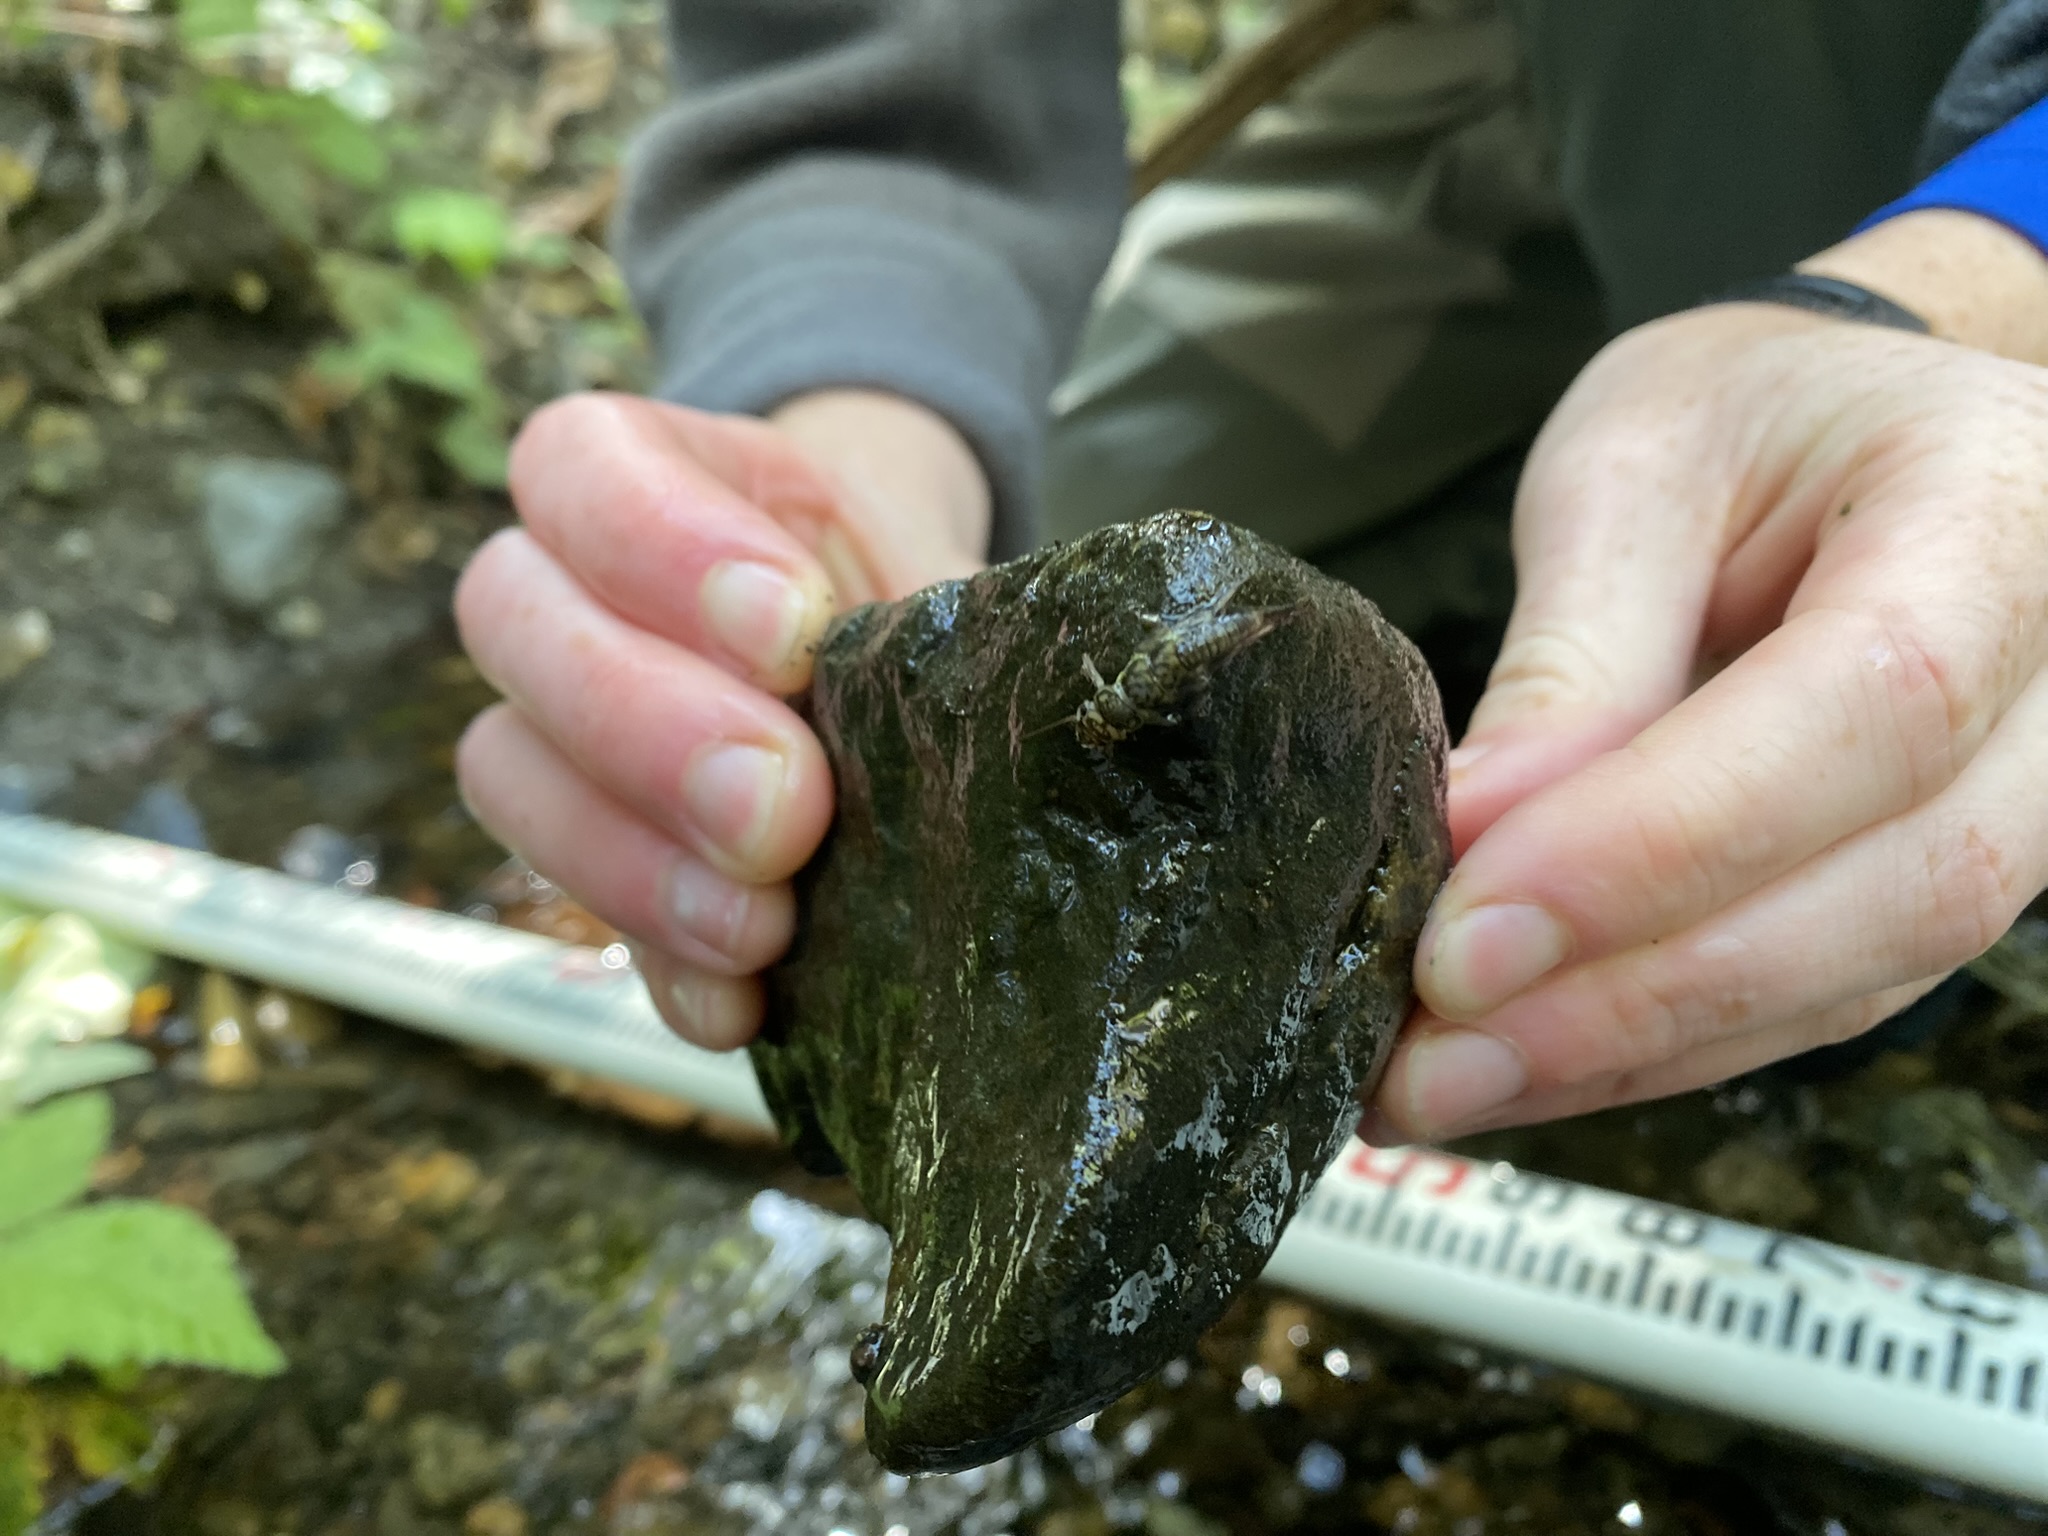
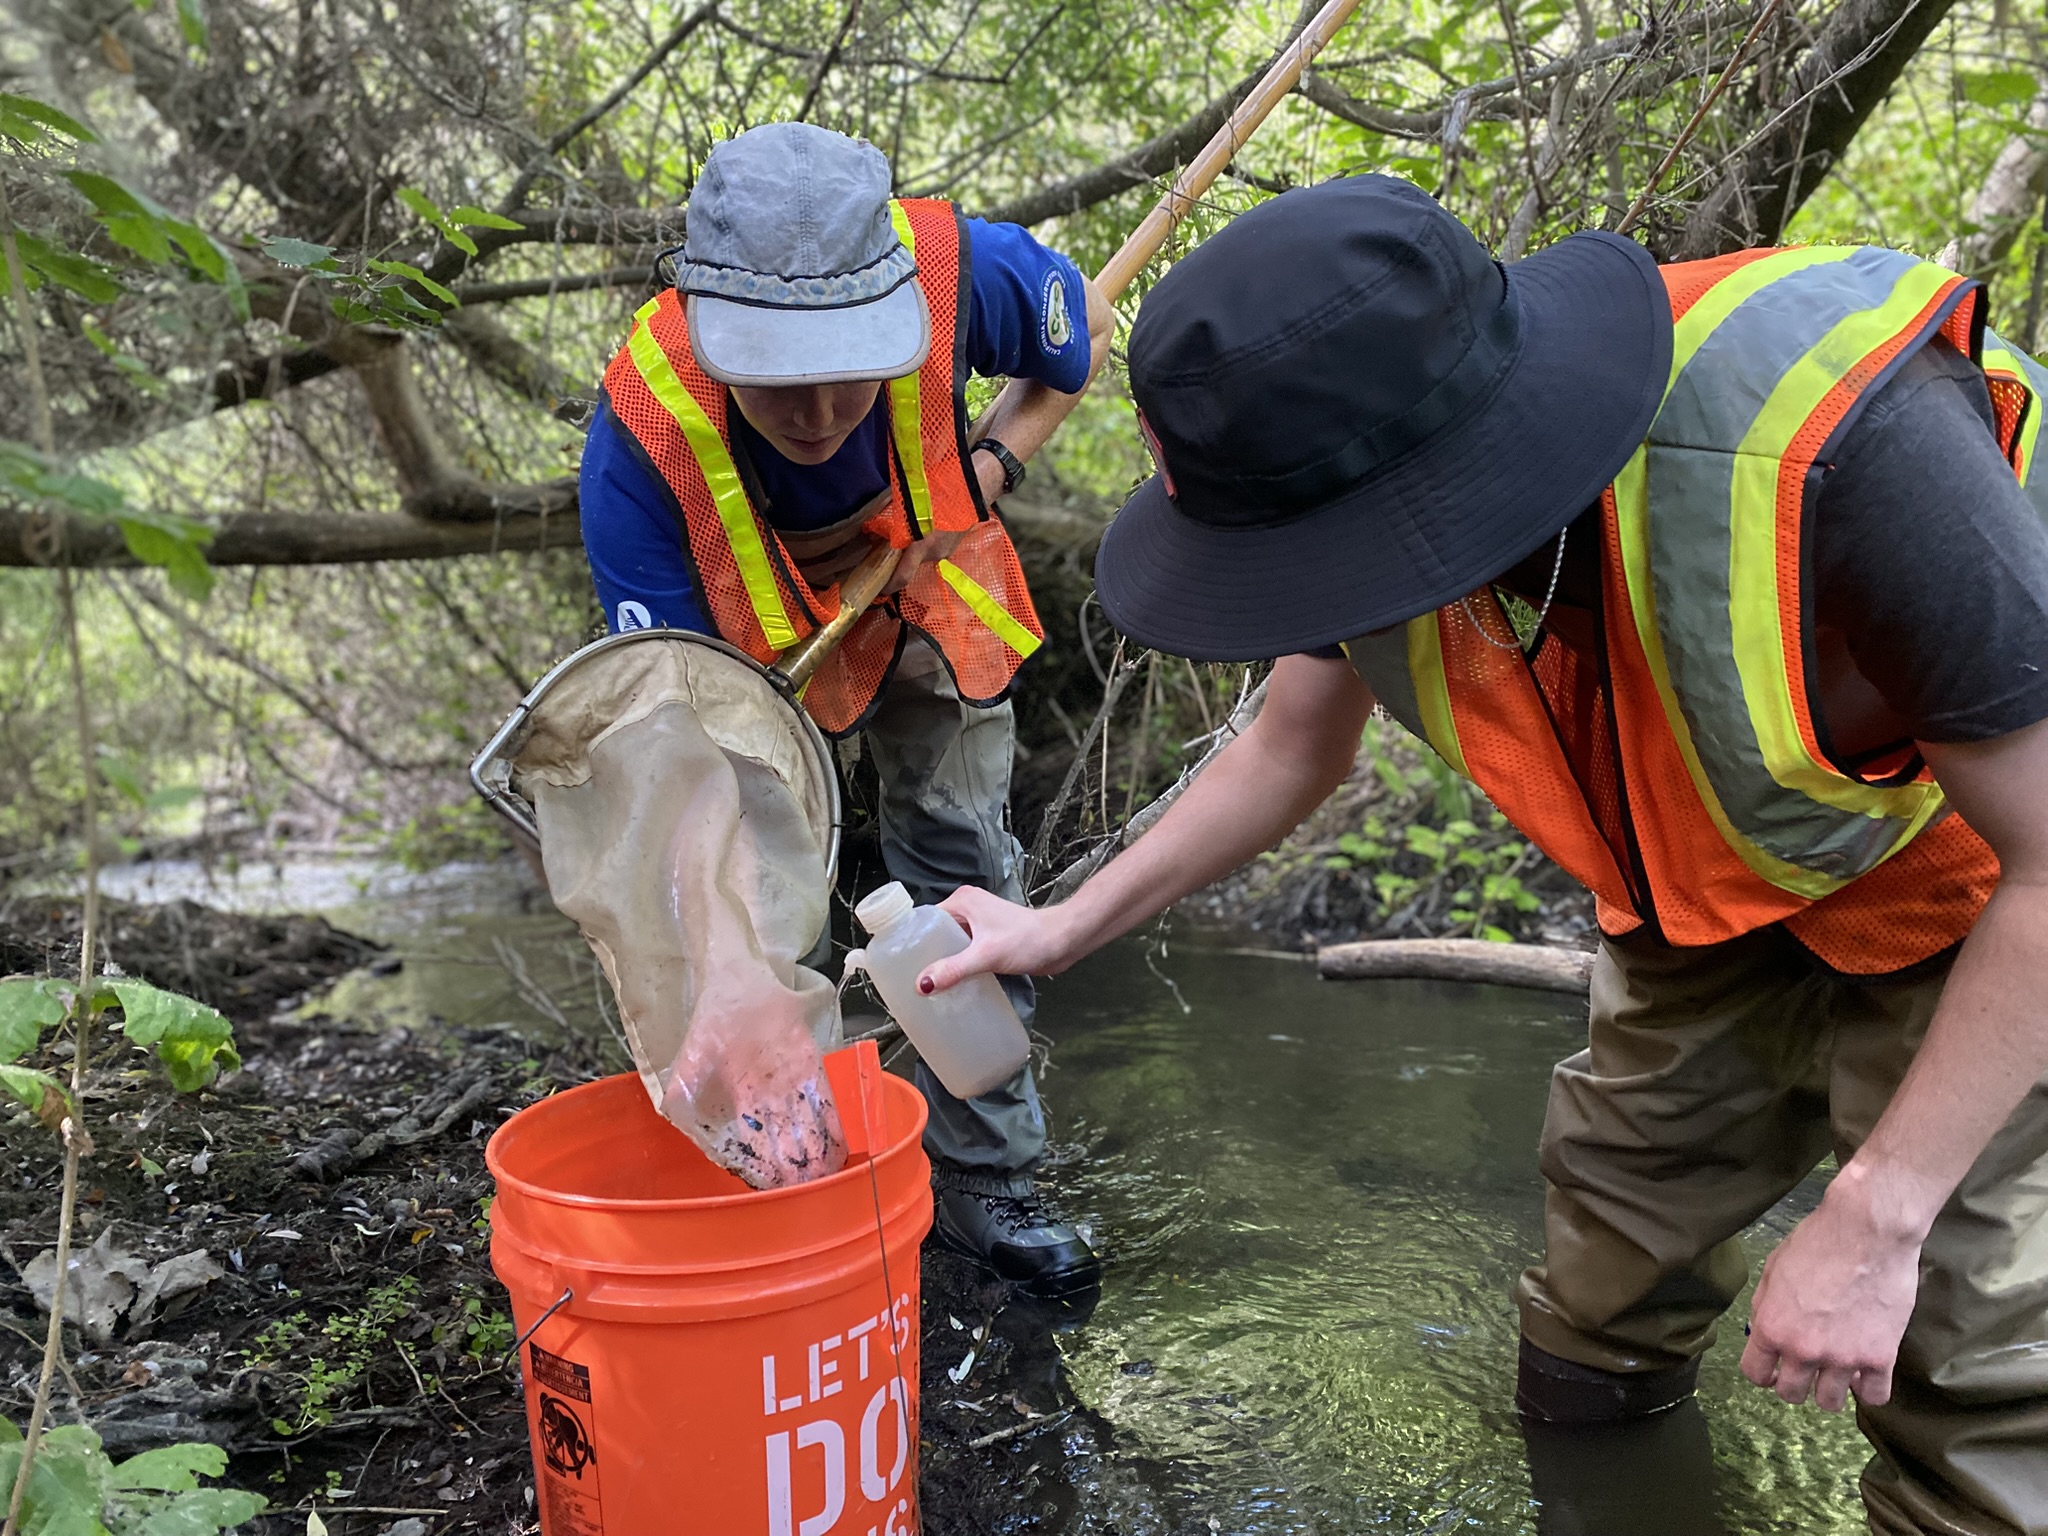
Creeks are complex habitats, so when we monitor them, it’s important that we understand all of the physical, chemical, and biological factors at play. Physical traits of a creek could be rock size, channel width, or stream slope. Chemical factors might include water temperature, pH, and dissolved oxygen. To understand the biological traits of the creek, we look below the water’s surface at the insects visible to the naked eye (“macroinvertebrates”) that live on the creek floor. These bottom-dwelling (“benthic”) macroinvertebrates act as biological indicators, meaning that their presence tells us something about creek health. Some species are very sensitive to pollution, while others can tolerate or even thrive in polluted waters. The presence of sensitive species indicates that the water quality is likely good, while pollution-tolerant species may indicate poorer conditions.
Healthy creeks rely on a balance of chemical conditions like clean water, physical factors like stable streambanks, and biological conditions like a diverse macroinvertebrate community. Bioassessment monitoring provides a unique framework for monitoring all of these elements to illustrate a fuller picture of creek health. By following a standardized protocol developed by the State Water Board, our results can also be compared to results across the state and used to guide management decisions.
Our 2025 Monitoring Effort
The Estuary Program had an exceptional field crew for spring surveys this year. Estuary Program staff worked with the Watershed Stewards Program (WSP), the CA Conservation Corps (CCC), and the Central Coast Ambient Monitoring Program (CCAMP) to monitor ten creek sites between April and June 2025. Our collaborative team surveyed three sites on the mainstem of Chorro Creek, two sites on Dairy Creek, two sites on San Luisito Creek, and one site each on Los Osos, San Bernardo, and Pennington Creeks.

To learn more about how the Estuary Program conducts bioassessment monitoring, read our blog from earlier this year describing our spring effort.
What Our Results Say
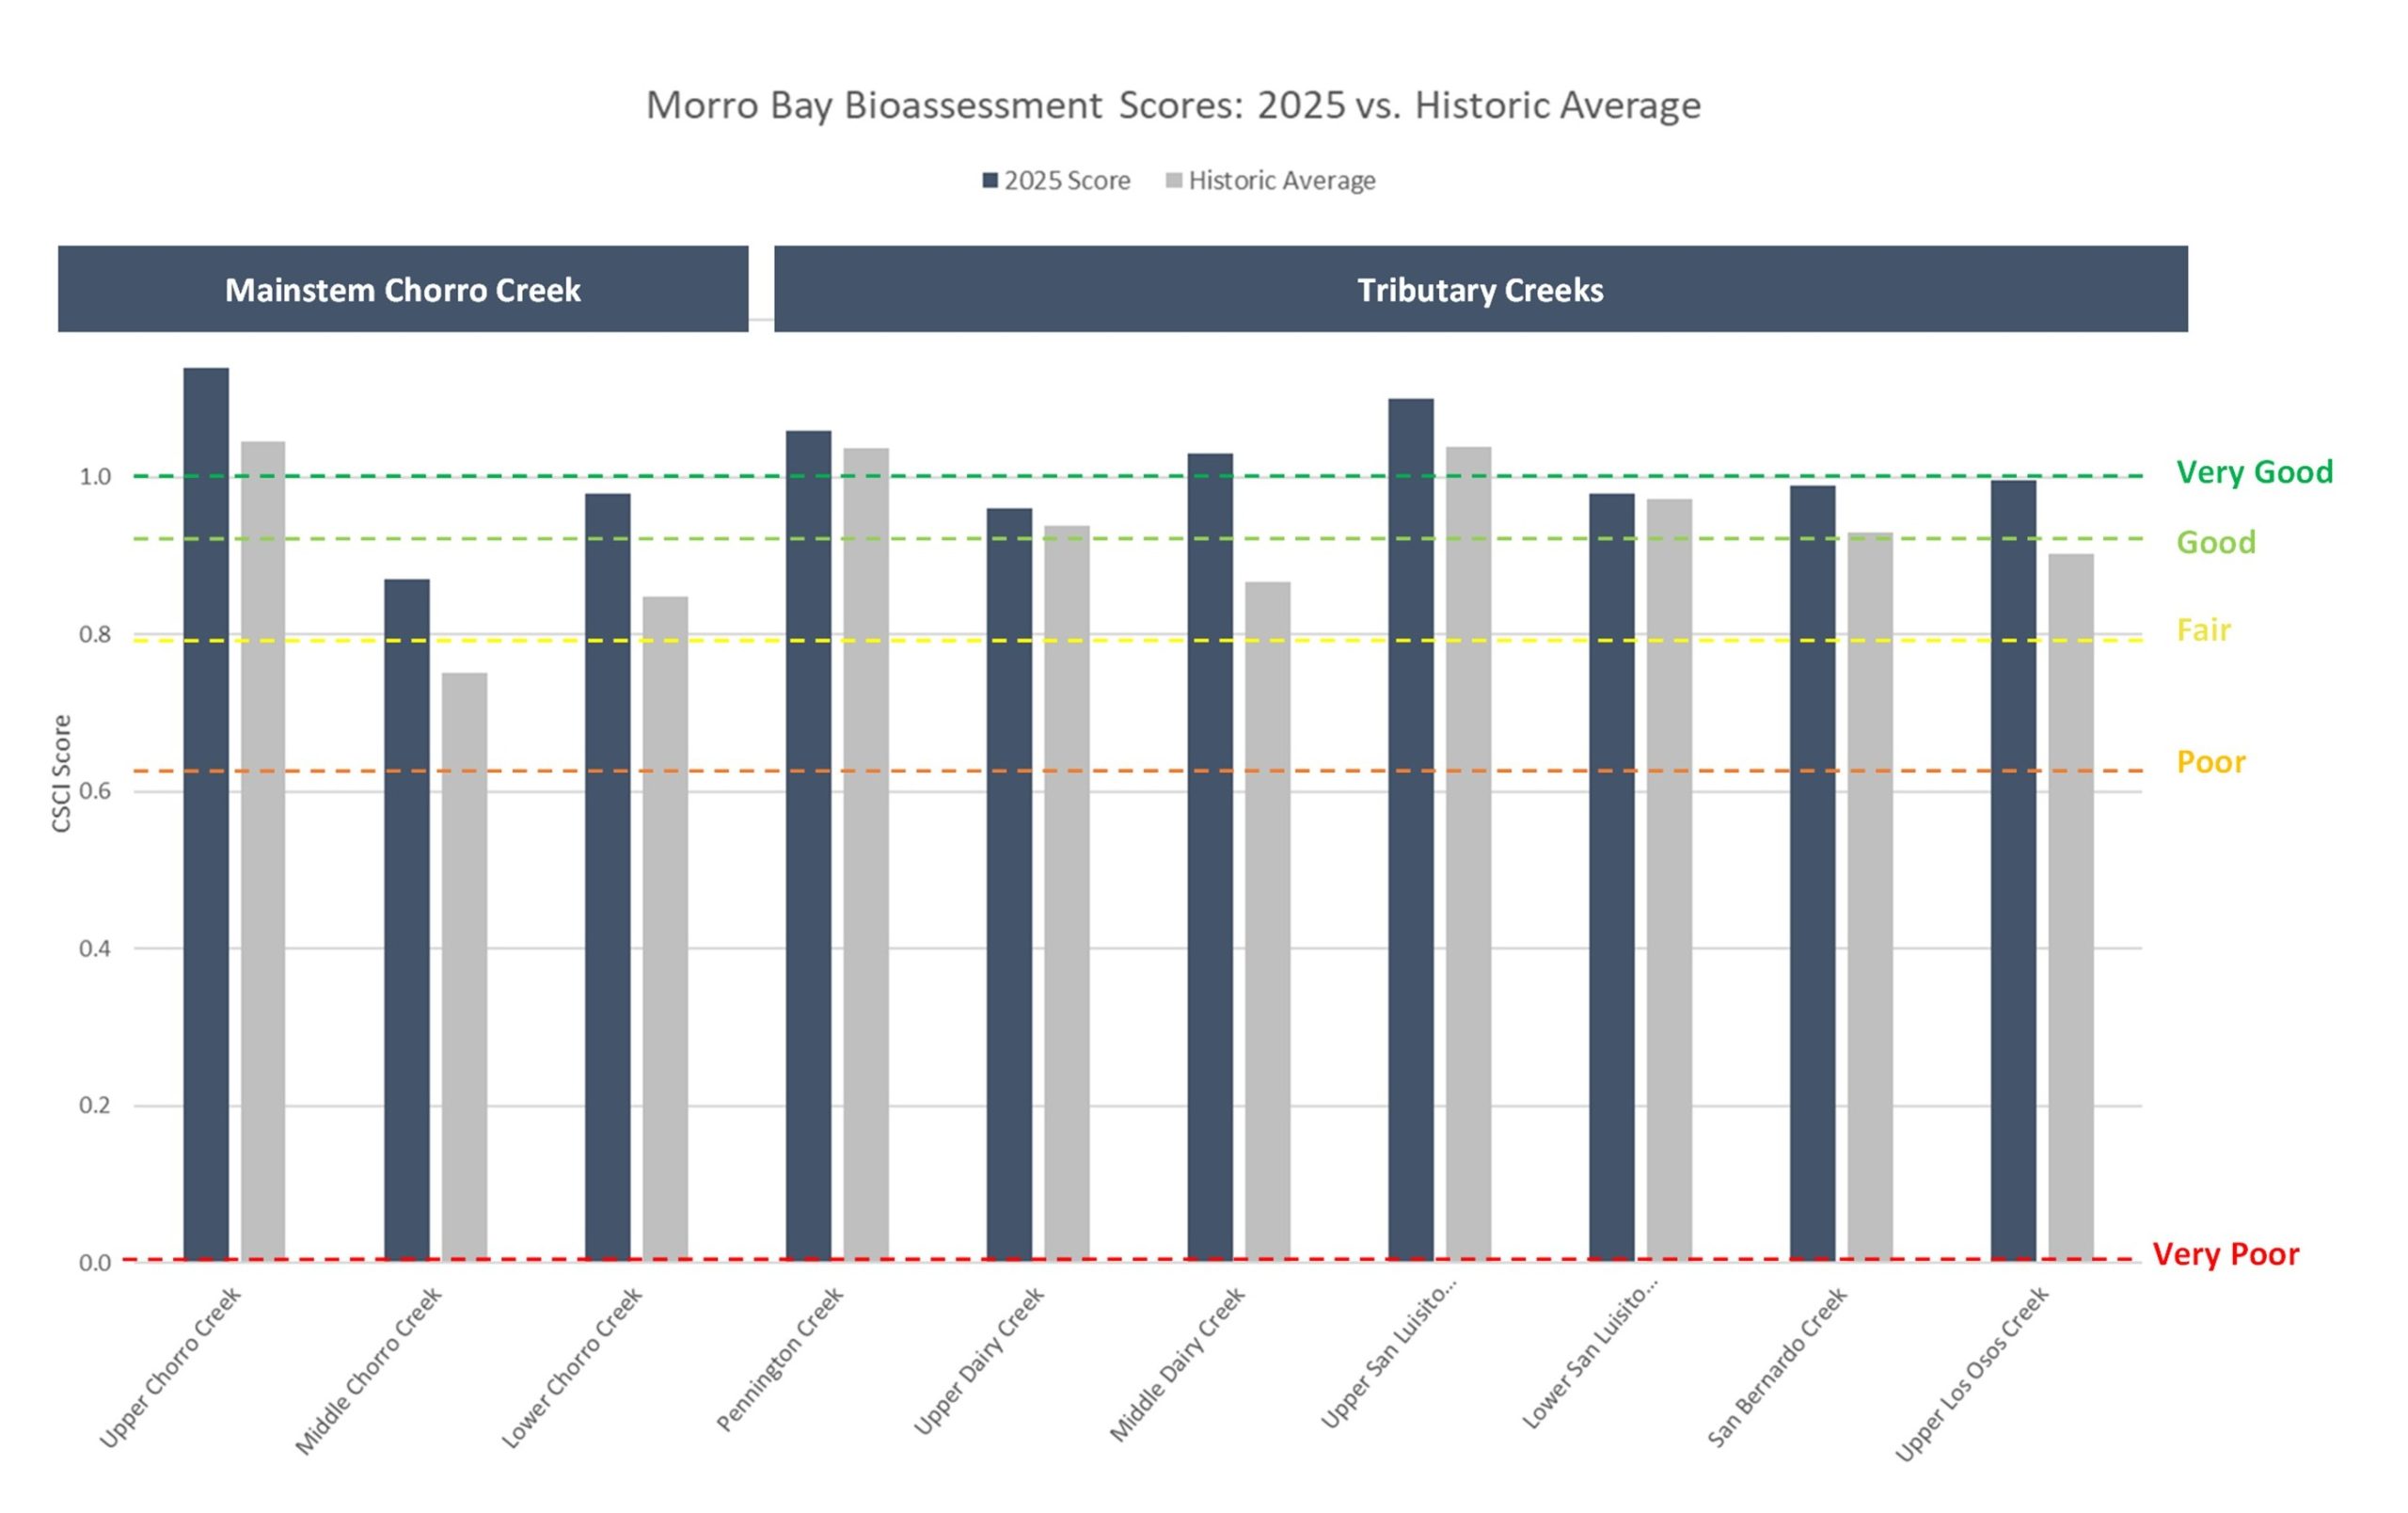
To understand our complex bioassessment results, we use a biological scoring tool called the California Stream Condition Index (CSCI). Based on data collected in the field, each monitoring site is given a CSCI score that describes its health. A higher CSCI score means a healthier stream, while lower scores indicate that the stream may be more degraded. Scores are categorized from “Very Good” to “Very Poor” per the Surface Water Ambient Monitoring Program guidelines.
The results from 2025 reflect intact stream conditions at nine of the ten monitoring sites, with four sites scoring as “Very Good” and five scoring as “Good.” The only site that scored as “Fair” was Middle Chorro Creek. While this site did not score well, the results were still in line with historical averages, meaning that conditions have not gotten worse over time. No sites scored as “Poor” or “Very Poor” during 2025.
Recovering from Past Storms
In 2023, heavy rainfall in the Morro Bay watershed caused flooding, erosion, and large amounts of sediment to be flushed downstream. These conditions scoured creeks and displaced macroinvertebrate communities that live among the rocks at the creek bottom. The most severe impacts were in the smaller tributary creeks. By 2024, many of the tributaries showed significant improvement, with sites like Upper Dairy Creek improving as much as 73%. One site on Upper Los Osos Creek, however, recovered much more slowly, only improving modestly between 2023 and 2024.
Our 2025 results show that Upper Los Osos Creek is finally moving towards recovery, with its score improving from “Fair” in 2024 to “Good” in 2025. This site has shown a similar pattern historically, often taking two to three years to rebound after disturbance. The reasons for its slower recovery aren’t fully understood but may be related to its unique geology and groundwater interactions in Upper Los Osos Creek, which may limit how quickly habitat becomes suitable for macroinvertebrates after large storm events.
What’s Next?
Long-term monitoring efforts like this help us understand how our watershed is changing over time. We can see how the ecosystem responds to events like flooding or droughts and identify areas for conservation or restoration. The Estuary Program is excited to continue annual spring bioassessment surveys in 2026, building a stronger understanding of long-term trends.
Thank You, Harold J. Miossi Trust!
The Harold J. Miossi Charitable Trust has generously supported bioassessment monitoring in the Morro Bay watershed since 2013, contributing more than $154,000 to this important work. With the Trust’s generous support, we have been able to develop a critical dataset that helps us to prioritize conservation and restoration projects and understand changes in creek health over time. To learn more about the Miossi Charitable Trust, please visit https://www.miossicharitabletrust.org/.