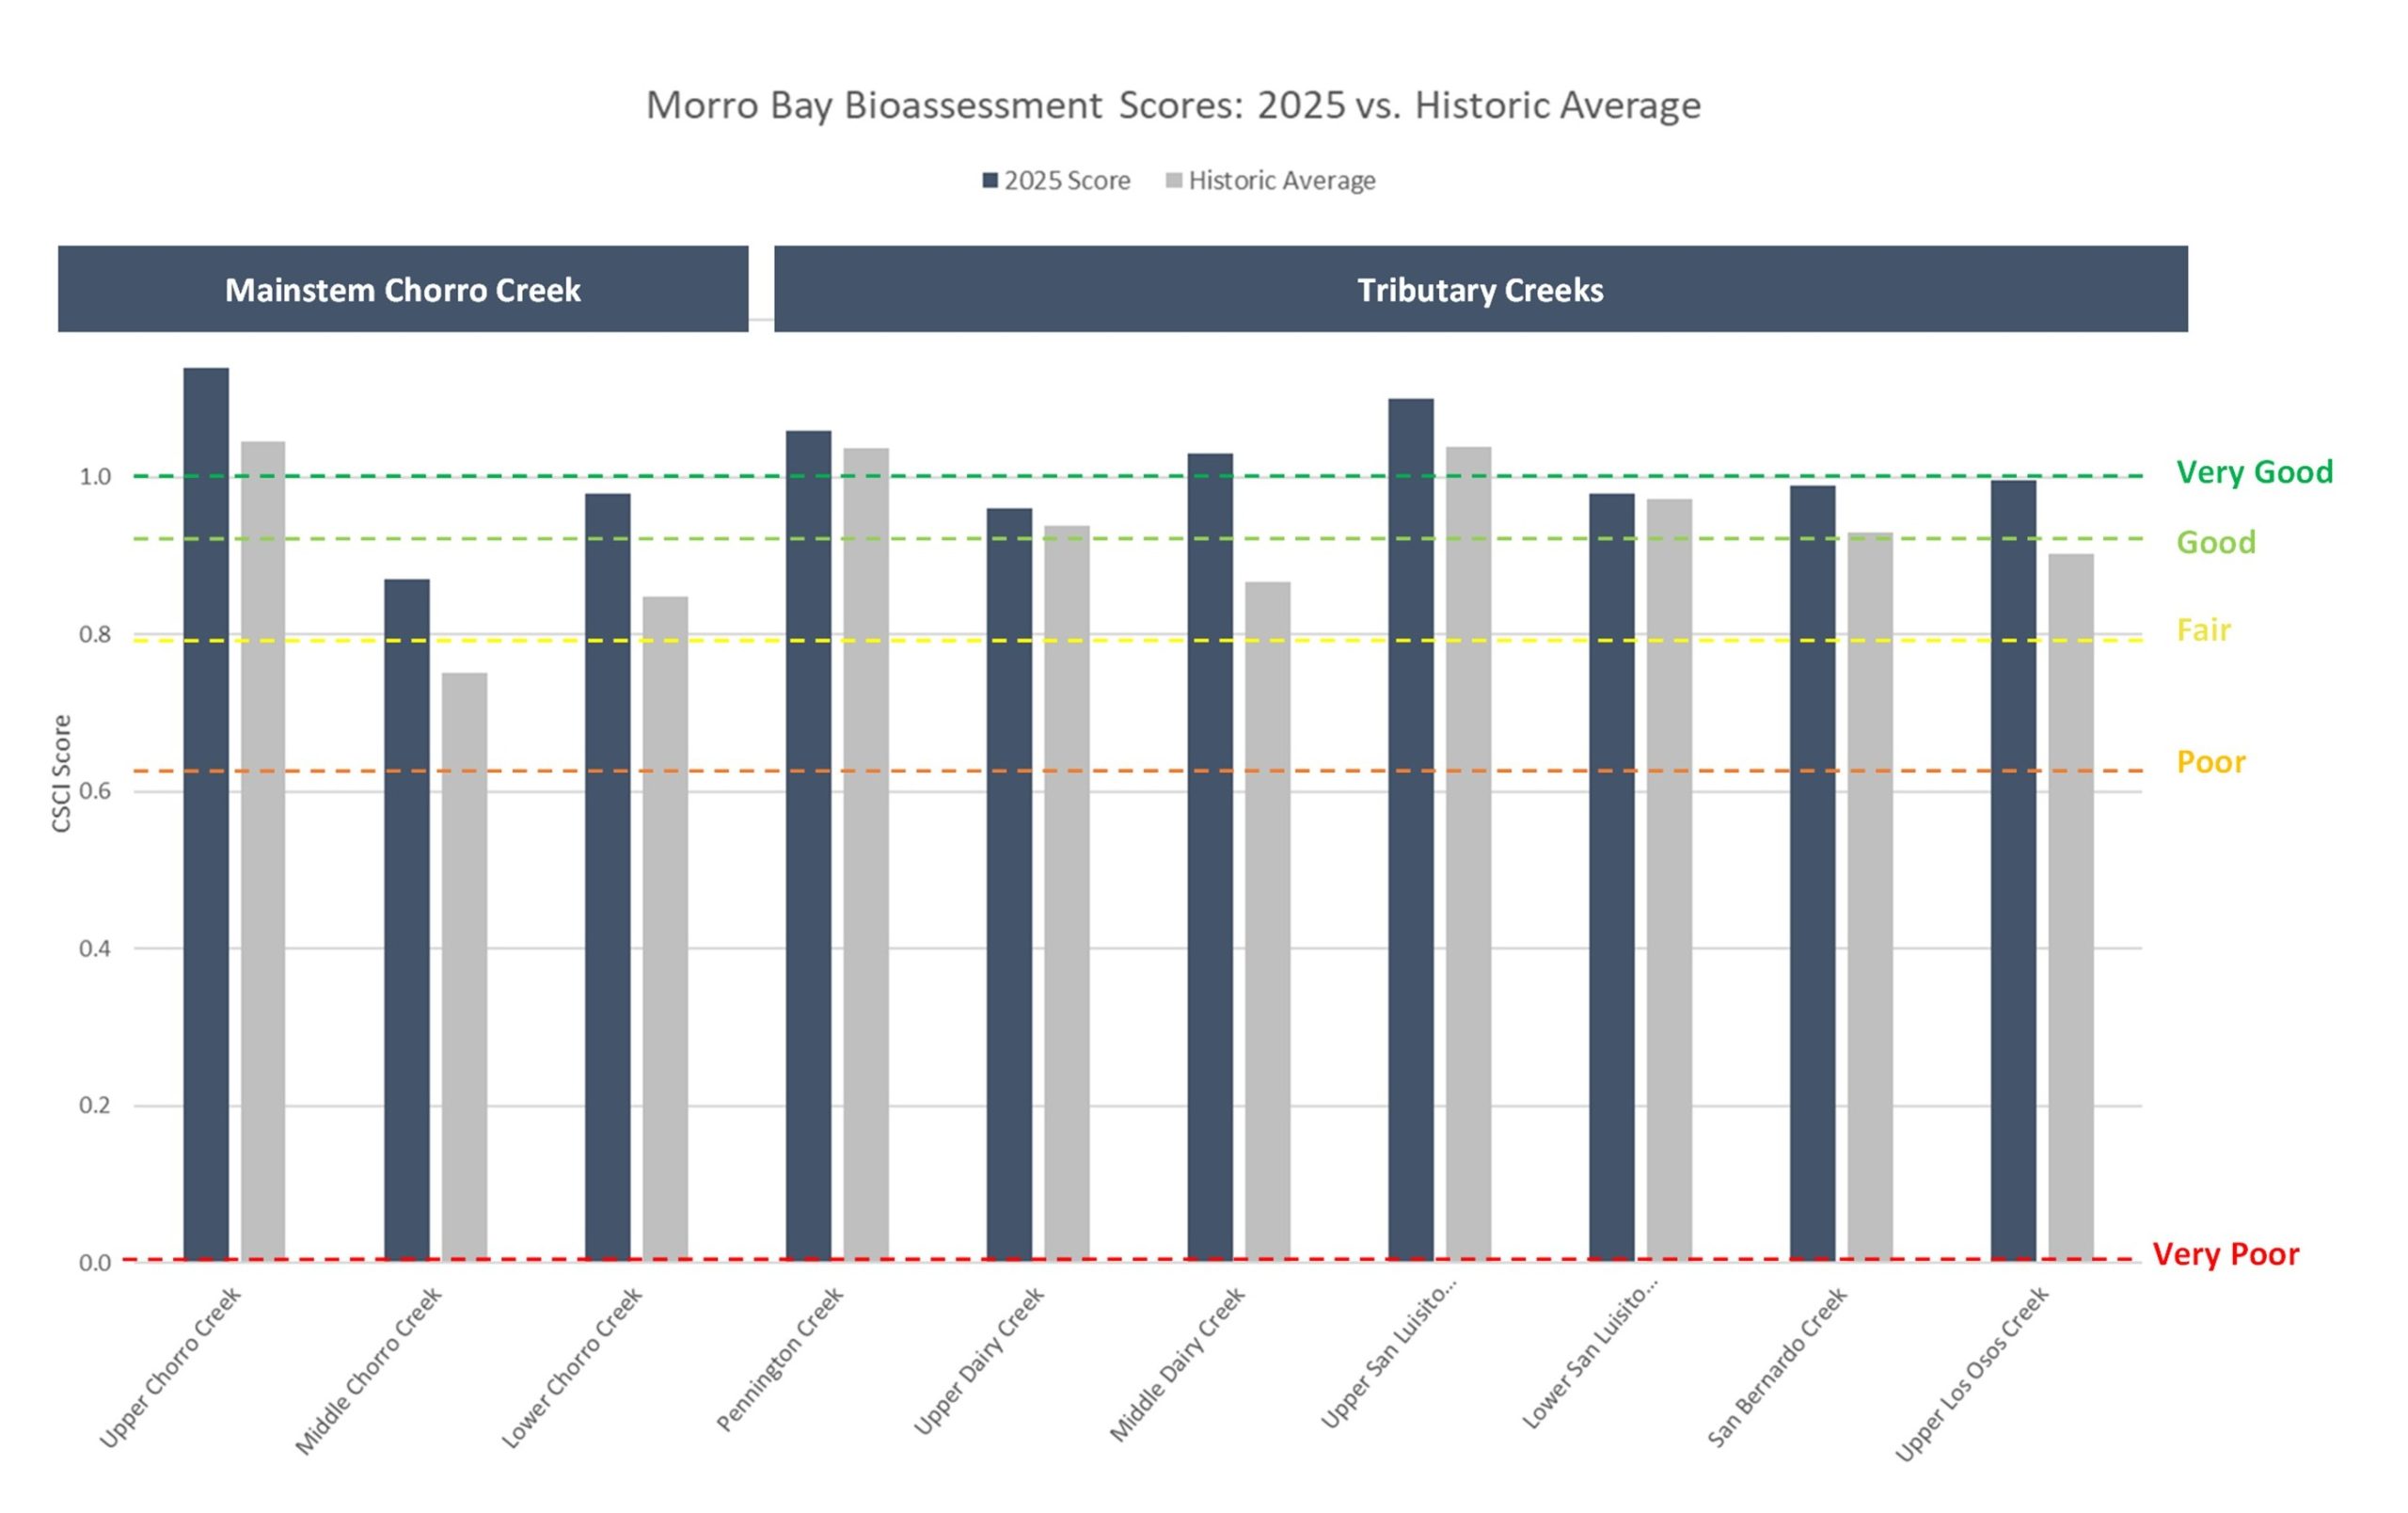
The graph illustrates scores from ten sites monitored in the Morro Bay watershed during 2025 (dark blue) alongside their average historical score (gray). In general, the 2025 scores were in line or slightly higher than the average scores.
Enter your email address to subscribe to this blog and receive notifications of new posts by email.
Email Address
Subscribe