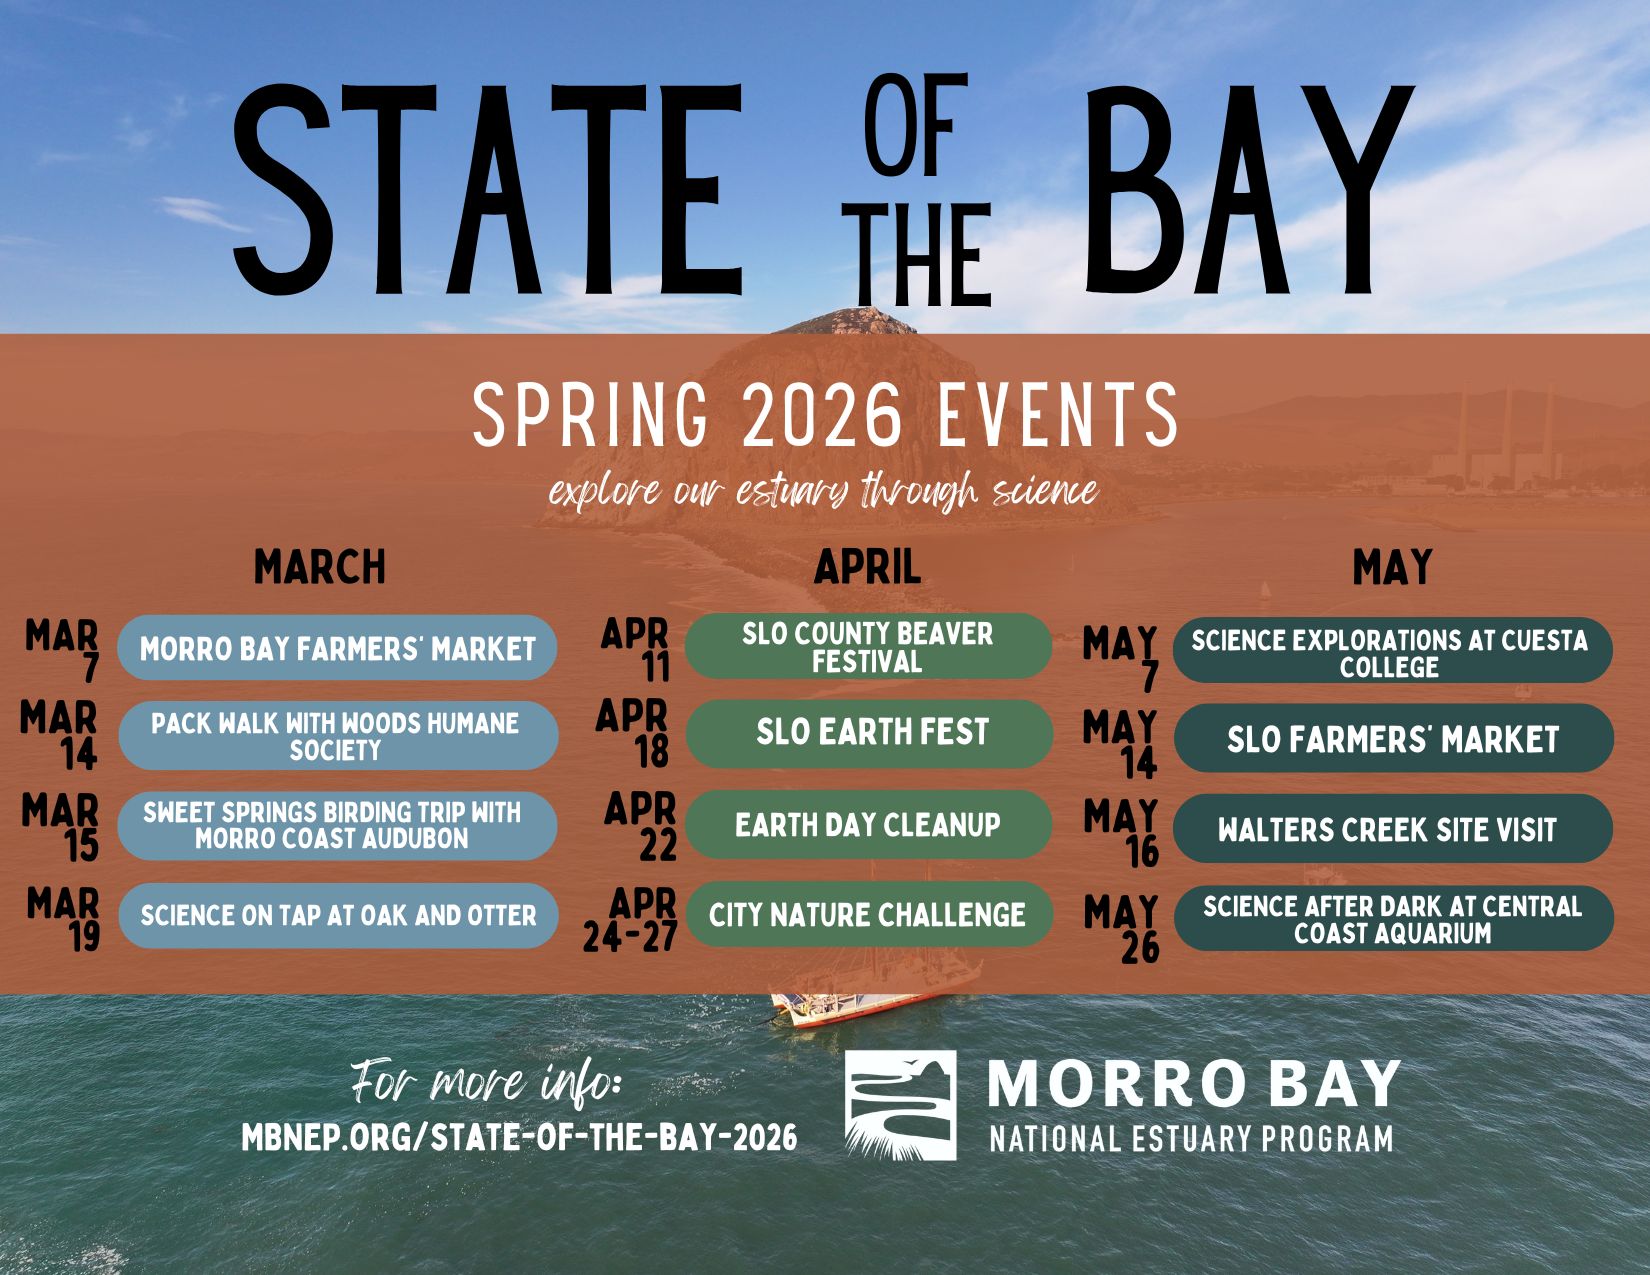
Every three years, our State of the Bay report highlights recent trends and conditions in Morro Bay and the creeks that drain into it. In this blog, we take a closer look at results from our 2026 report related to creek health. For a more detailed look at the data, please visit our 2026 State of the Bay online report.
Bugs Tell the Story
Each spring, the Estuary Program conducts freshwater bioassessment monitoring throughout the Morro Bay watershed. Bioassessment surveys involve taking measurements of the creek habitat and collecting macroinvertebrates, which are insects invisible to the naked eye. The types of macroinvertebrates we find tell us about creek water quality, since some species are very sensitive to pollution and others are more tolerant to pollution. Creeks with a diverse community of sensitive macroinvertebrates likely have good water quality. On the flip side, creeks with only pollution-tolerant species are likely to have poorer water quality.
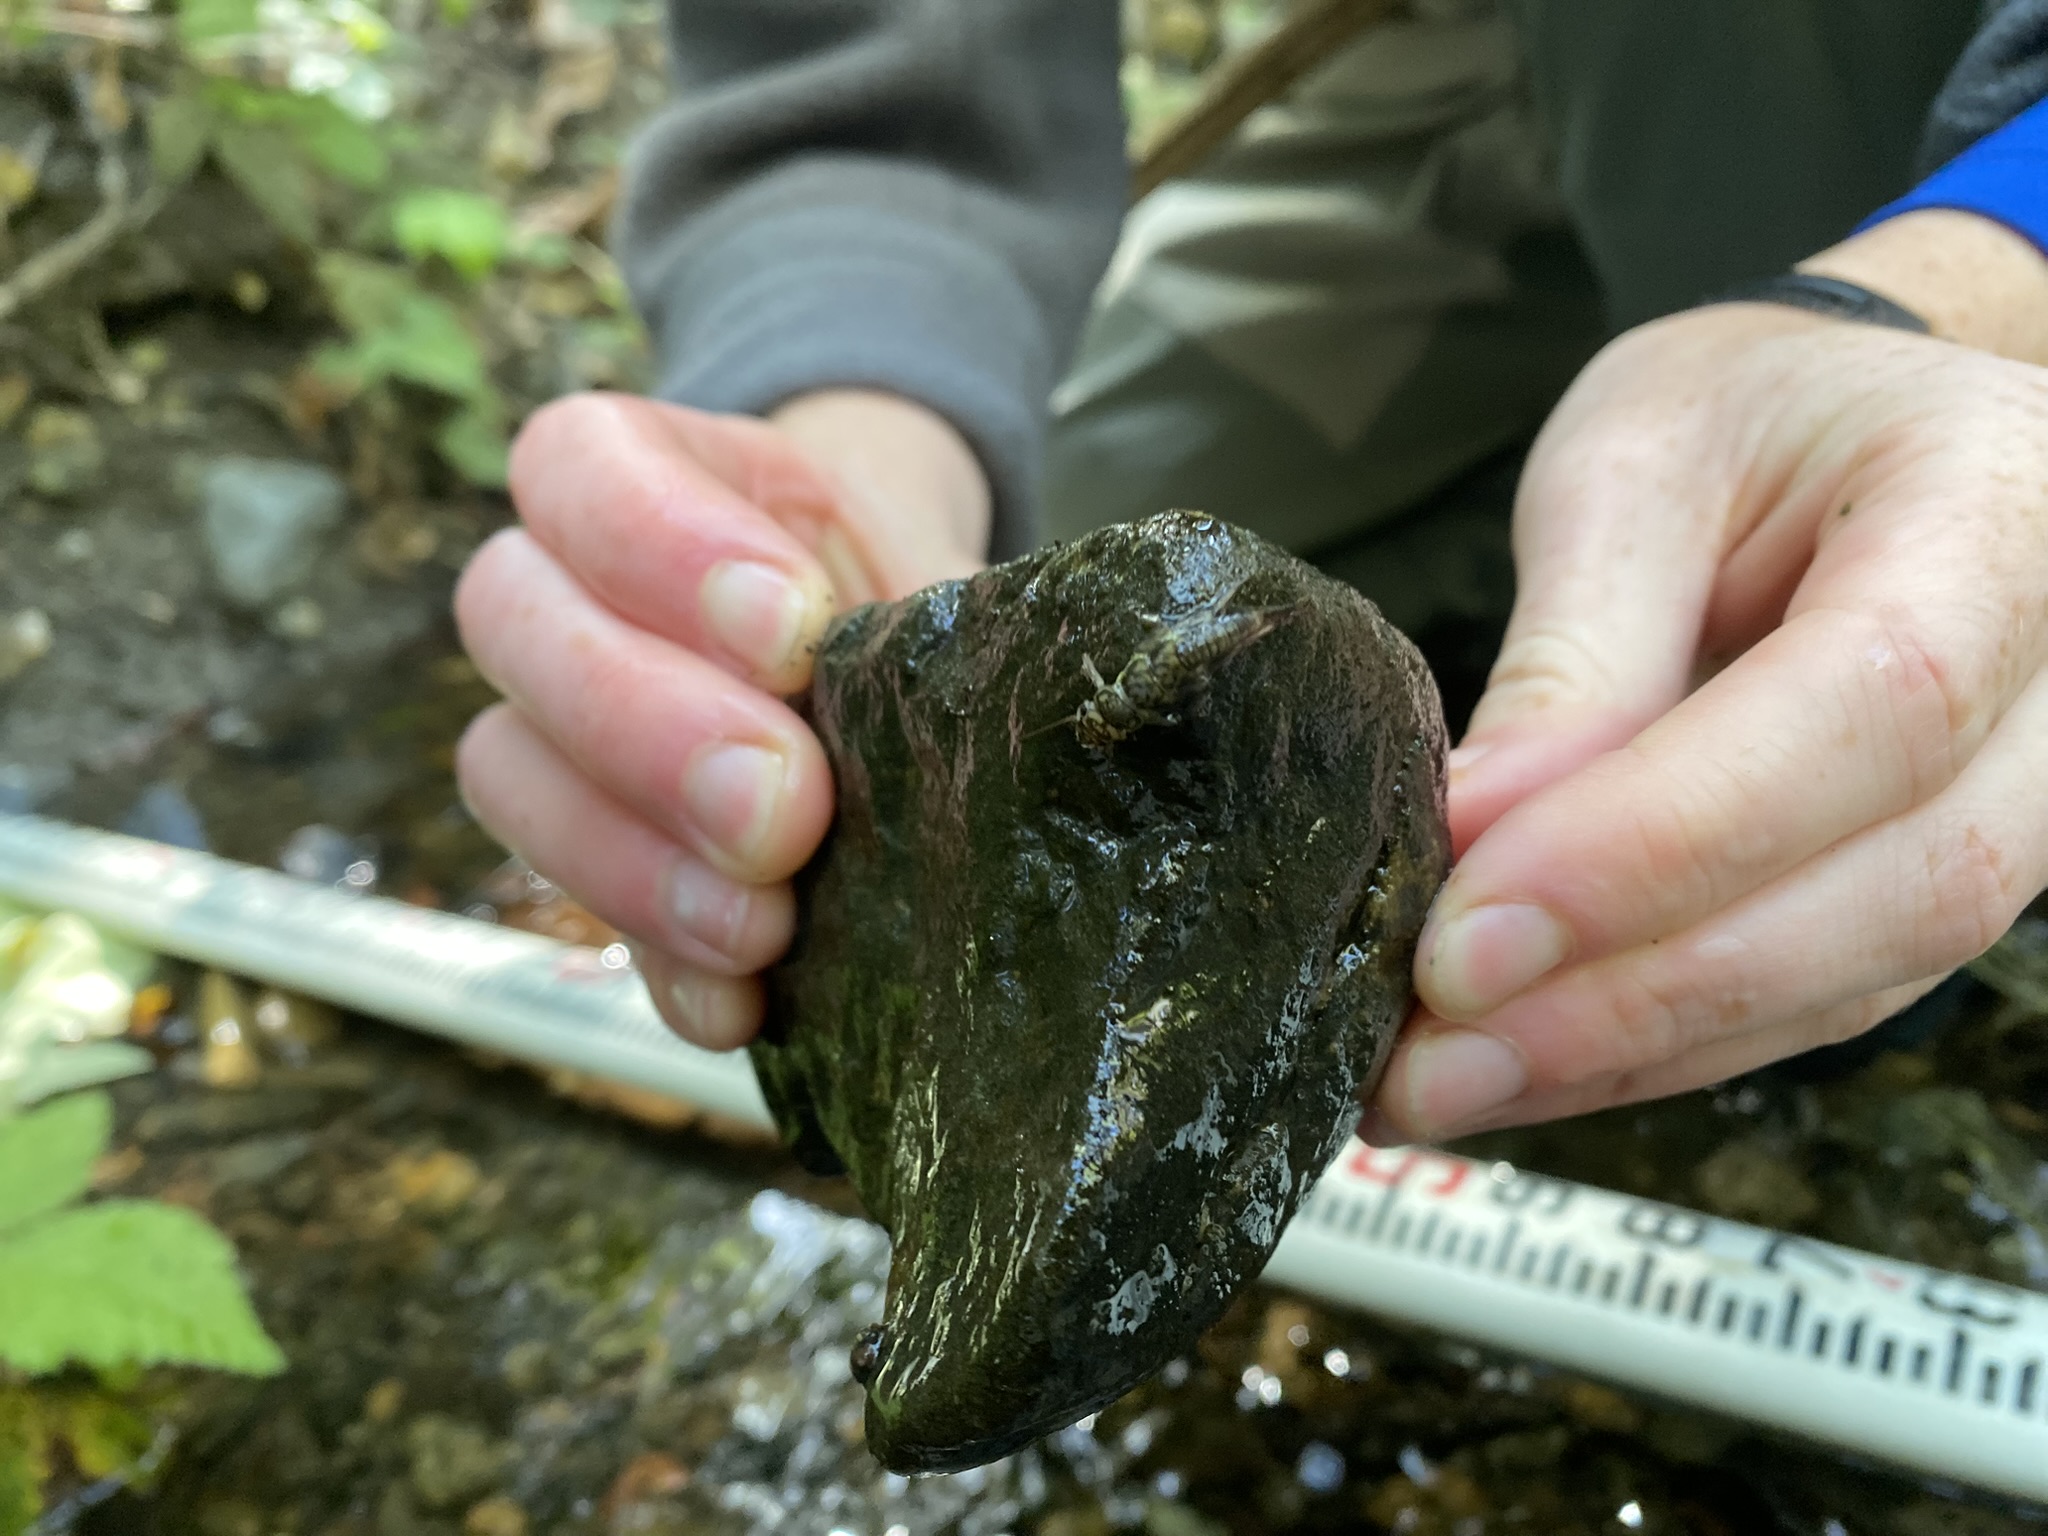
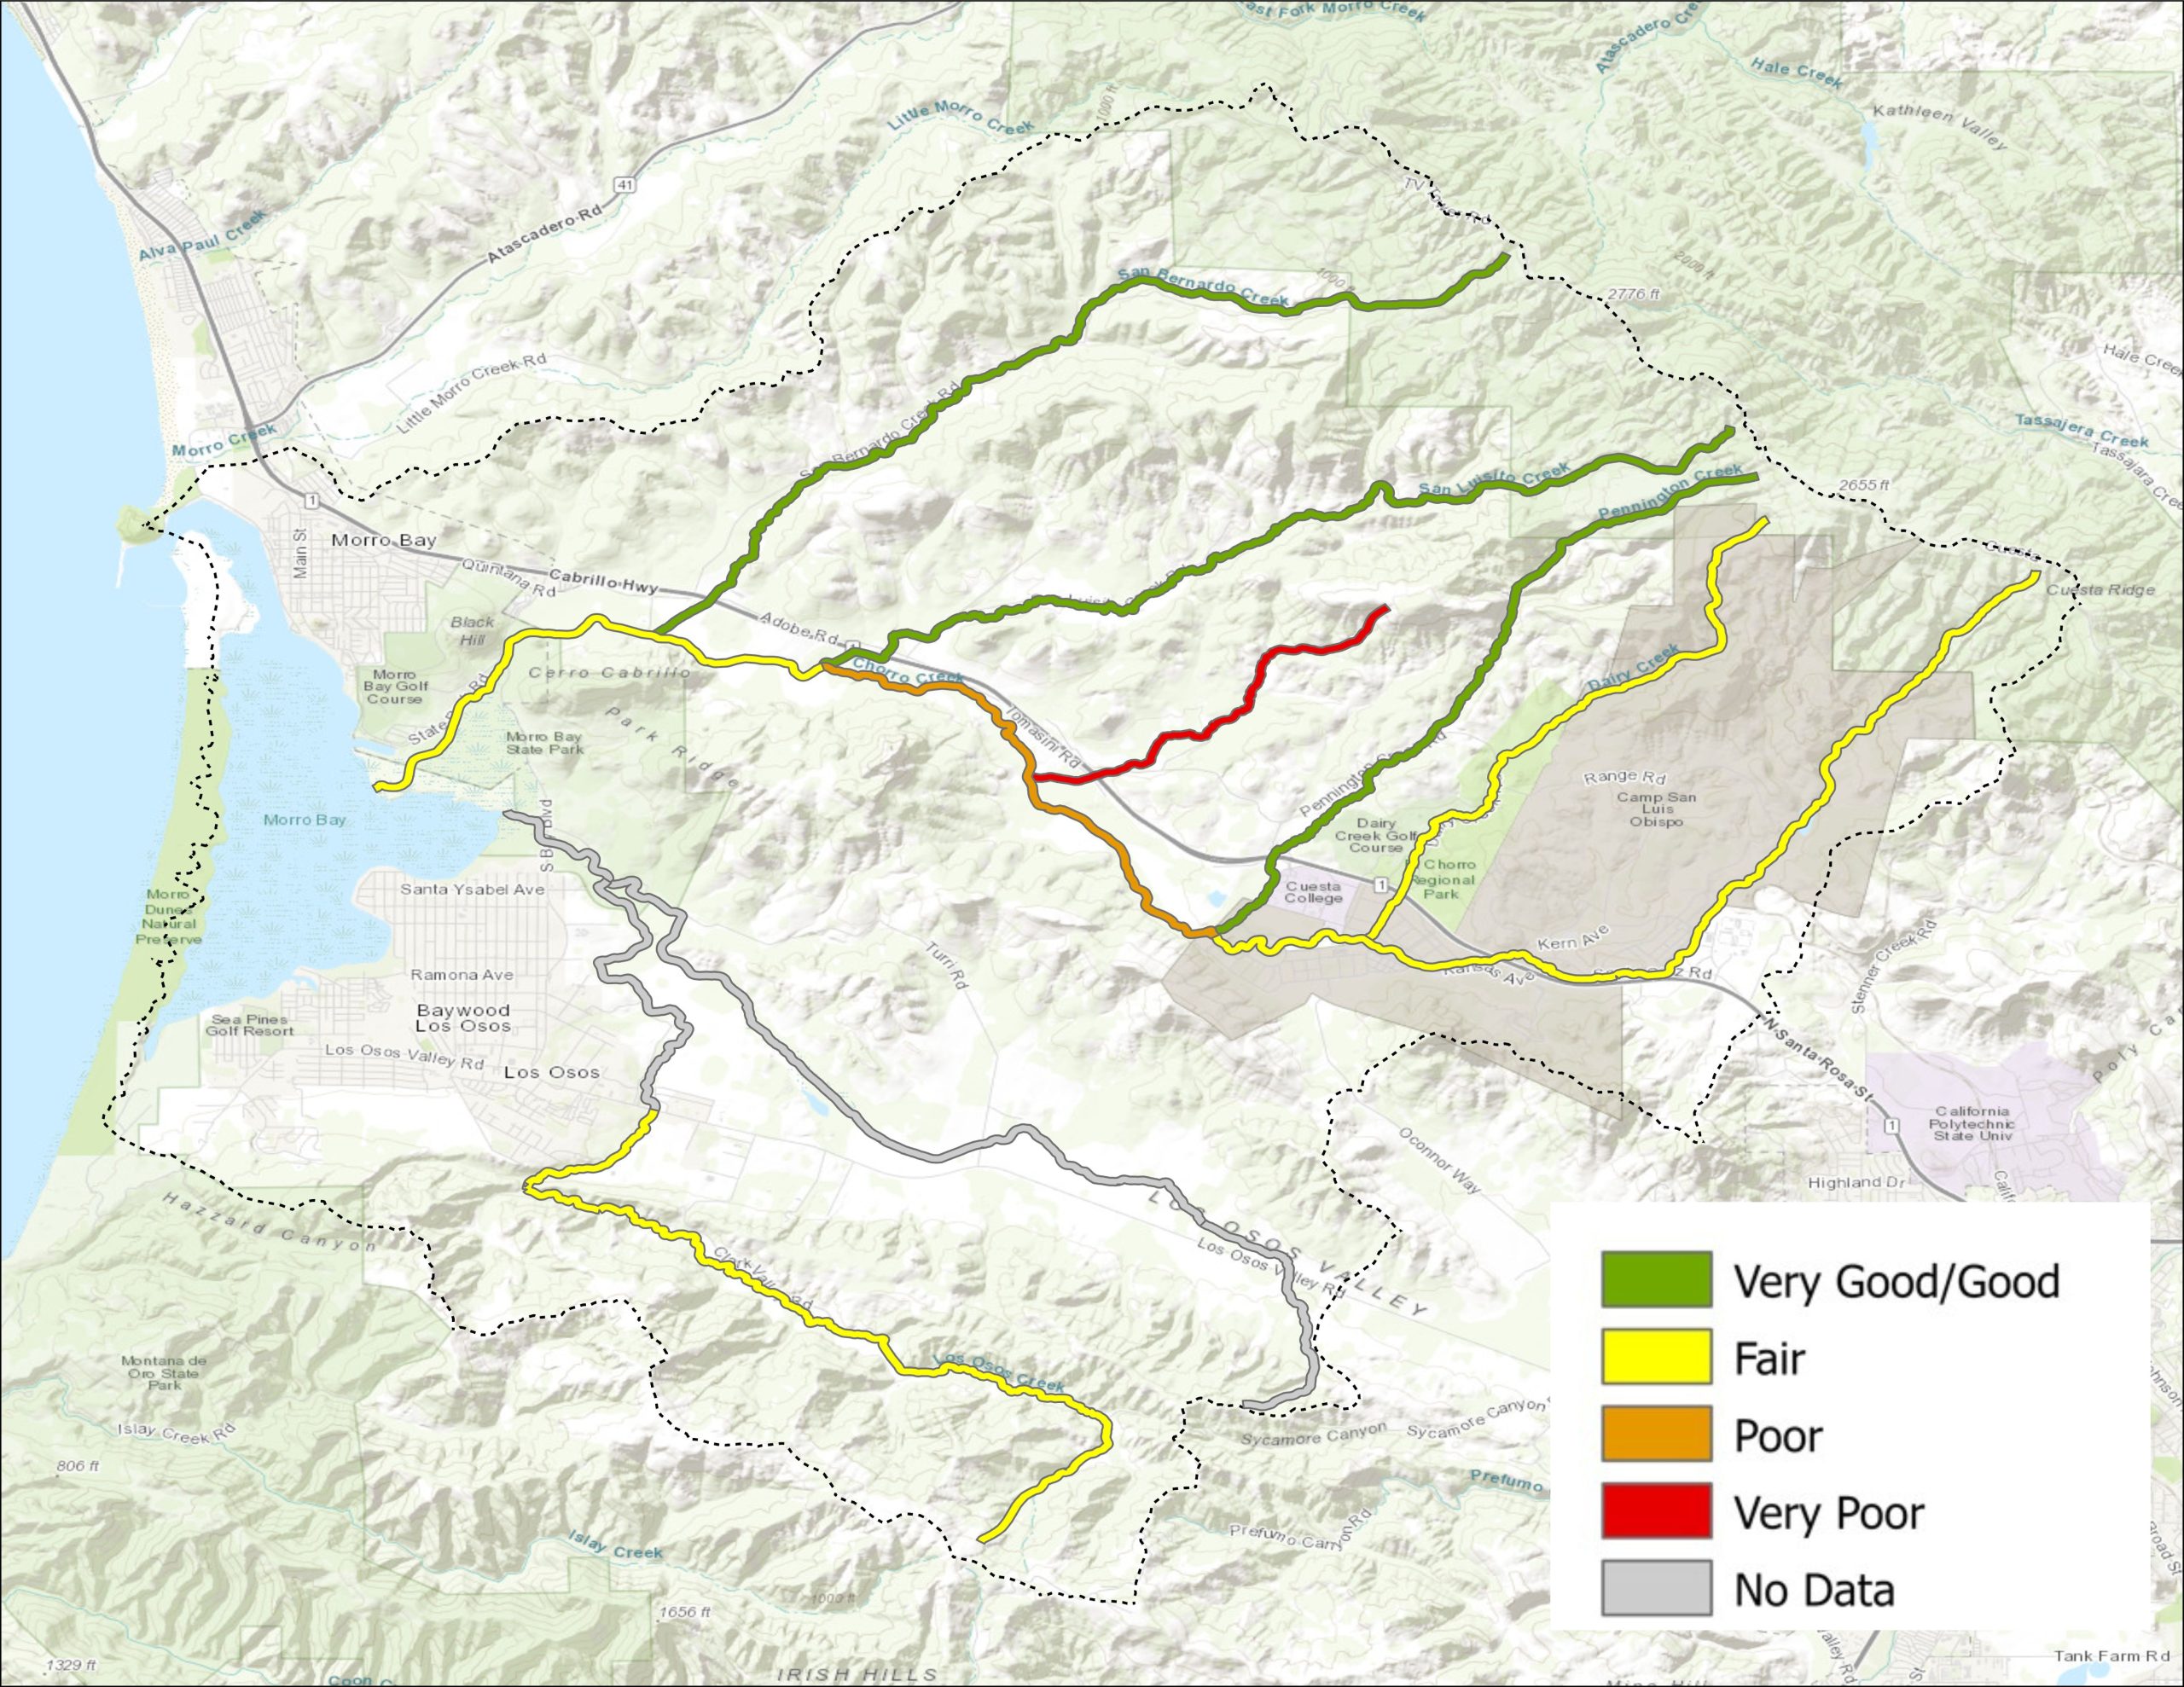
The macroinvertebrates we collect during spring bioassessment monitoring help us assess changes in creek health over time. The Estuary Program uses an assessment tool called the California Stream Condition Index (CSCI), which allows us to take complex biological data and transform it into an overall measure of stream health. Using the CSCI, we score our monitoring sites as ‘Good’, ‘Fair’, ‘Poor’ or ‘Very Poor,’ as seen in the map below.
Recovering After Winter 2023
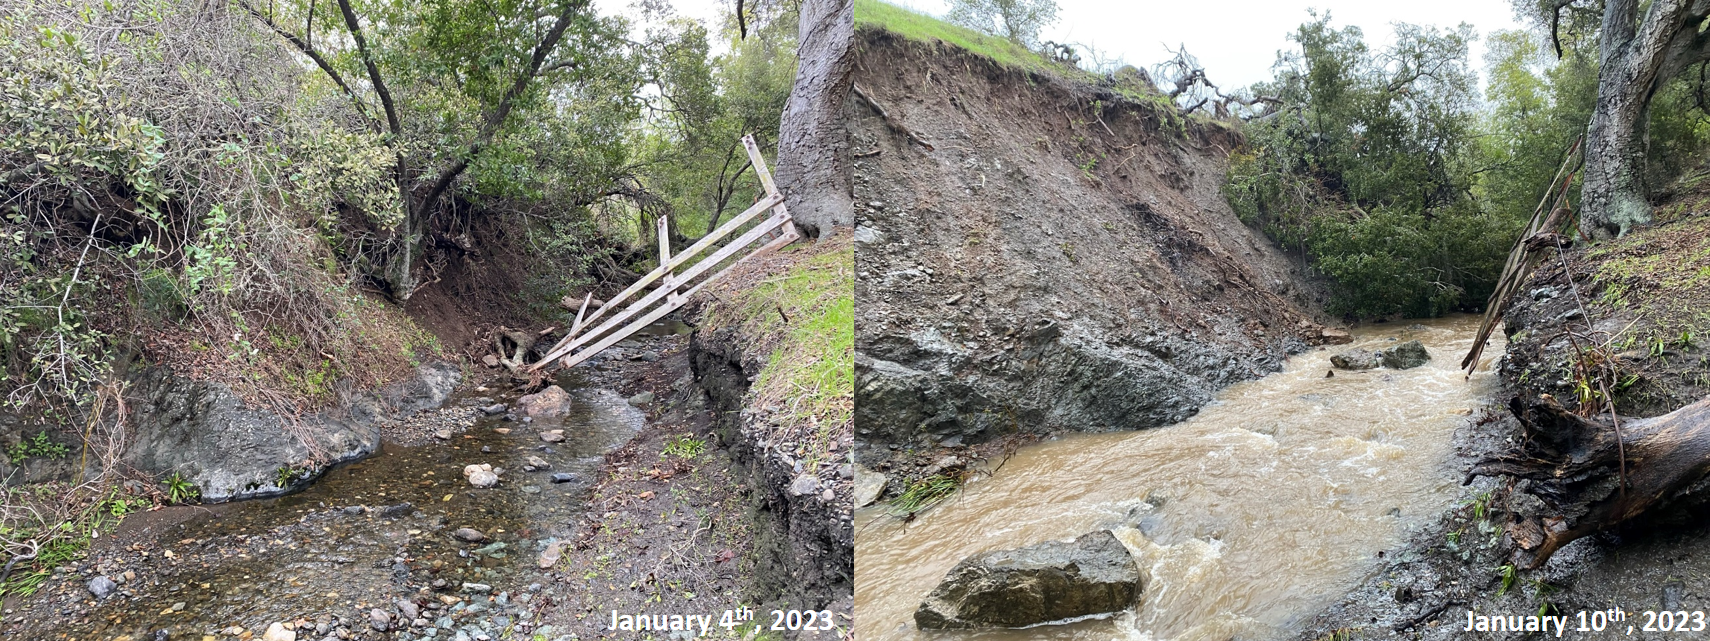
Storm events can have big impacts on creek-dwelling macroinvertebrates. While lower-intensity storms can benefit macroinvertebrates by clearing away sediment, high-intensity storms and flooding can completely alter their habitat, making it challenging for sensitive species to thrive. Following the large storms of January 2023, creek health scores in the Morro Bay watershed indicated high levels of disturbance, especially in the tributaries of Pennington, San Bernardo, and Dairy Creeks. The series of photos below illustrates how the storms of January 2023 affected Pennington Creek.
By 2024, many of the tributaries showed significant improvement, with sites like Upper Dairy Creek improving as much as 73%. One site on Upper Los Osos Creek, however, recovered much more slowly, with scores improving by only 22% between 2023 and 2024.
Our 2025 results show that Upper Los Osos Creek is finally moving towards recovery, with its score improving from ‘Fair’ in 2024 to ‘Good’ in 2025. This site has shown a similar pattern historically, often taking two to three years to rebound after disturbance. The reasons for its slower recovery aren’t fully understood but may be related to its unique geology and groundwater interactions in Upper Los Osos Creek, which may limit how quickly habitat becomes suitable for macroinvertebrates after large storm events.
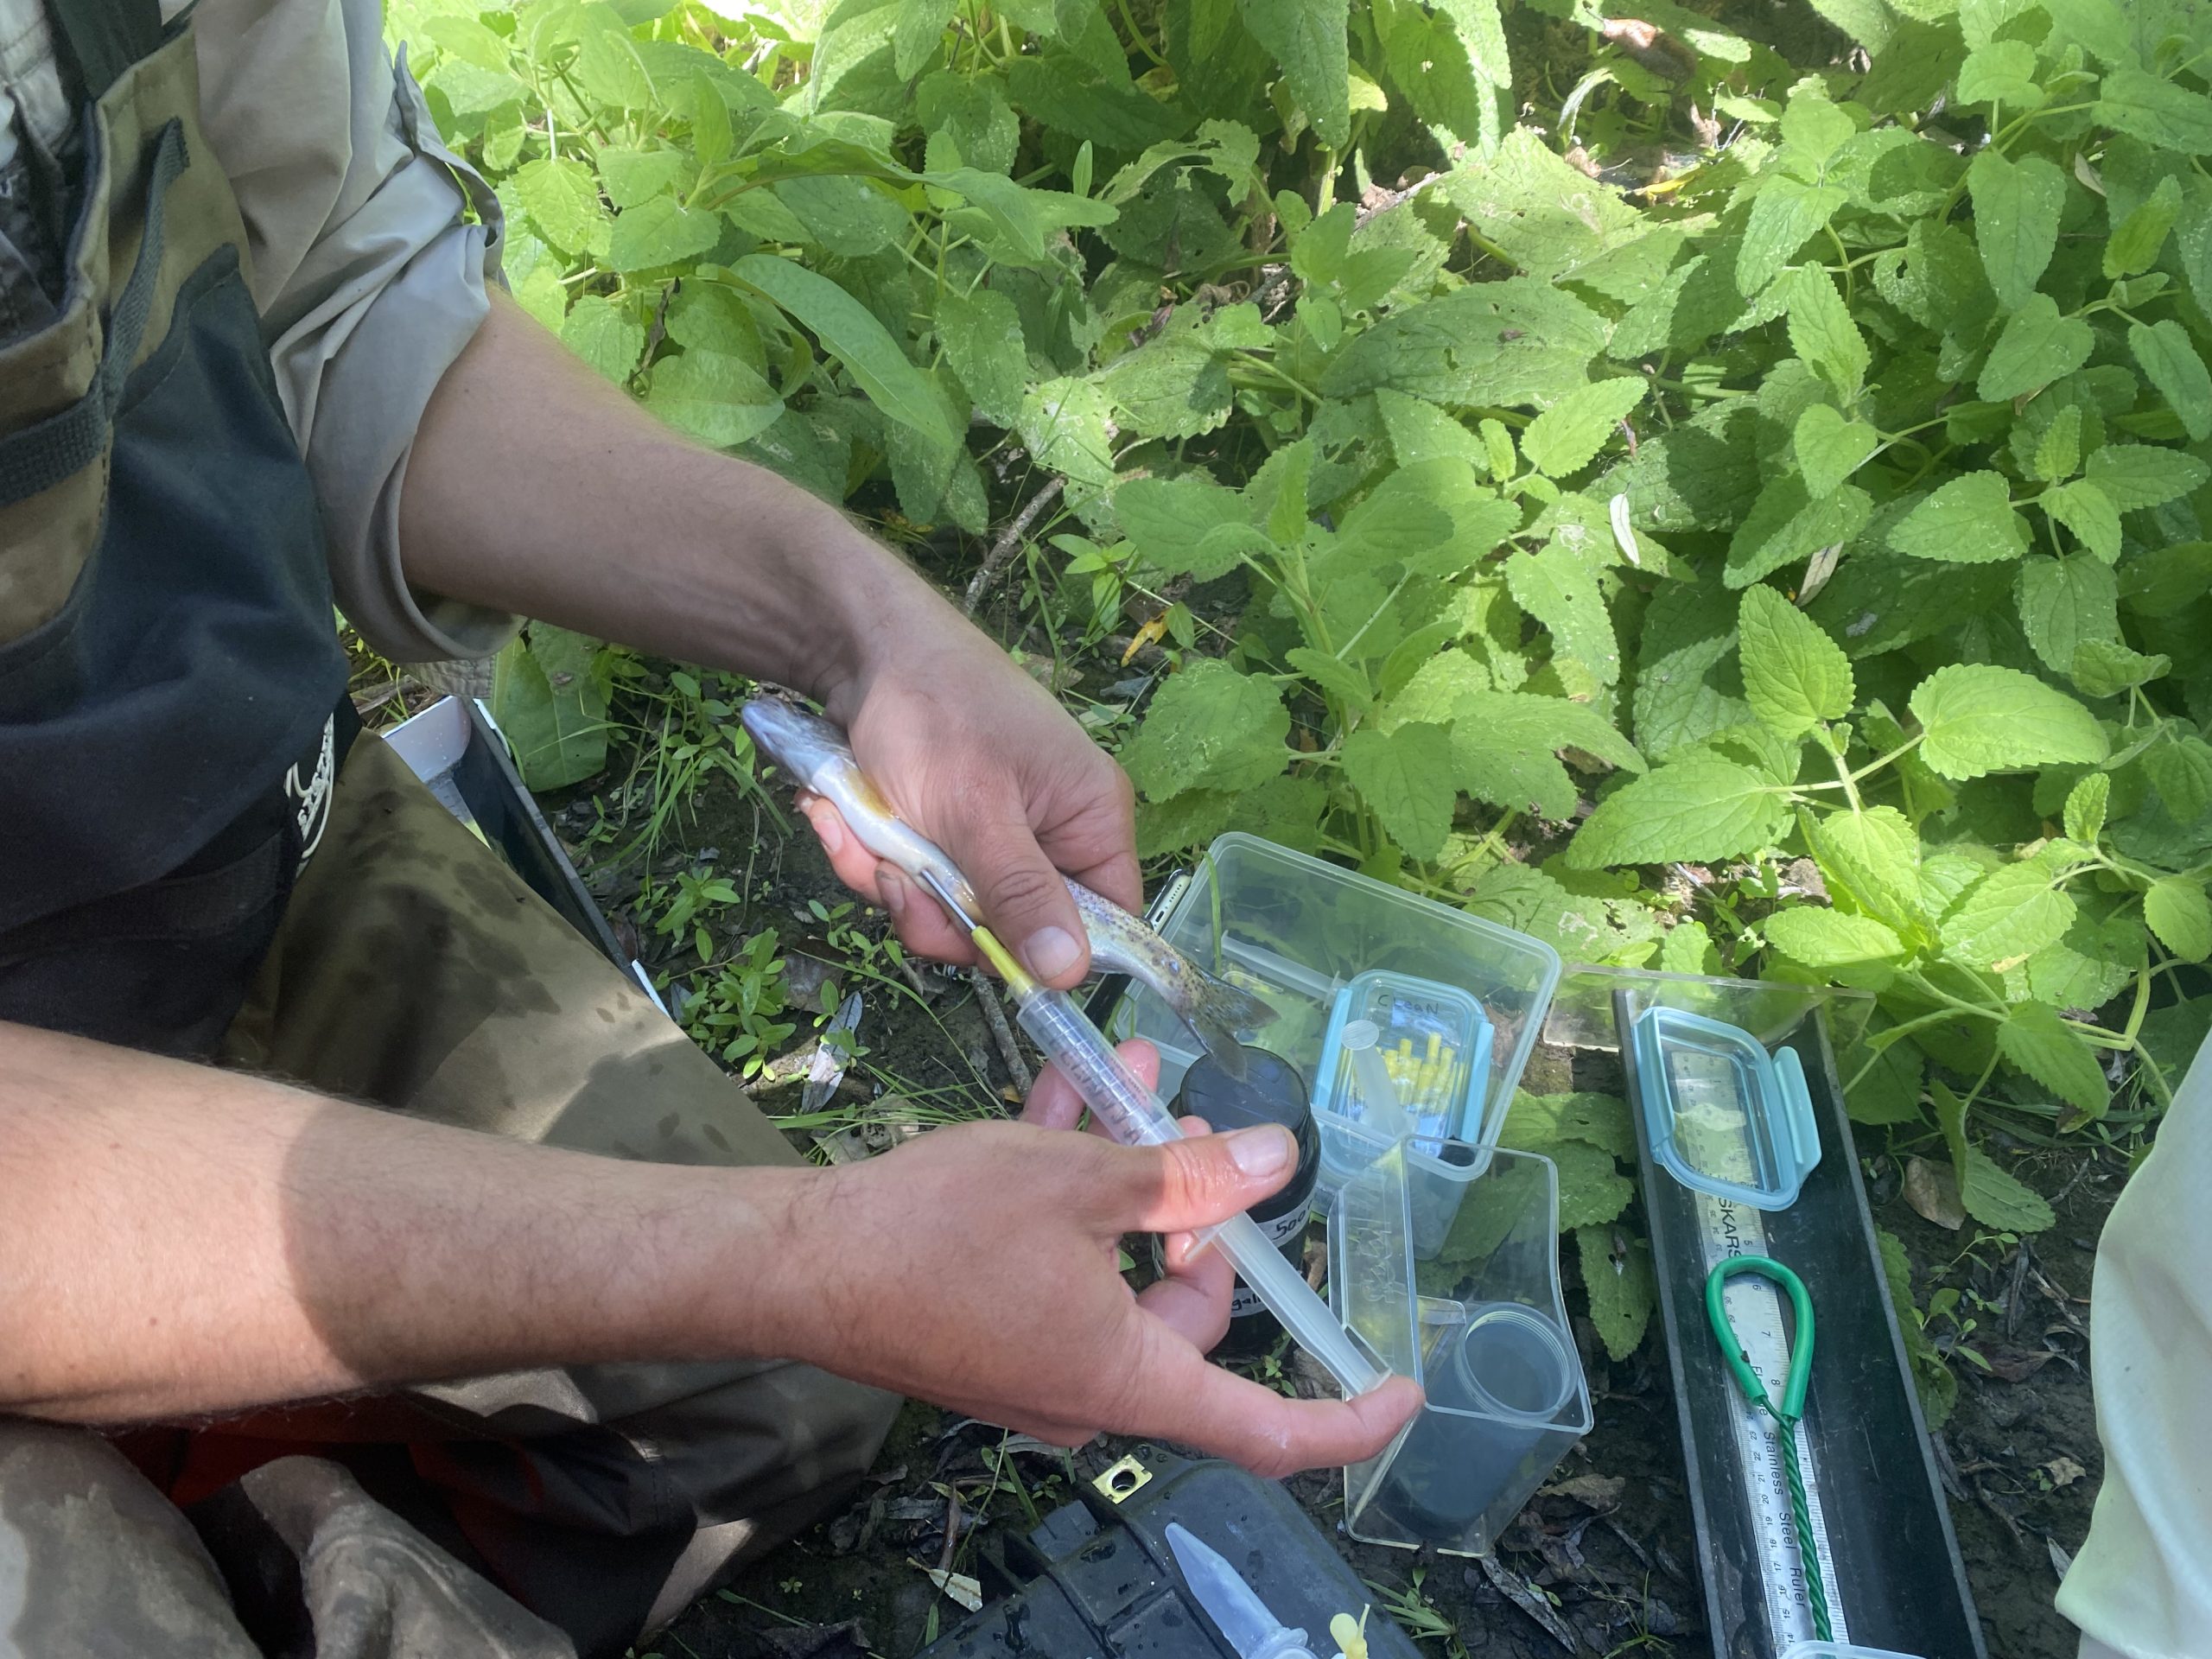
Tracking Steelhead in Chorro Creek
The Morro Bay watershed is home to a unique species of fish called Oncorhynchus mykiss, also known as steelhead or rainbow trout. While some O. mykiss spend their entire lifecycle in freshwater creeks (known as resident rainbow trout), others, known commonly as steelhead, spend a few years in freshwater and estuarine environments before journeying to the ocean. Whether a fish becomes a steelhead or remains a resident rainbow depends on genetic and environmental factors.
The Estuary Program recently completed a two-year study to track steelhead in Chorro Creek, a primary tributary to Morro Bay. Results from this study support our understanding of steelhead growth, habitat use, and migration timing. The data also helps us to identify times of year when fish require adequate water flowing through creeks to migrate and when we should avoid certain activities that might interfere with their movement.
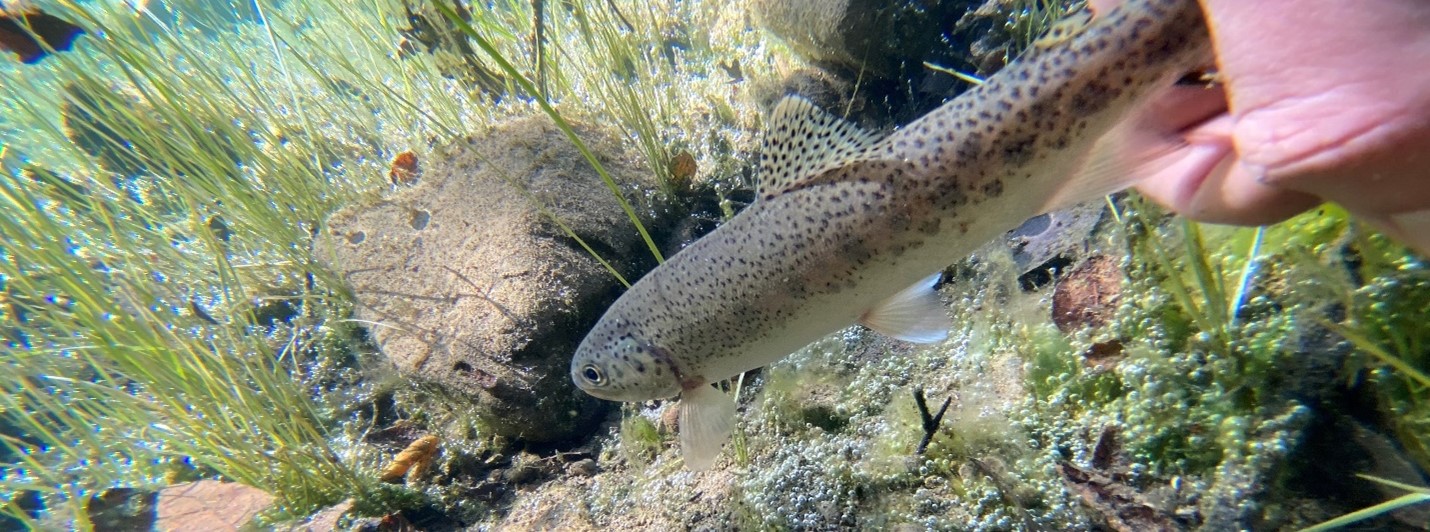
A total of 1,225 steelhead trout were captured during the study, and 870 were large enough to tag with a Passive Integrated Transponder (PIT) tag. Of the 201 tagged fish, nearly 60% were likely resident trout that would spend their entire lifespan in the creeks. The remaining fish transitioned from freshwater to saltwater habitat, primarily between January and April. Most fish that left the creeks did not return, although a handful moved back and forth between lower Chorro Creek and the estuary. This study provided fascinating new information, and we hope to expand the effort to better understand how steelhead utilize freshwater tributaries like San Bernardo, Pennington, and Dairy Creeks.
Want to Learn More?
This information was compiled for our triennial State of the Bay Report. To learn more, please visit our State of the Bay online report, or our State of the Bay Data Dashboard. We will also be hosting a series of events from March through May to share these results and more from local partners.
To learn more, visit our State of the Bay events page at www.mbnep.org/events.
References
Benthic Macroinvertebrate Bioassessment Data Summary Memo 2024: https://library.mbnep.org/wp-content/uploads/2025/06/Benthic-Macroinvertebrate-Bioassessment-Memo-2024_FINAL.pdf
Morro Bay Watershed Creek Health Memo For Water Year 2024: https://library.mbnep.org/wp-content/uploads/2025/09/Morro-Bay-Watershed-Creek-Health-WY2024_FINAL-1.pdf
Help us protect and restore the Morro Bay estuary!
- Donate to the Estuary Program today and support our work in the field, the lab, and beyond.
The Estuary Program is a 501(c)3 nonprofit. We depend on funding from grants and generous donors to continue our work. - Support us by purchasing estuary-themed gear from ESTERO. This locally owned and operated company donates 20% of proceeds from its Estuary clothing line and 100% of Estuary decal proceeds to the Estuary Program. Thank you, ESTERO!
- Purchase items from the Estuary Program’s store on Zazzle. Zazzle prints and ships your items, and the Estuary Program receives 10% of the proceeds.
- Subscribe to our seasonal newsletter: Between the Tides!
- We want to hear from you! Please take a few minutes to fill out this short survey about what type of events you’d like to see from the Estuary Program. We appreciate your input!