Extreme Precipitation Events by Water Year, Morro Bay National Estuary Program
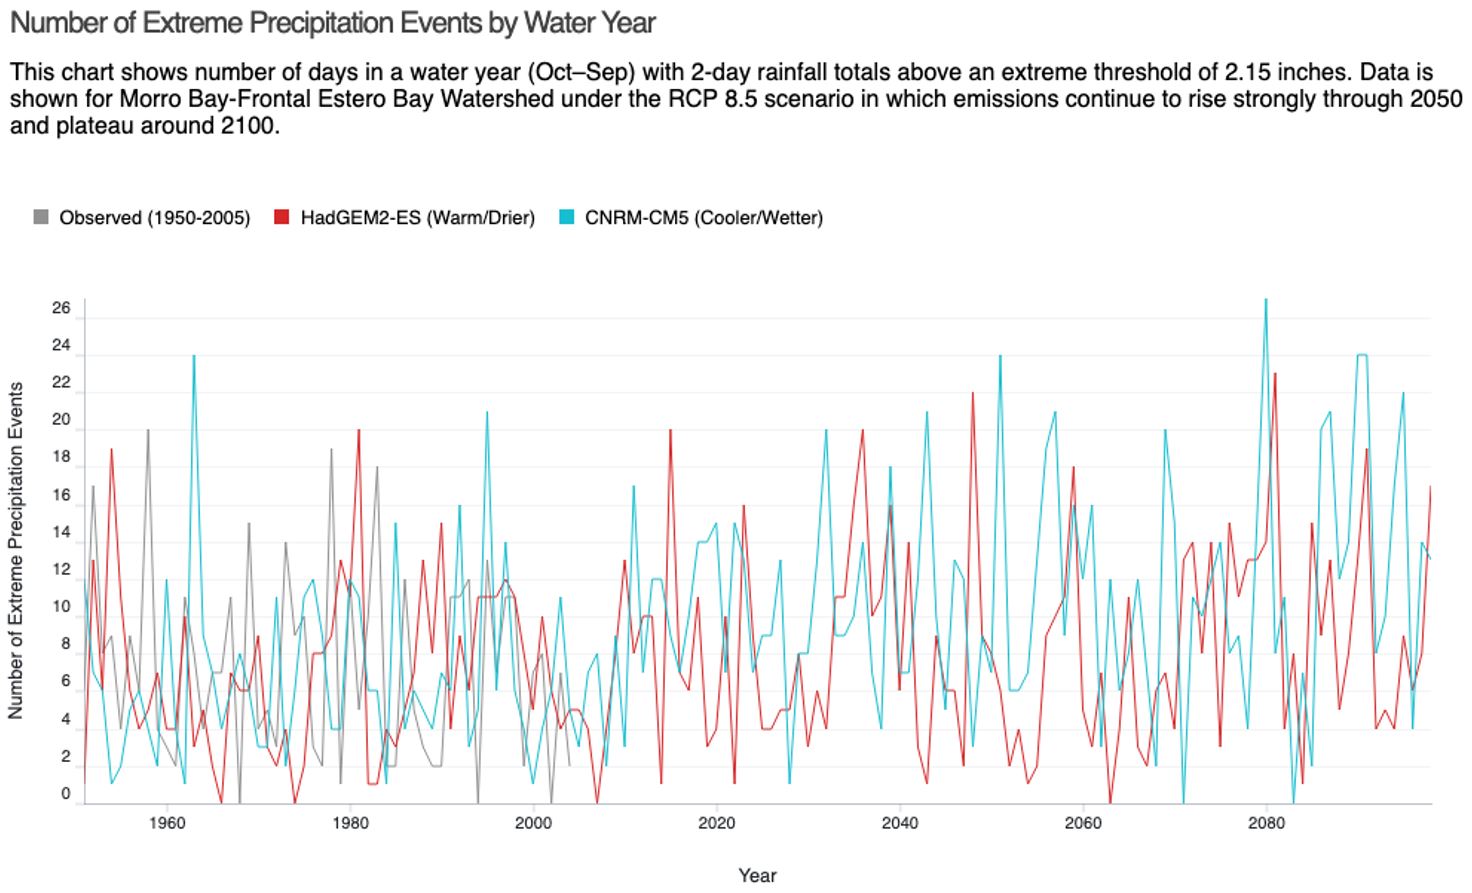
The graph illustrates the number of days with extreme precipitation (number of days with two-day rainfall totals above 2.15 inches) over time under a business as usual greenhouse gas emissions scenario (emissions continue to rise strongly though 2050 and plateau around 2100). The red line represents a warmer/drier climate simulation, the blue line represents a cooler/wetter climate simulation, and the gray line represents actual historical data. All climate models predict more extreme precipitation events, where there are two days of 2.15 inches of rainfall or more.
Extreme Precipitation Events by Water Year, Morro Bay National Estuary Program