Fulfilling our mission to protect and restore the Morro Bay estuary for people and animals requires a lot of hard work in the field. Read on to see what our staff and volunteers have been up to during the month of January.
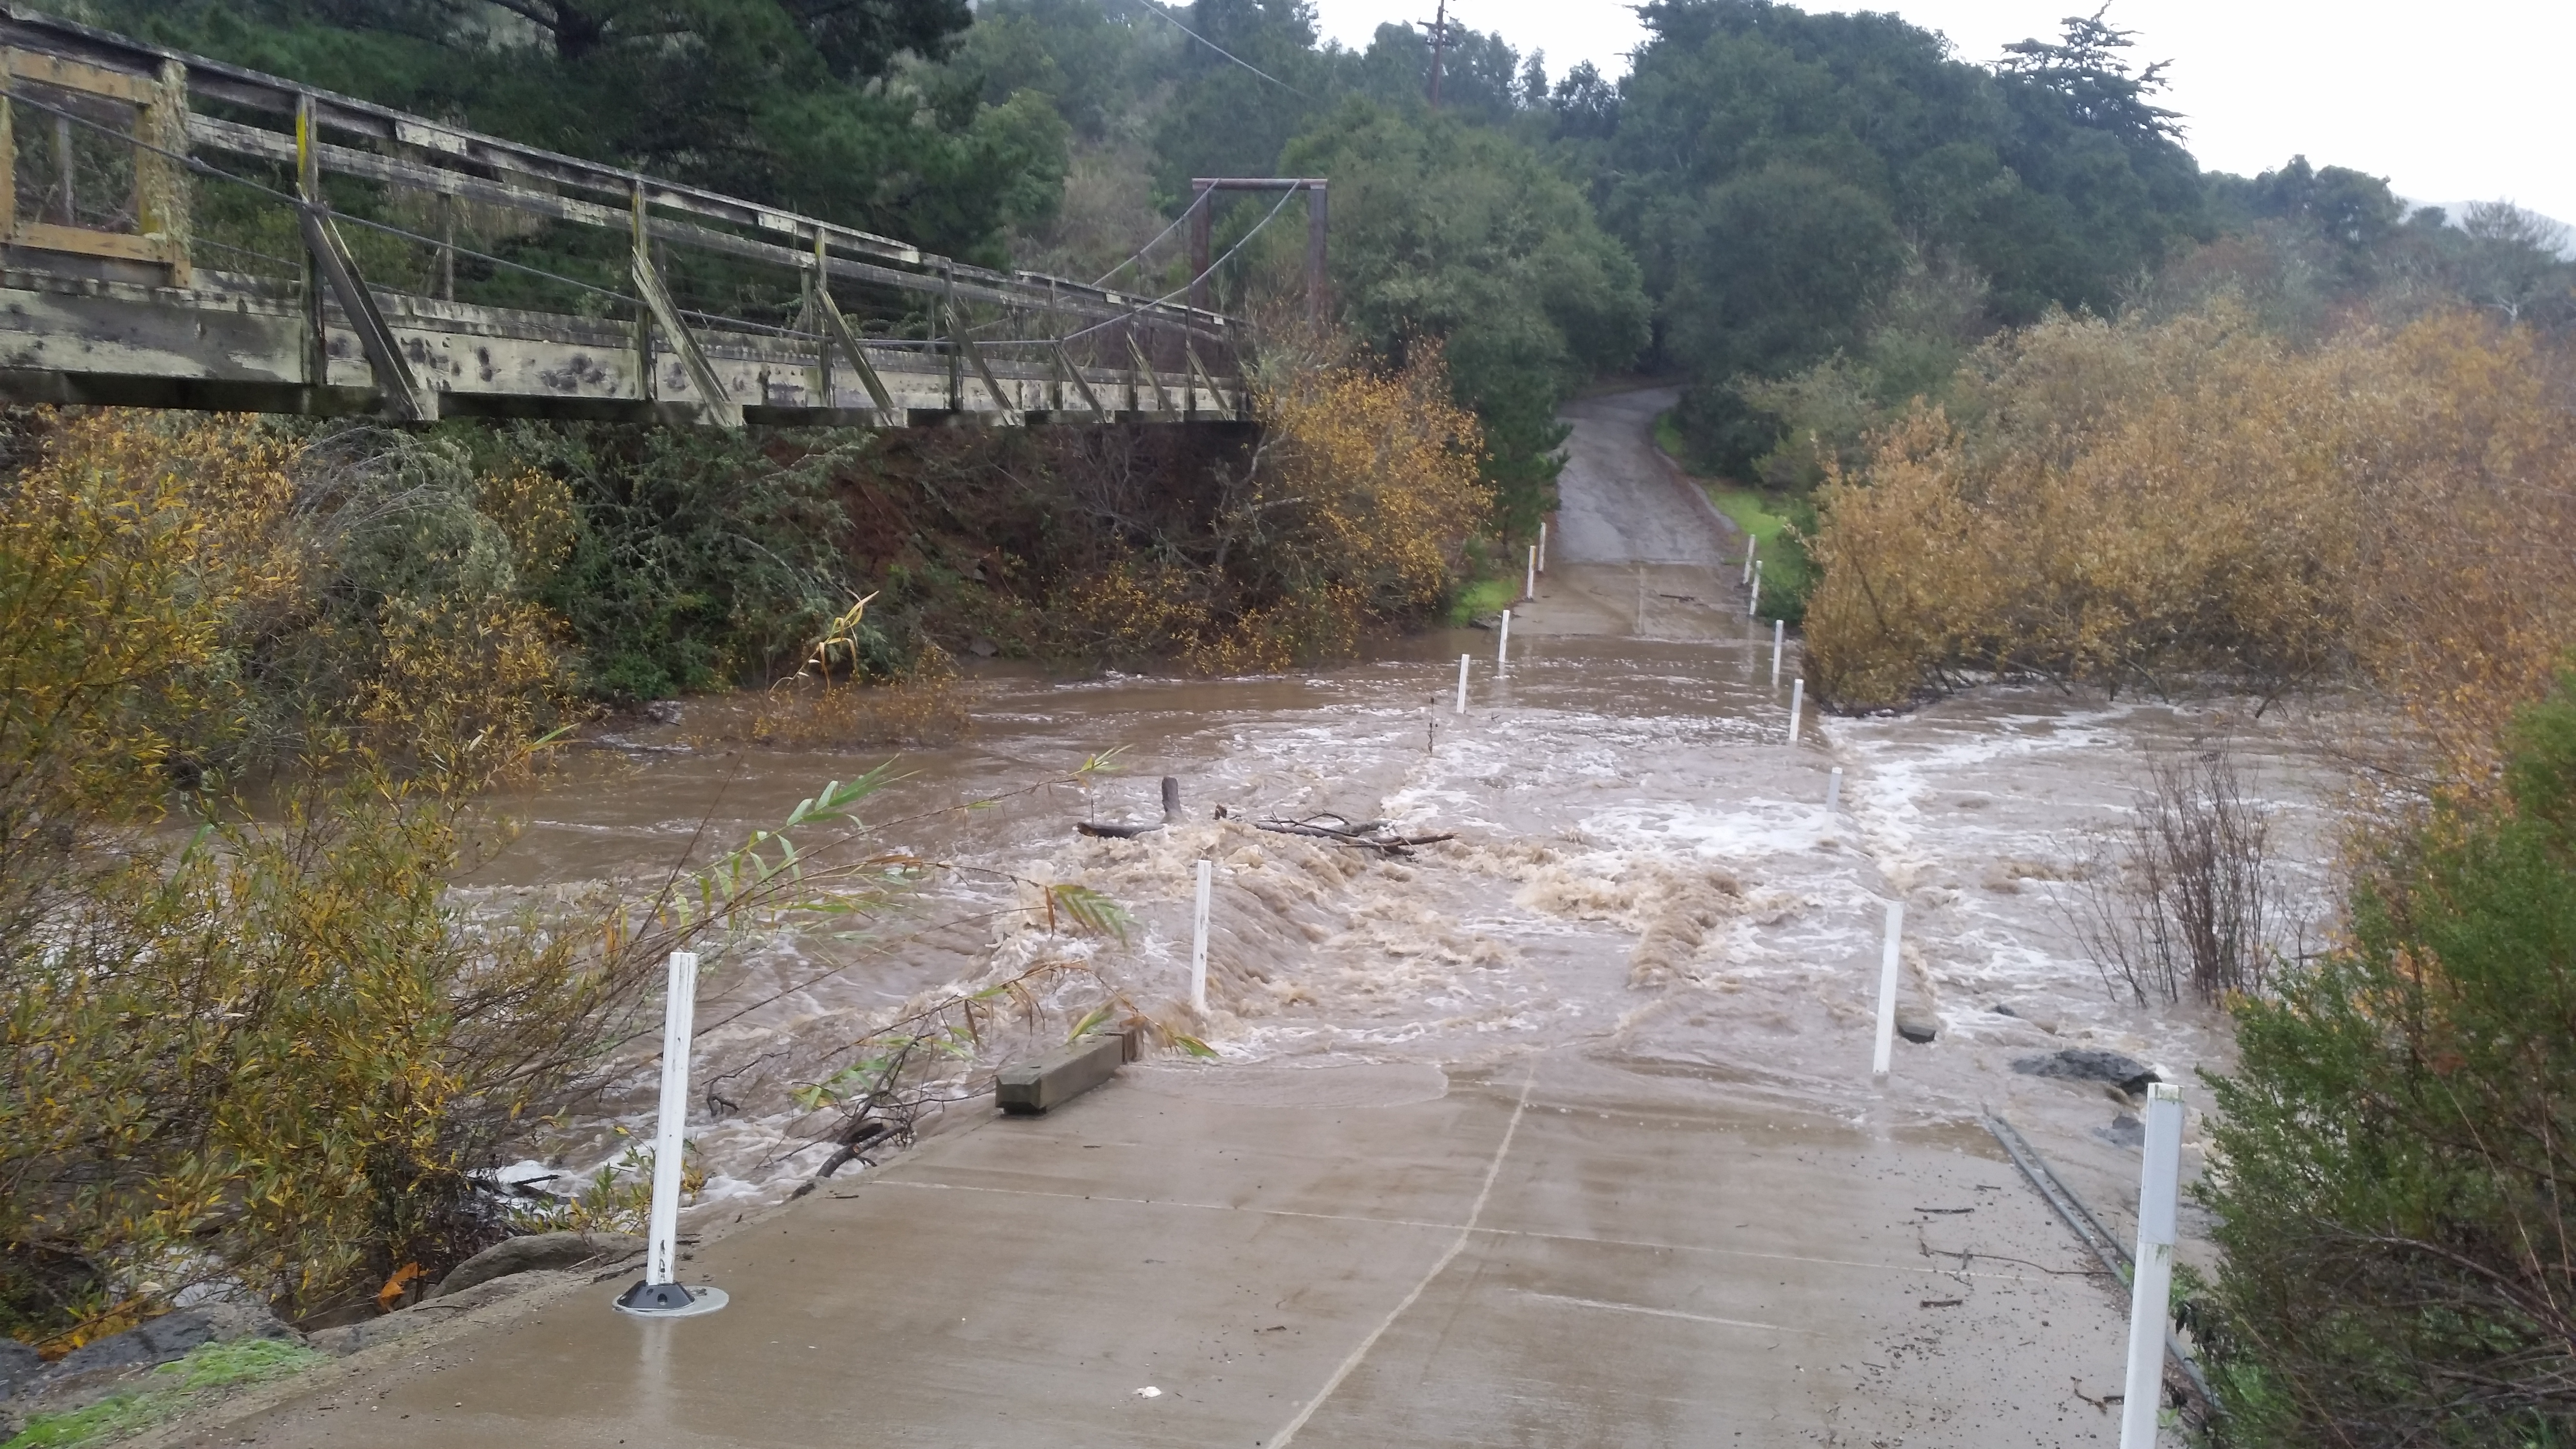
2017 started off with an exciting series of storms. On January 4, the Morro Bay watershed received an impressive 3.84 inches of rain within a 24-hour period. Our staff went out to check on different creek sites and discovered that Chorro Creek rose more than 9 feet, overtopping a county bridge on Canet Road.
This is the first time that has happened since 2011! Over the course of January, Chorro Creek at Canet Road received a total of 10.77 inches of rain, and topped that bridge three more times.
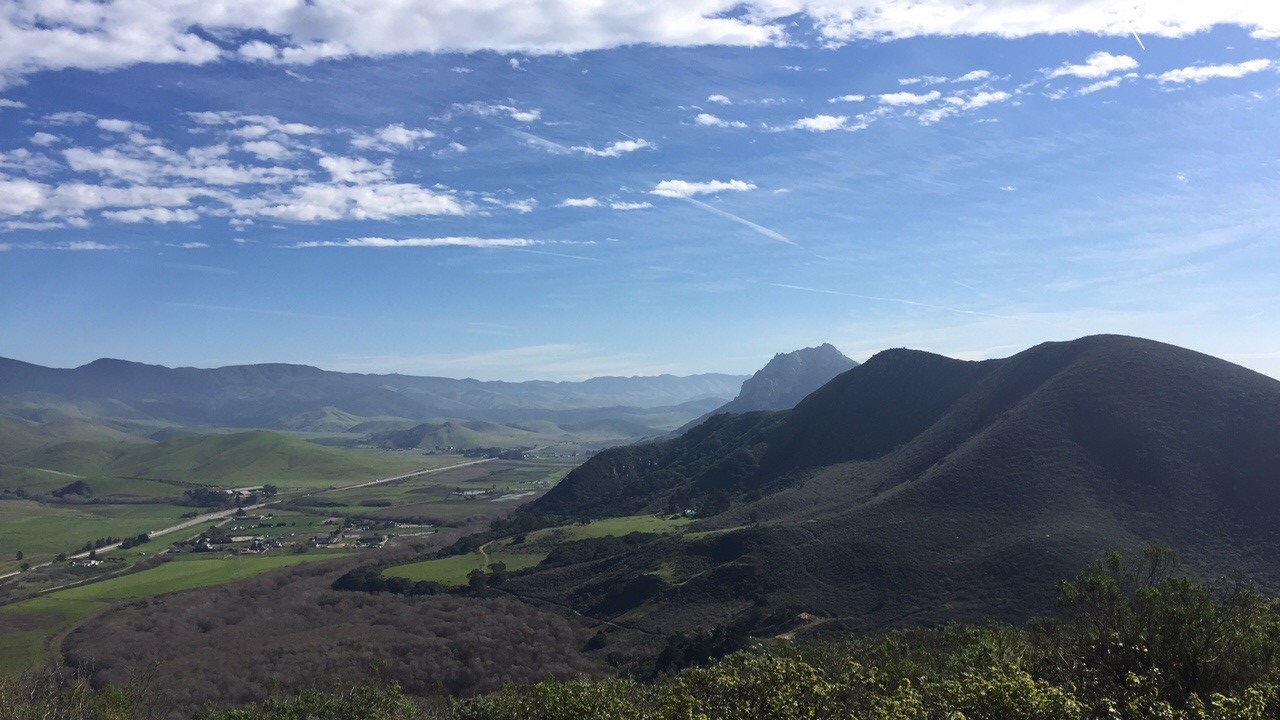
It looked like a completely different watershed out there this month.
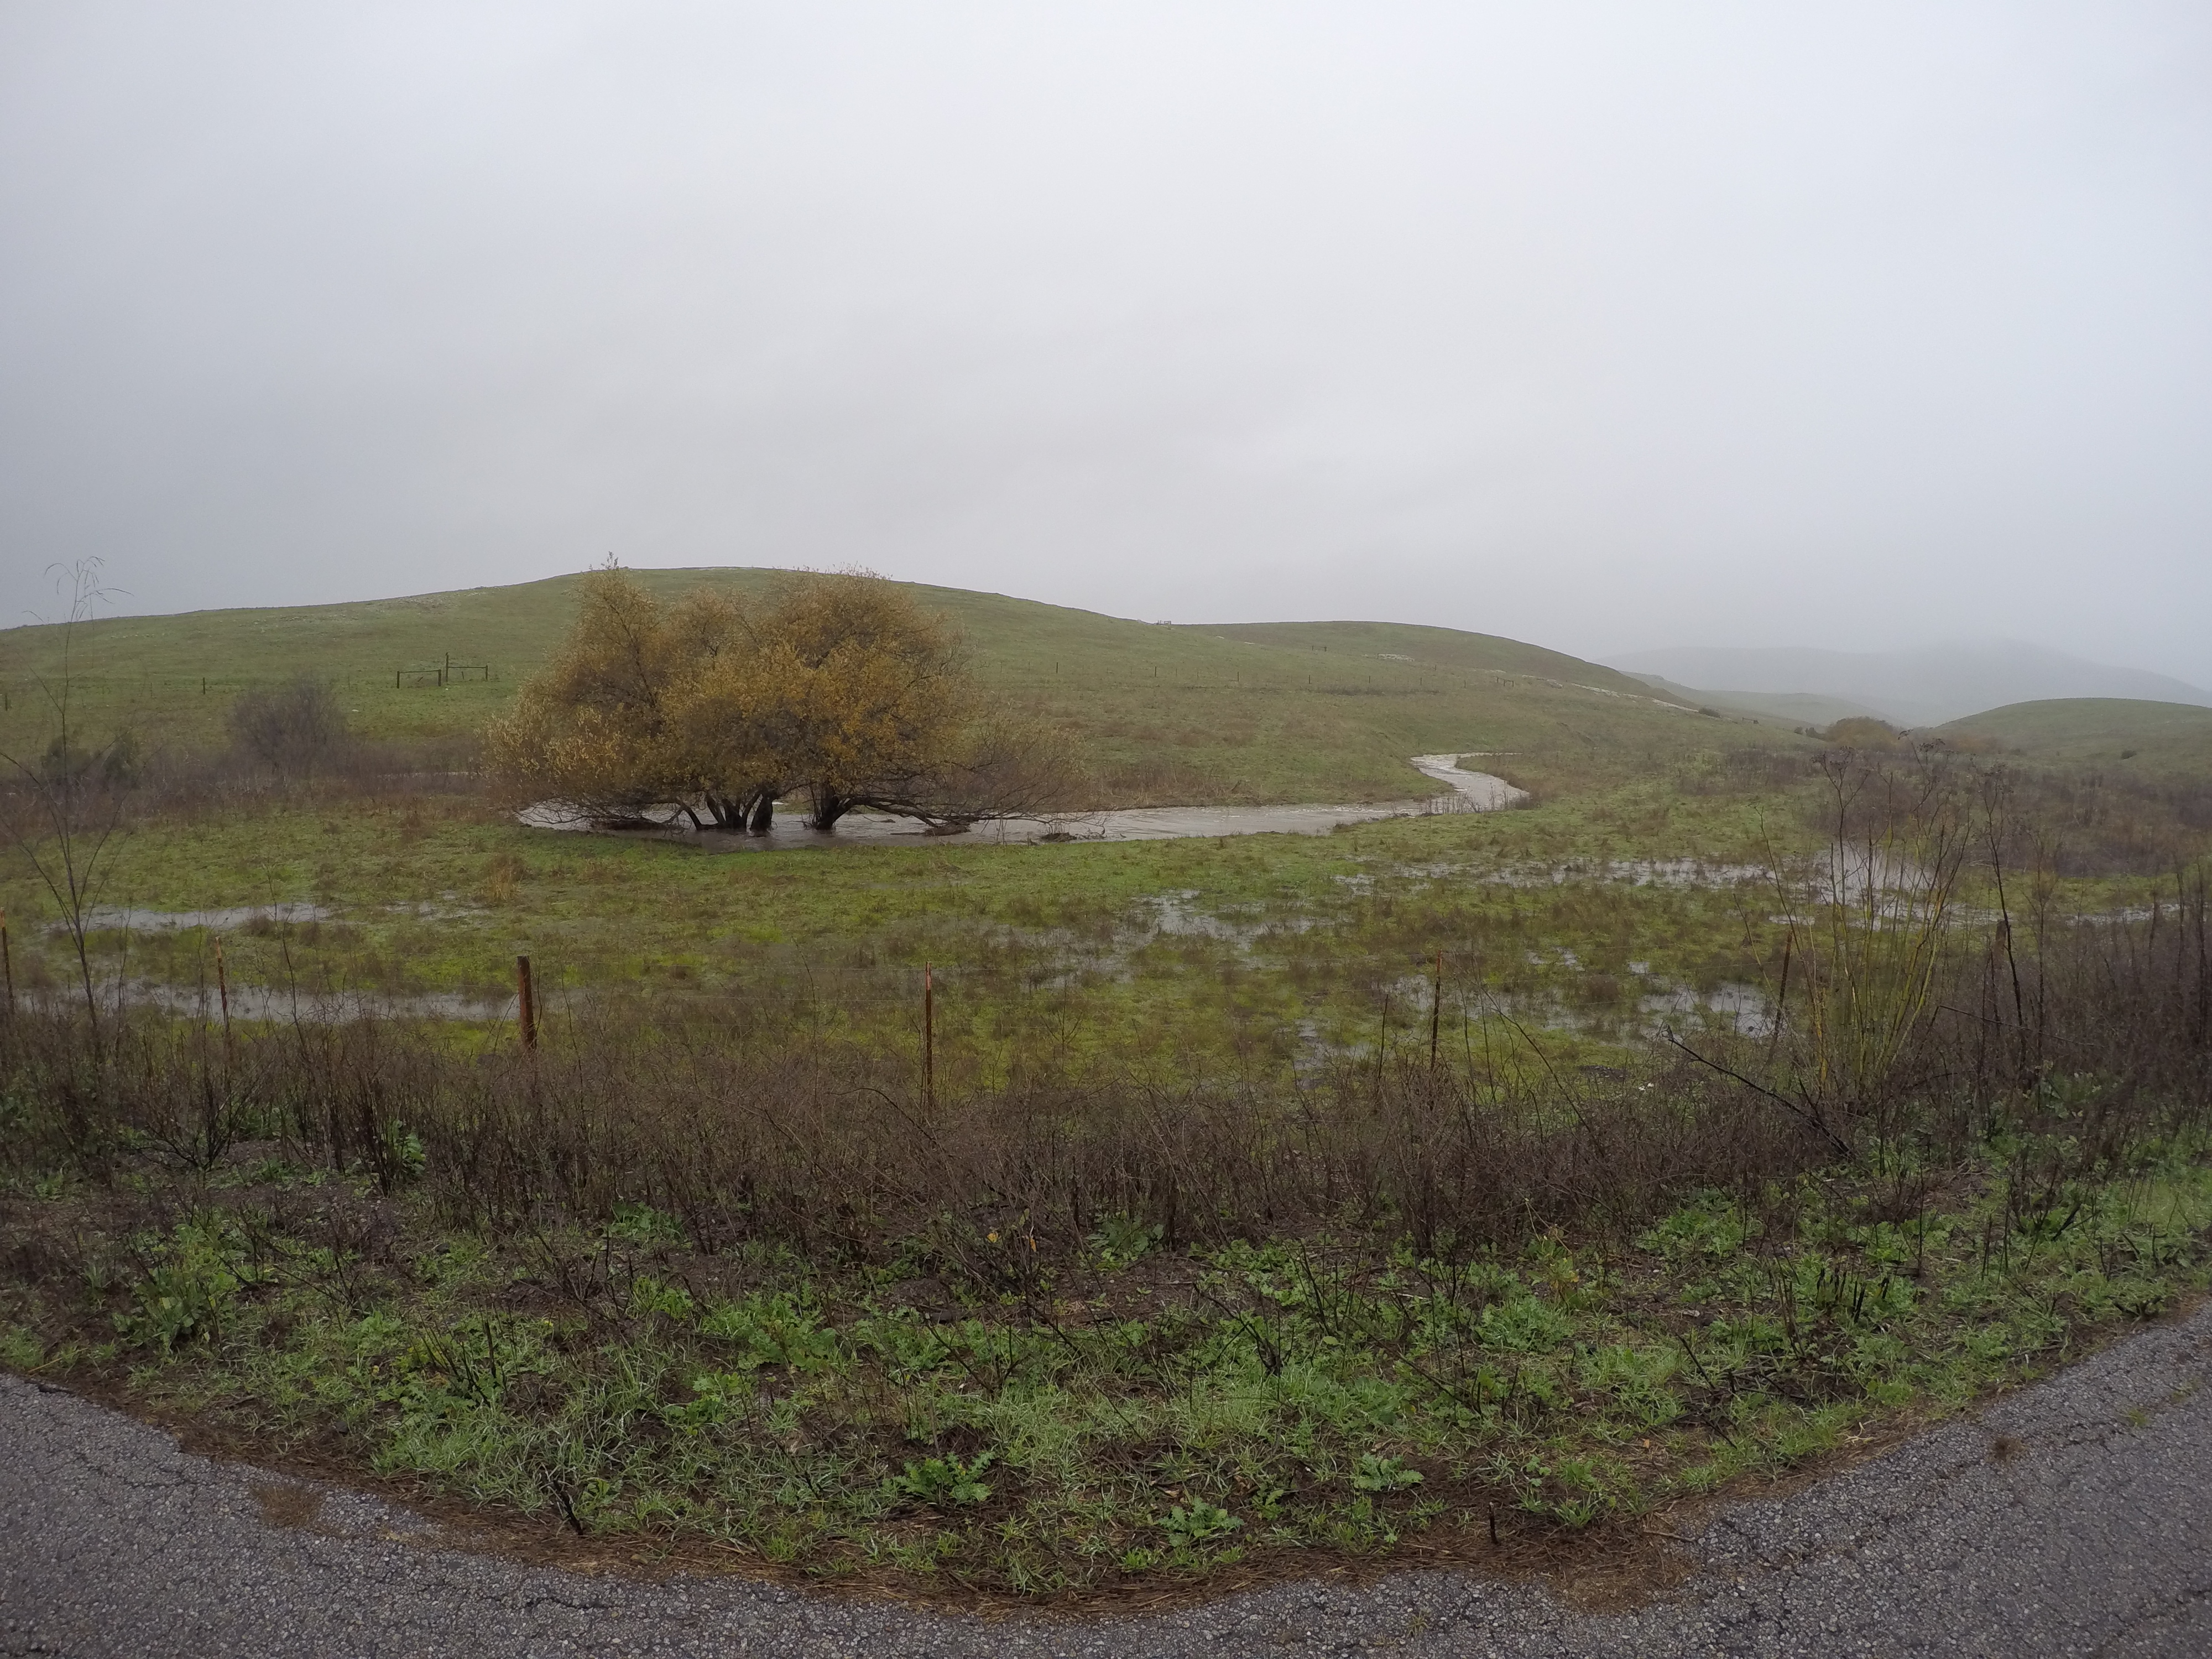
While checking on sites up on Pennington Creek, we discovered that Chumash Creek, a tributary into Pennington Creek, was flowing. We recently completed a number of roads restoration projects on this small creek, but none of our current monitoring staff has seen the creek flowing.
Sediment Monitoring
As John Lindsey put it, the storm door was wide open for most of January. Because of this, our monitoring staff spent the majority of the month focusing on sediment monitoring.
Why sediment monitoring? In 1998, Chorro Creek, Los Osos Creek, and the Morro Bay estuary were determined to be impaired by accelerated sedimentation, meaning that they are filling up with dirt and other sediment faster than expected. The Estuary Program has been a lead partner in monitoring and other efforts to reduce erosion in the watershed and prevent excessive sedimentation of Morro Bay. In 2007, we incorporated additional storm monitoring to measure the amount of sediment suspended in creeks during storm events at three stations in the Chorro Creek watershed.
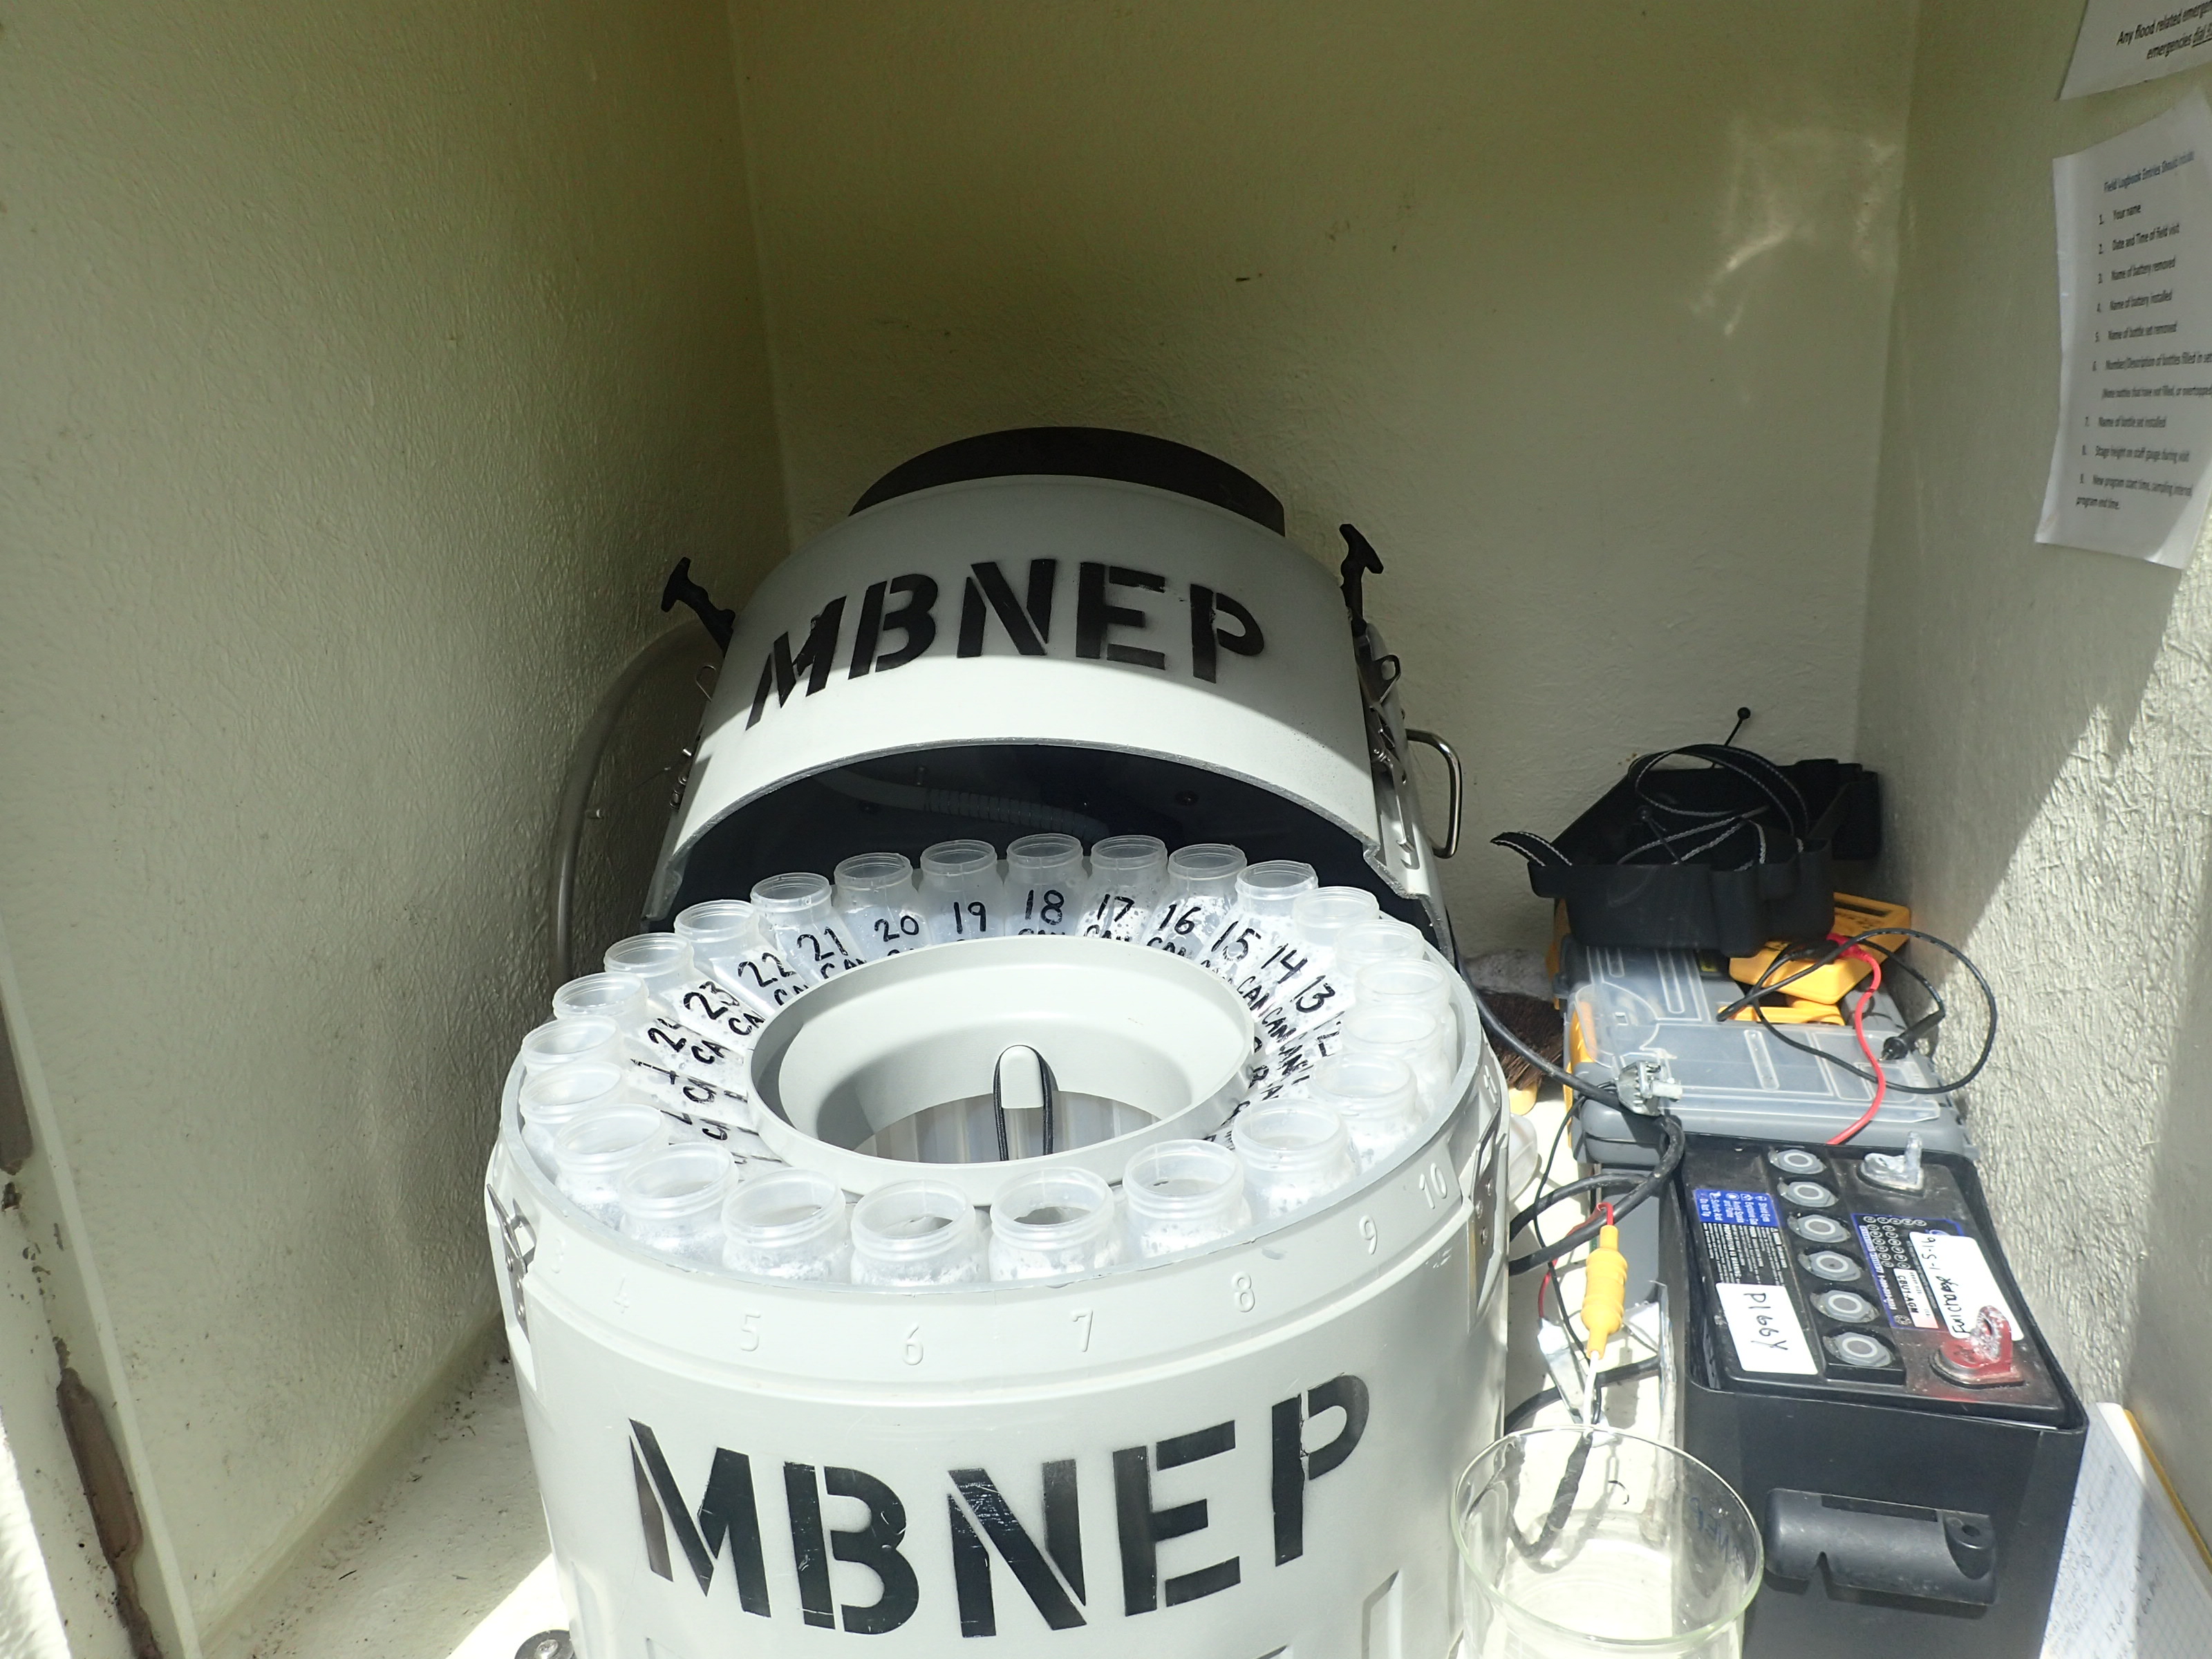
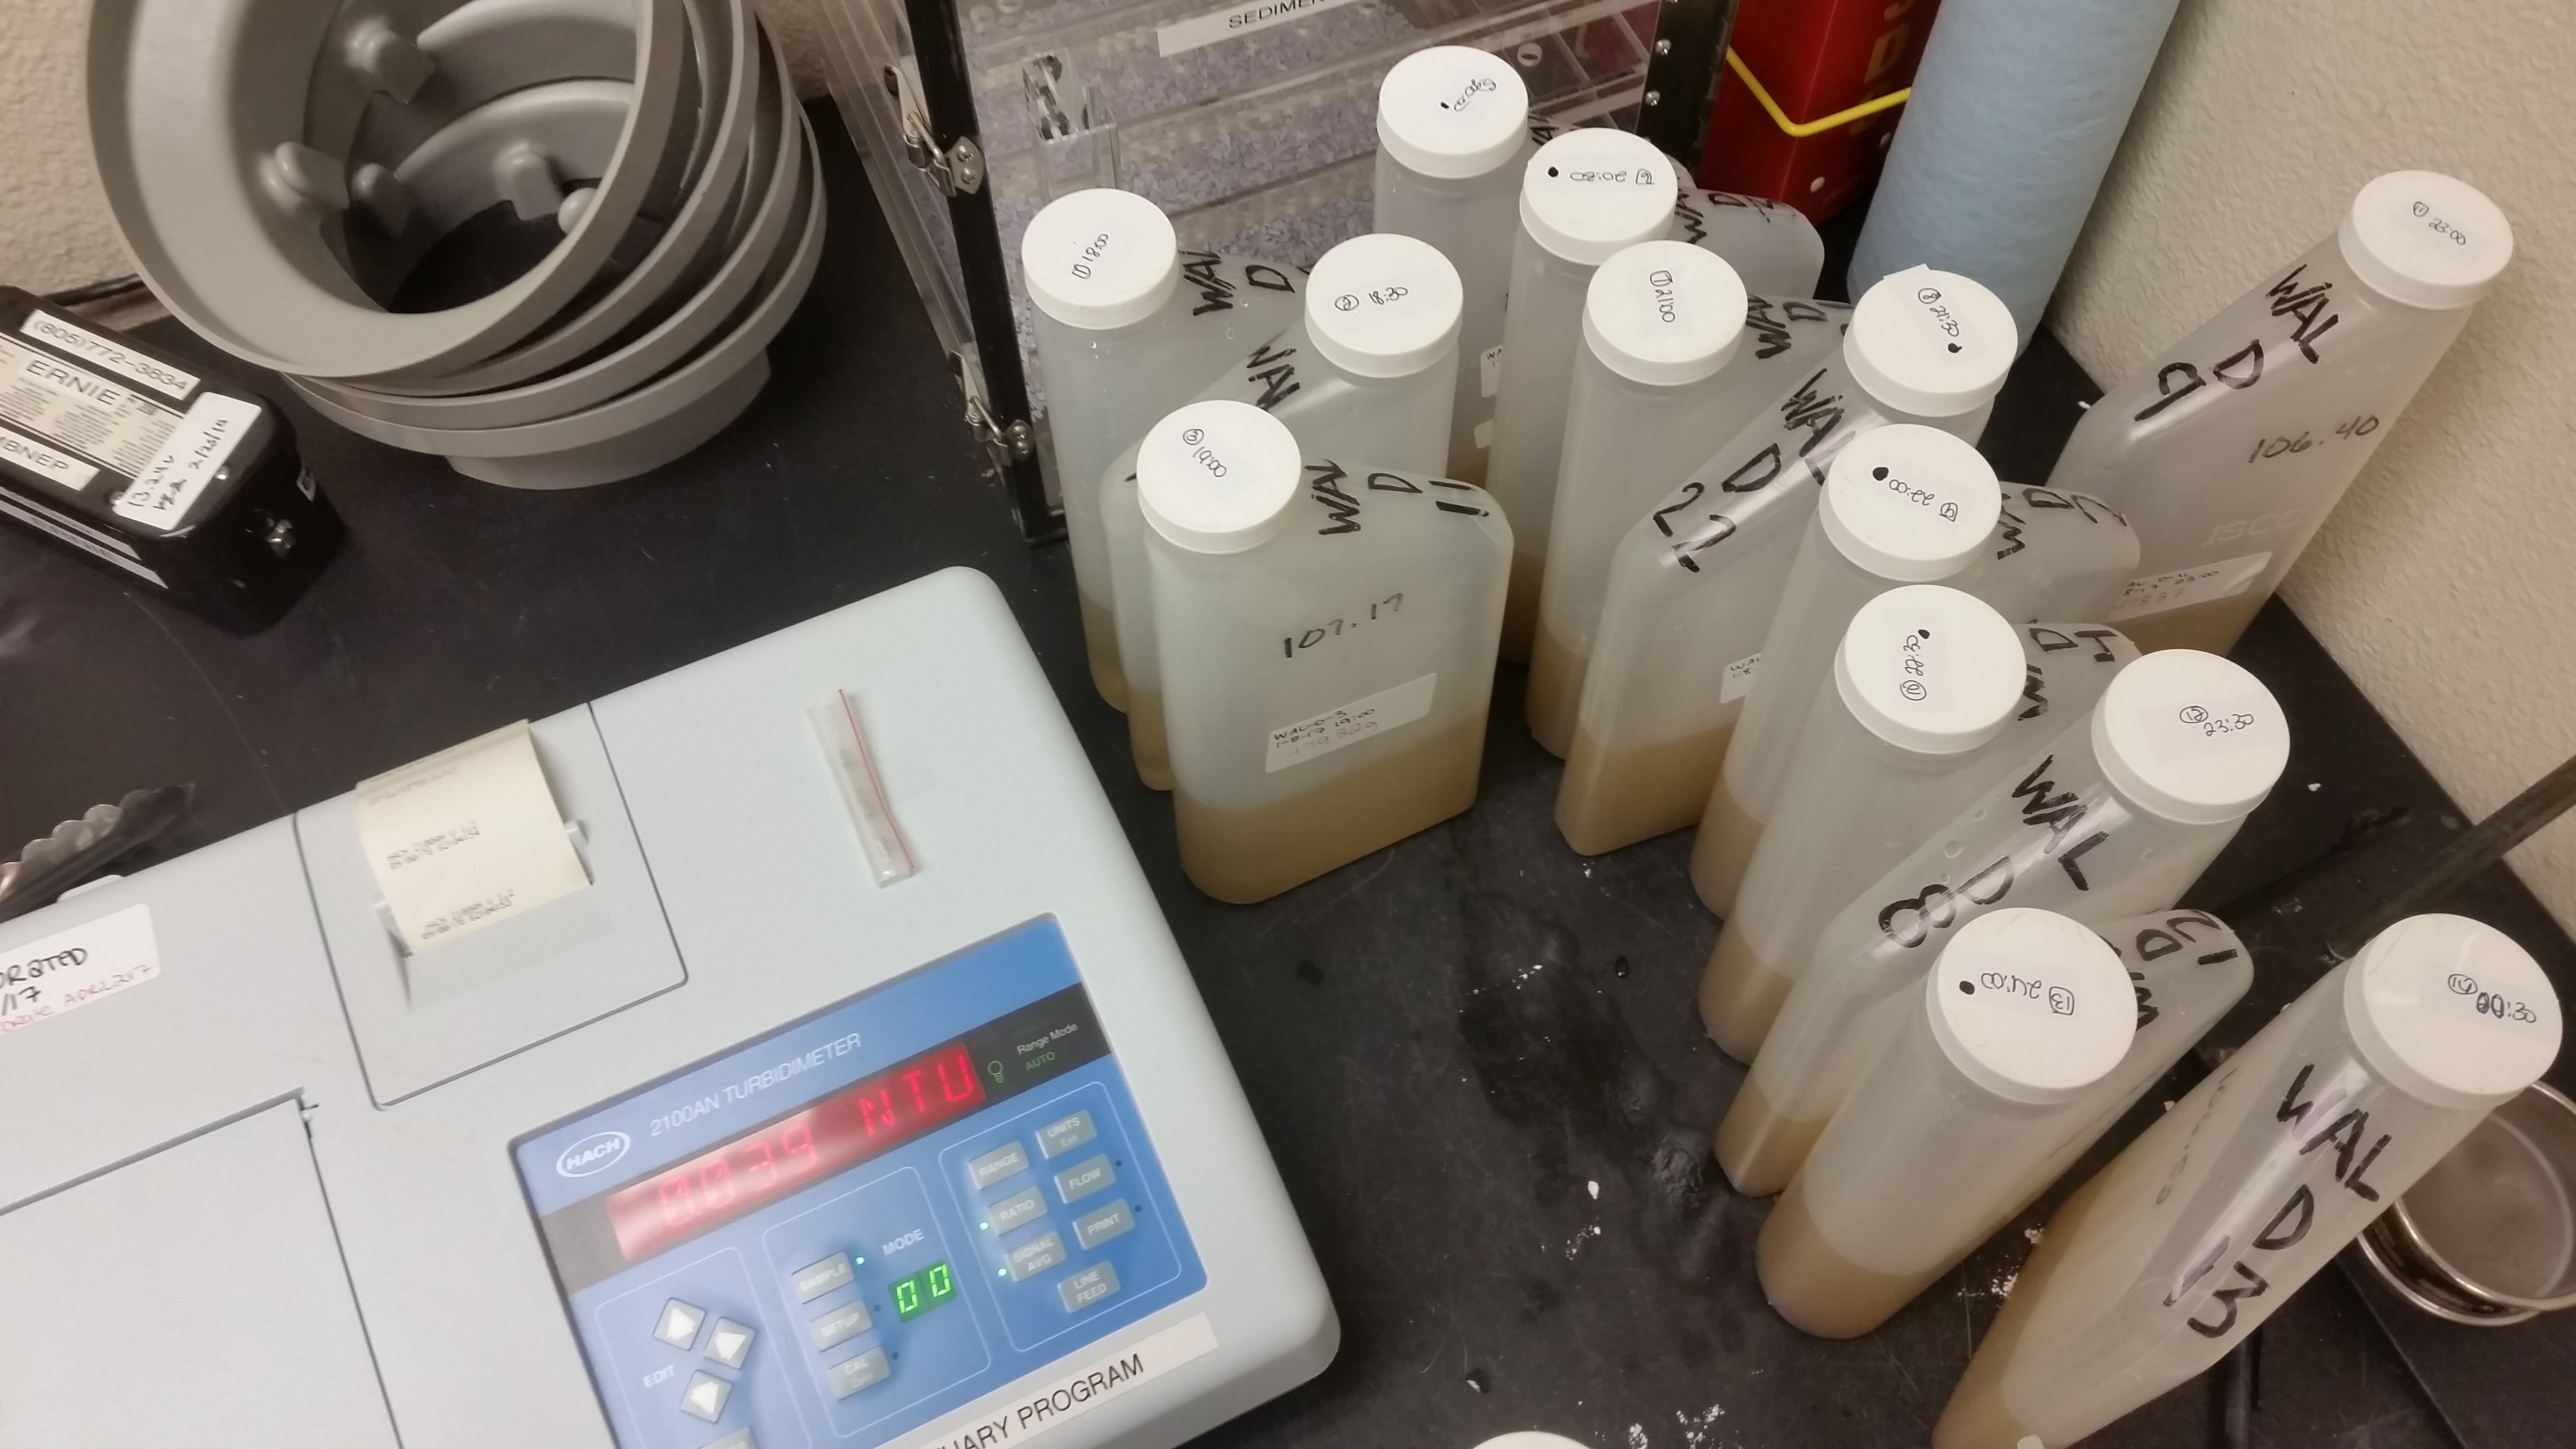
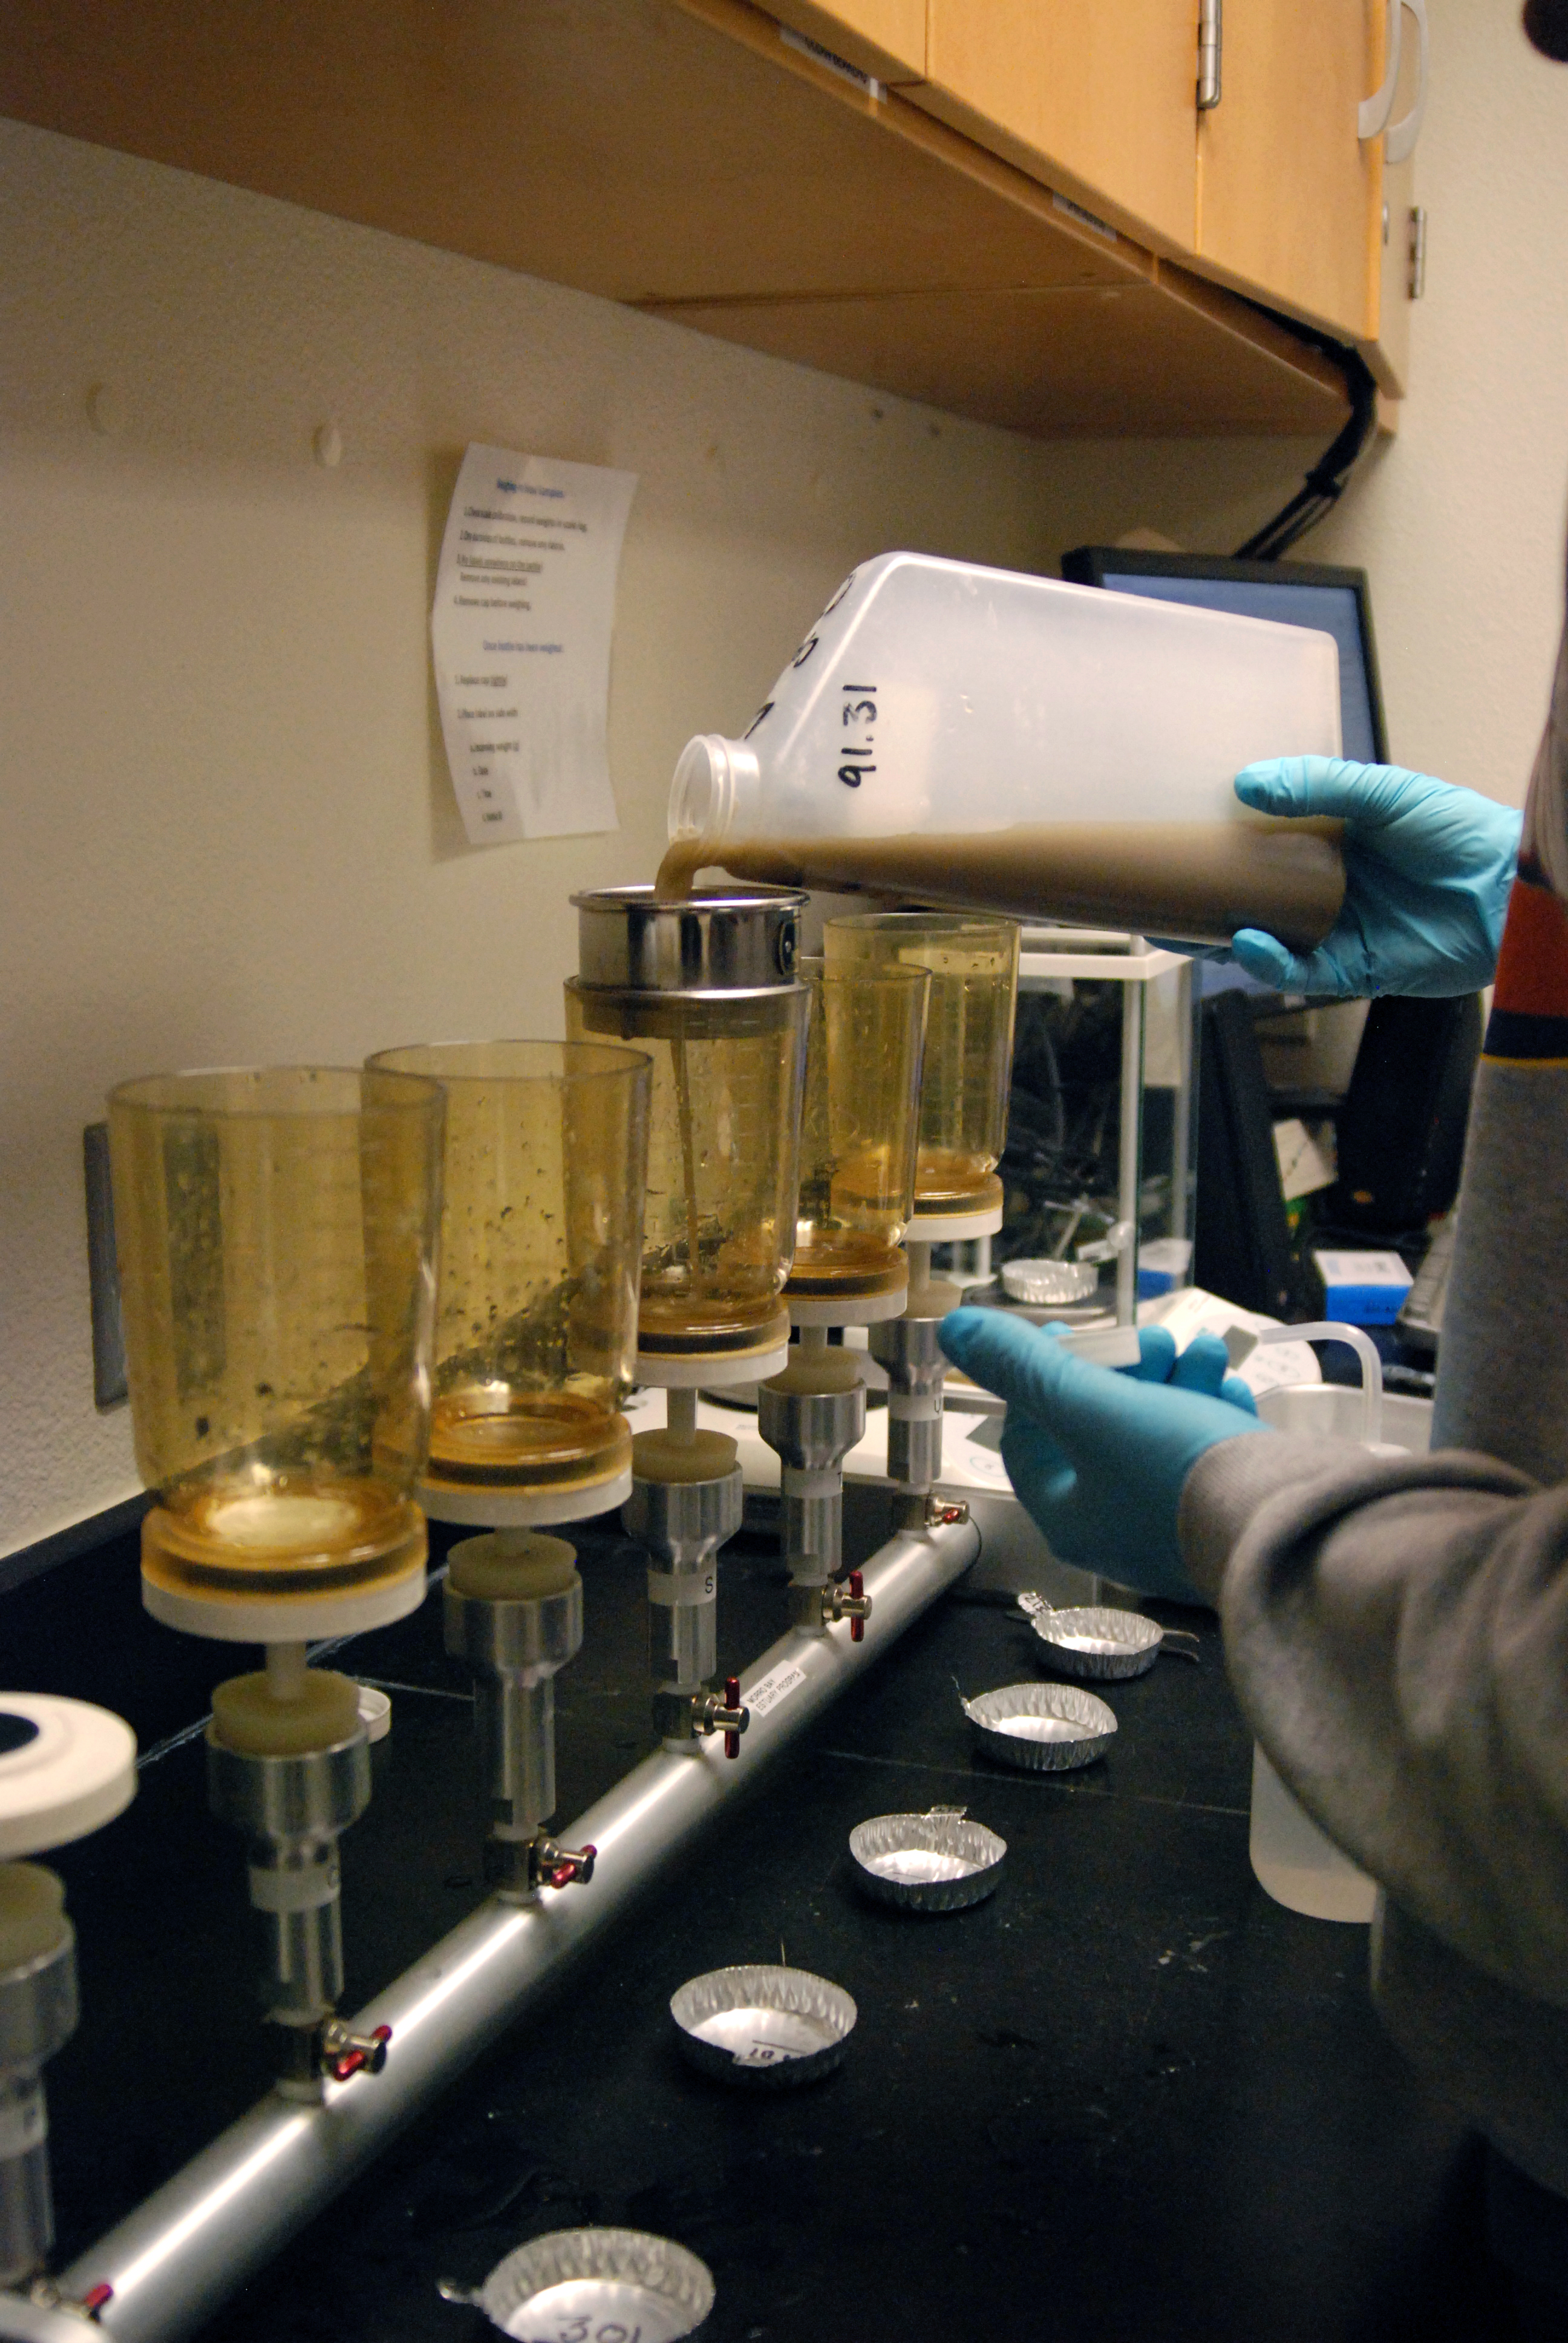
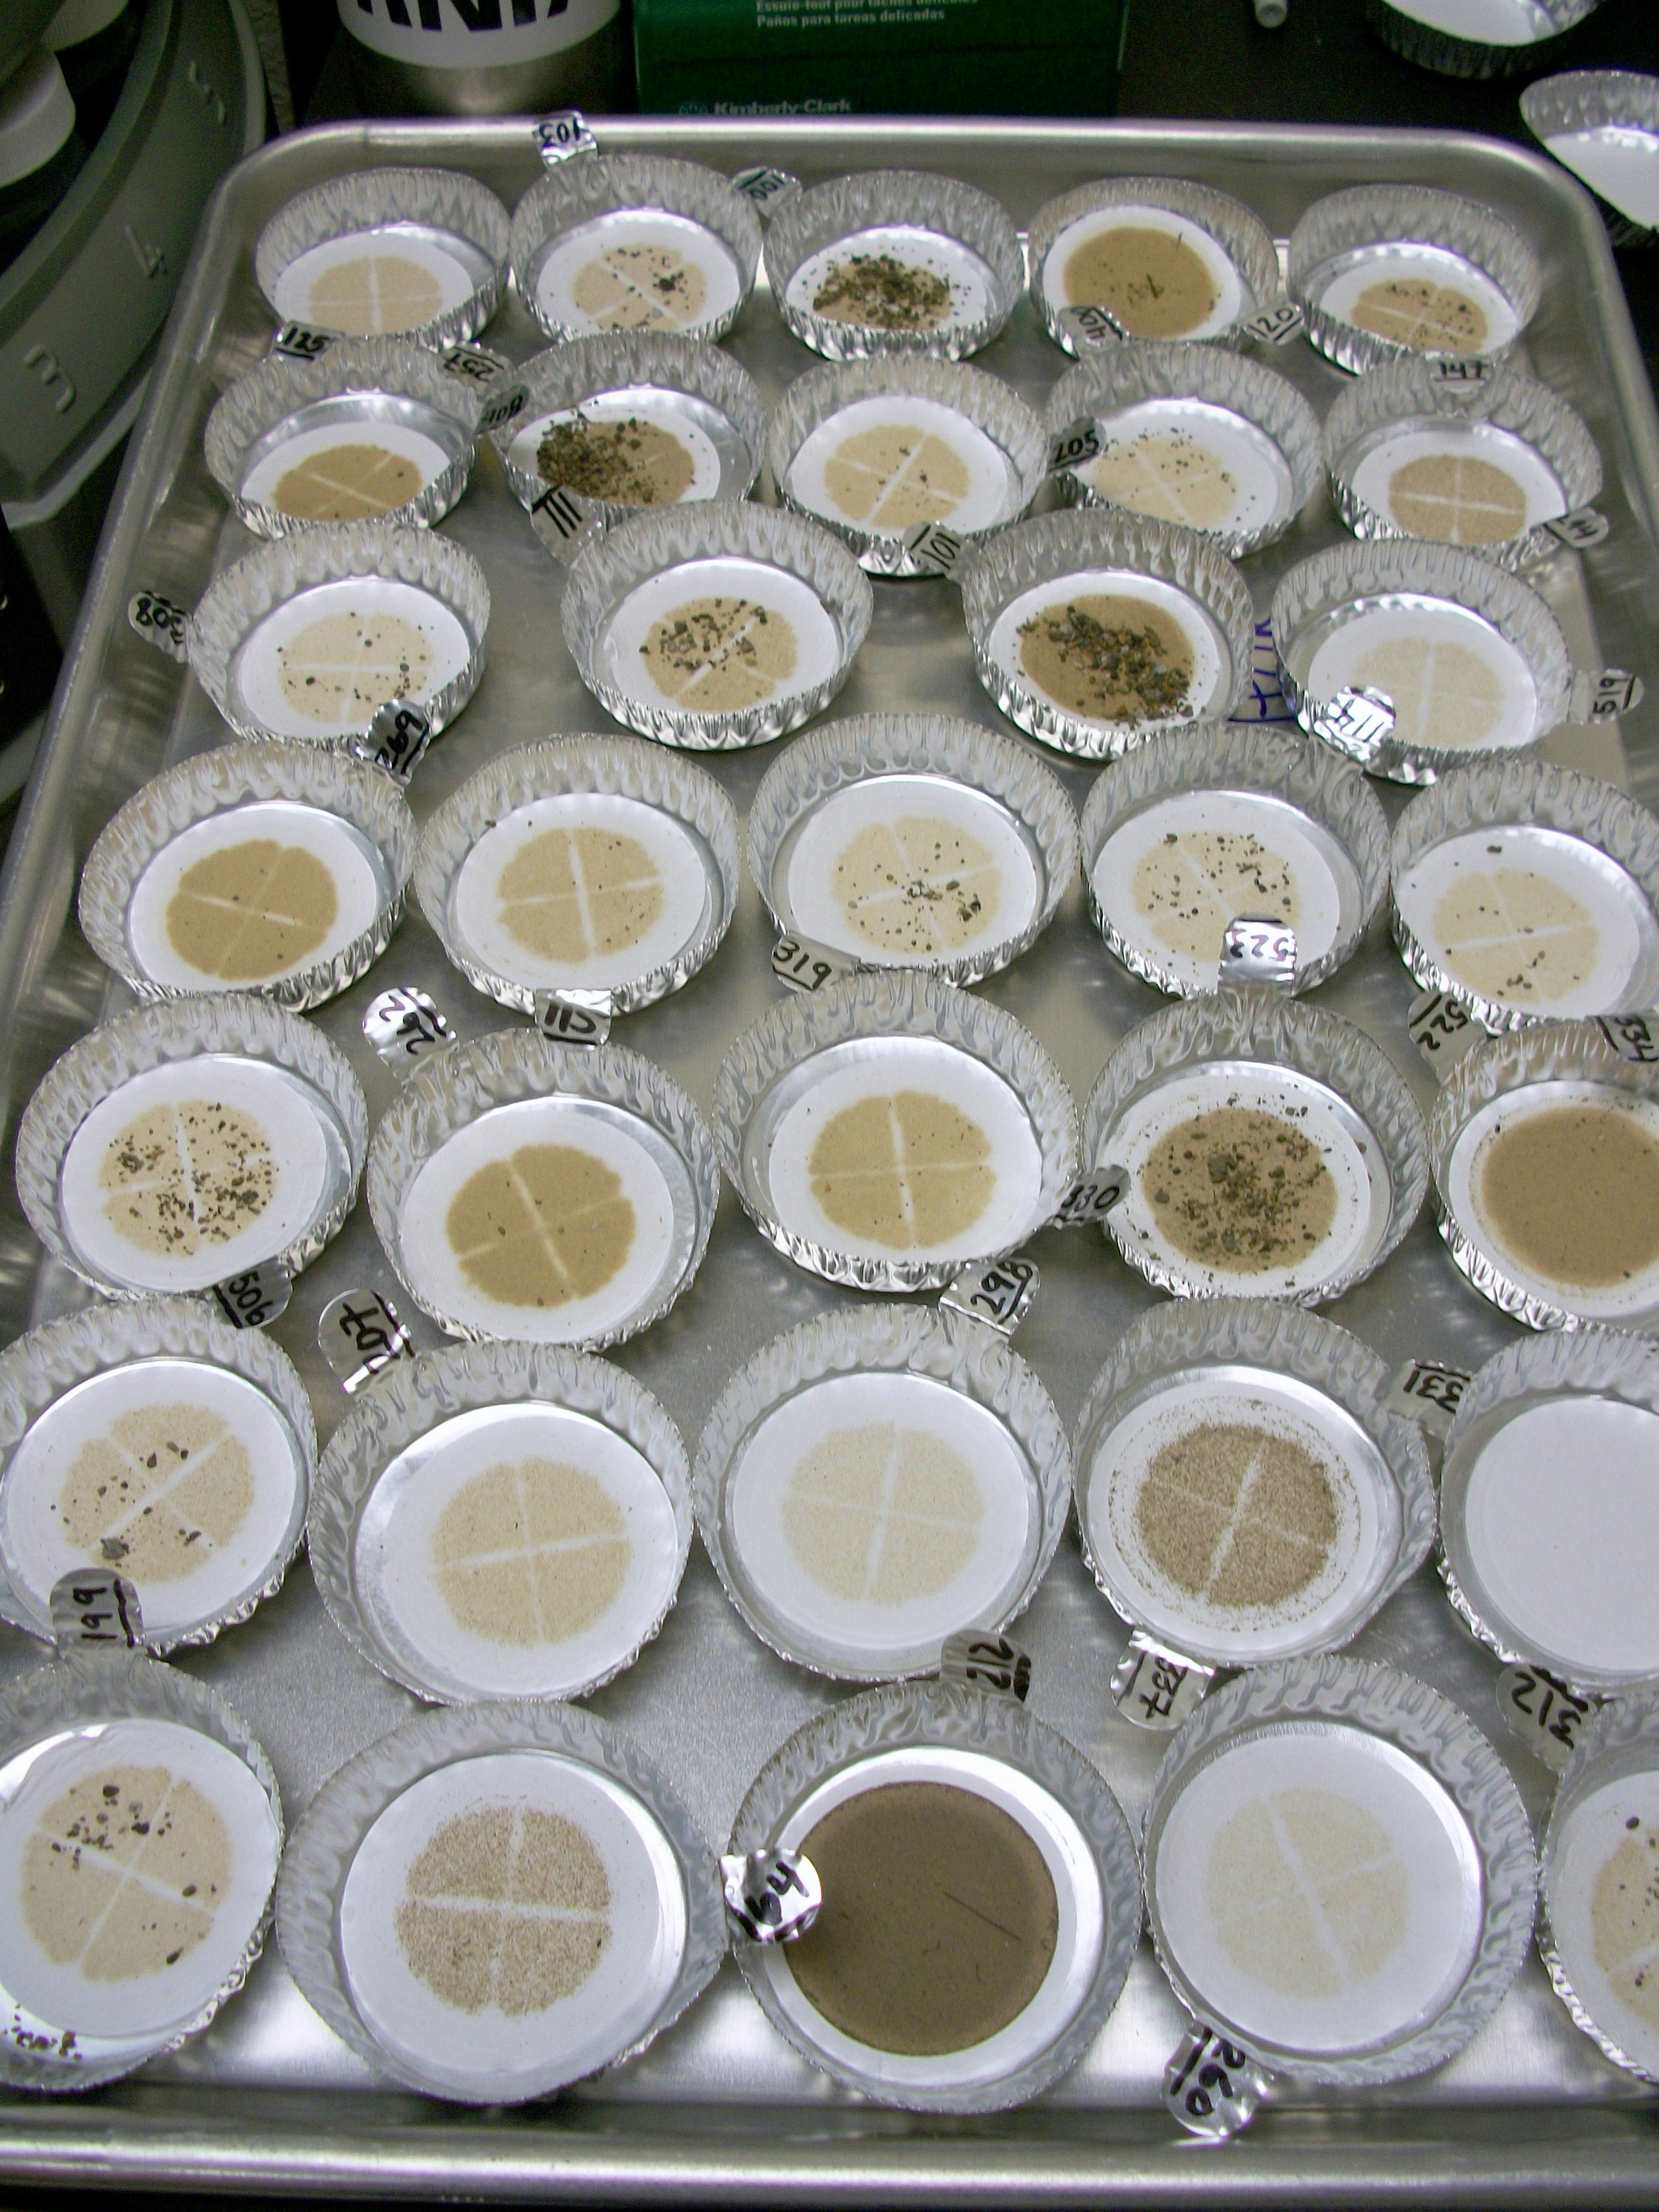
For this sediment monitoring, we use automatic sampling equipment programmed to collect water samples at set intervals during storms. These samplers are housed inside shelters at each monitoring site, safely away from the creek. A small pipe draws water from the creek and fills the bottles. After the bottles have all filled, we process the contents in our lab space at Cuesta College. We weigh the bottles, measure each sample’s turbidity (the cloudiness of the fluid, caused by individual particles suspended in it) and then filter the water to capture all the sediment in the samples.
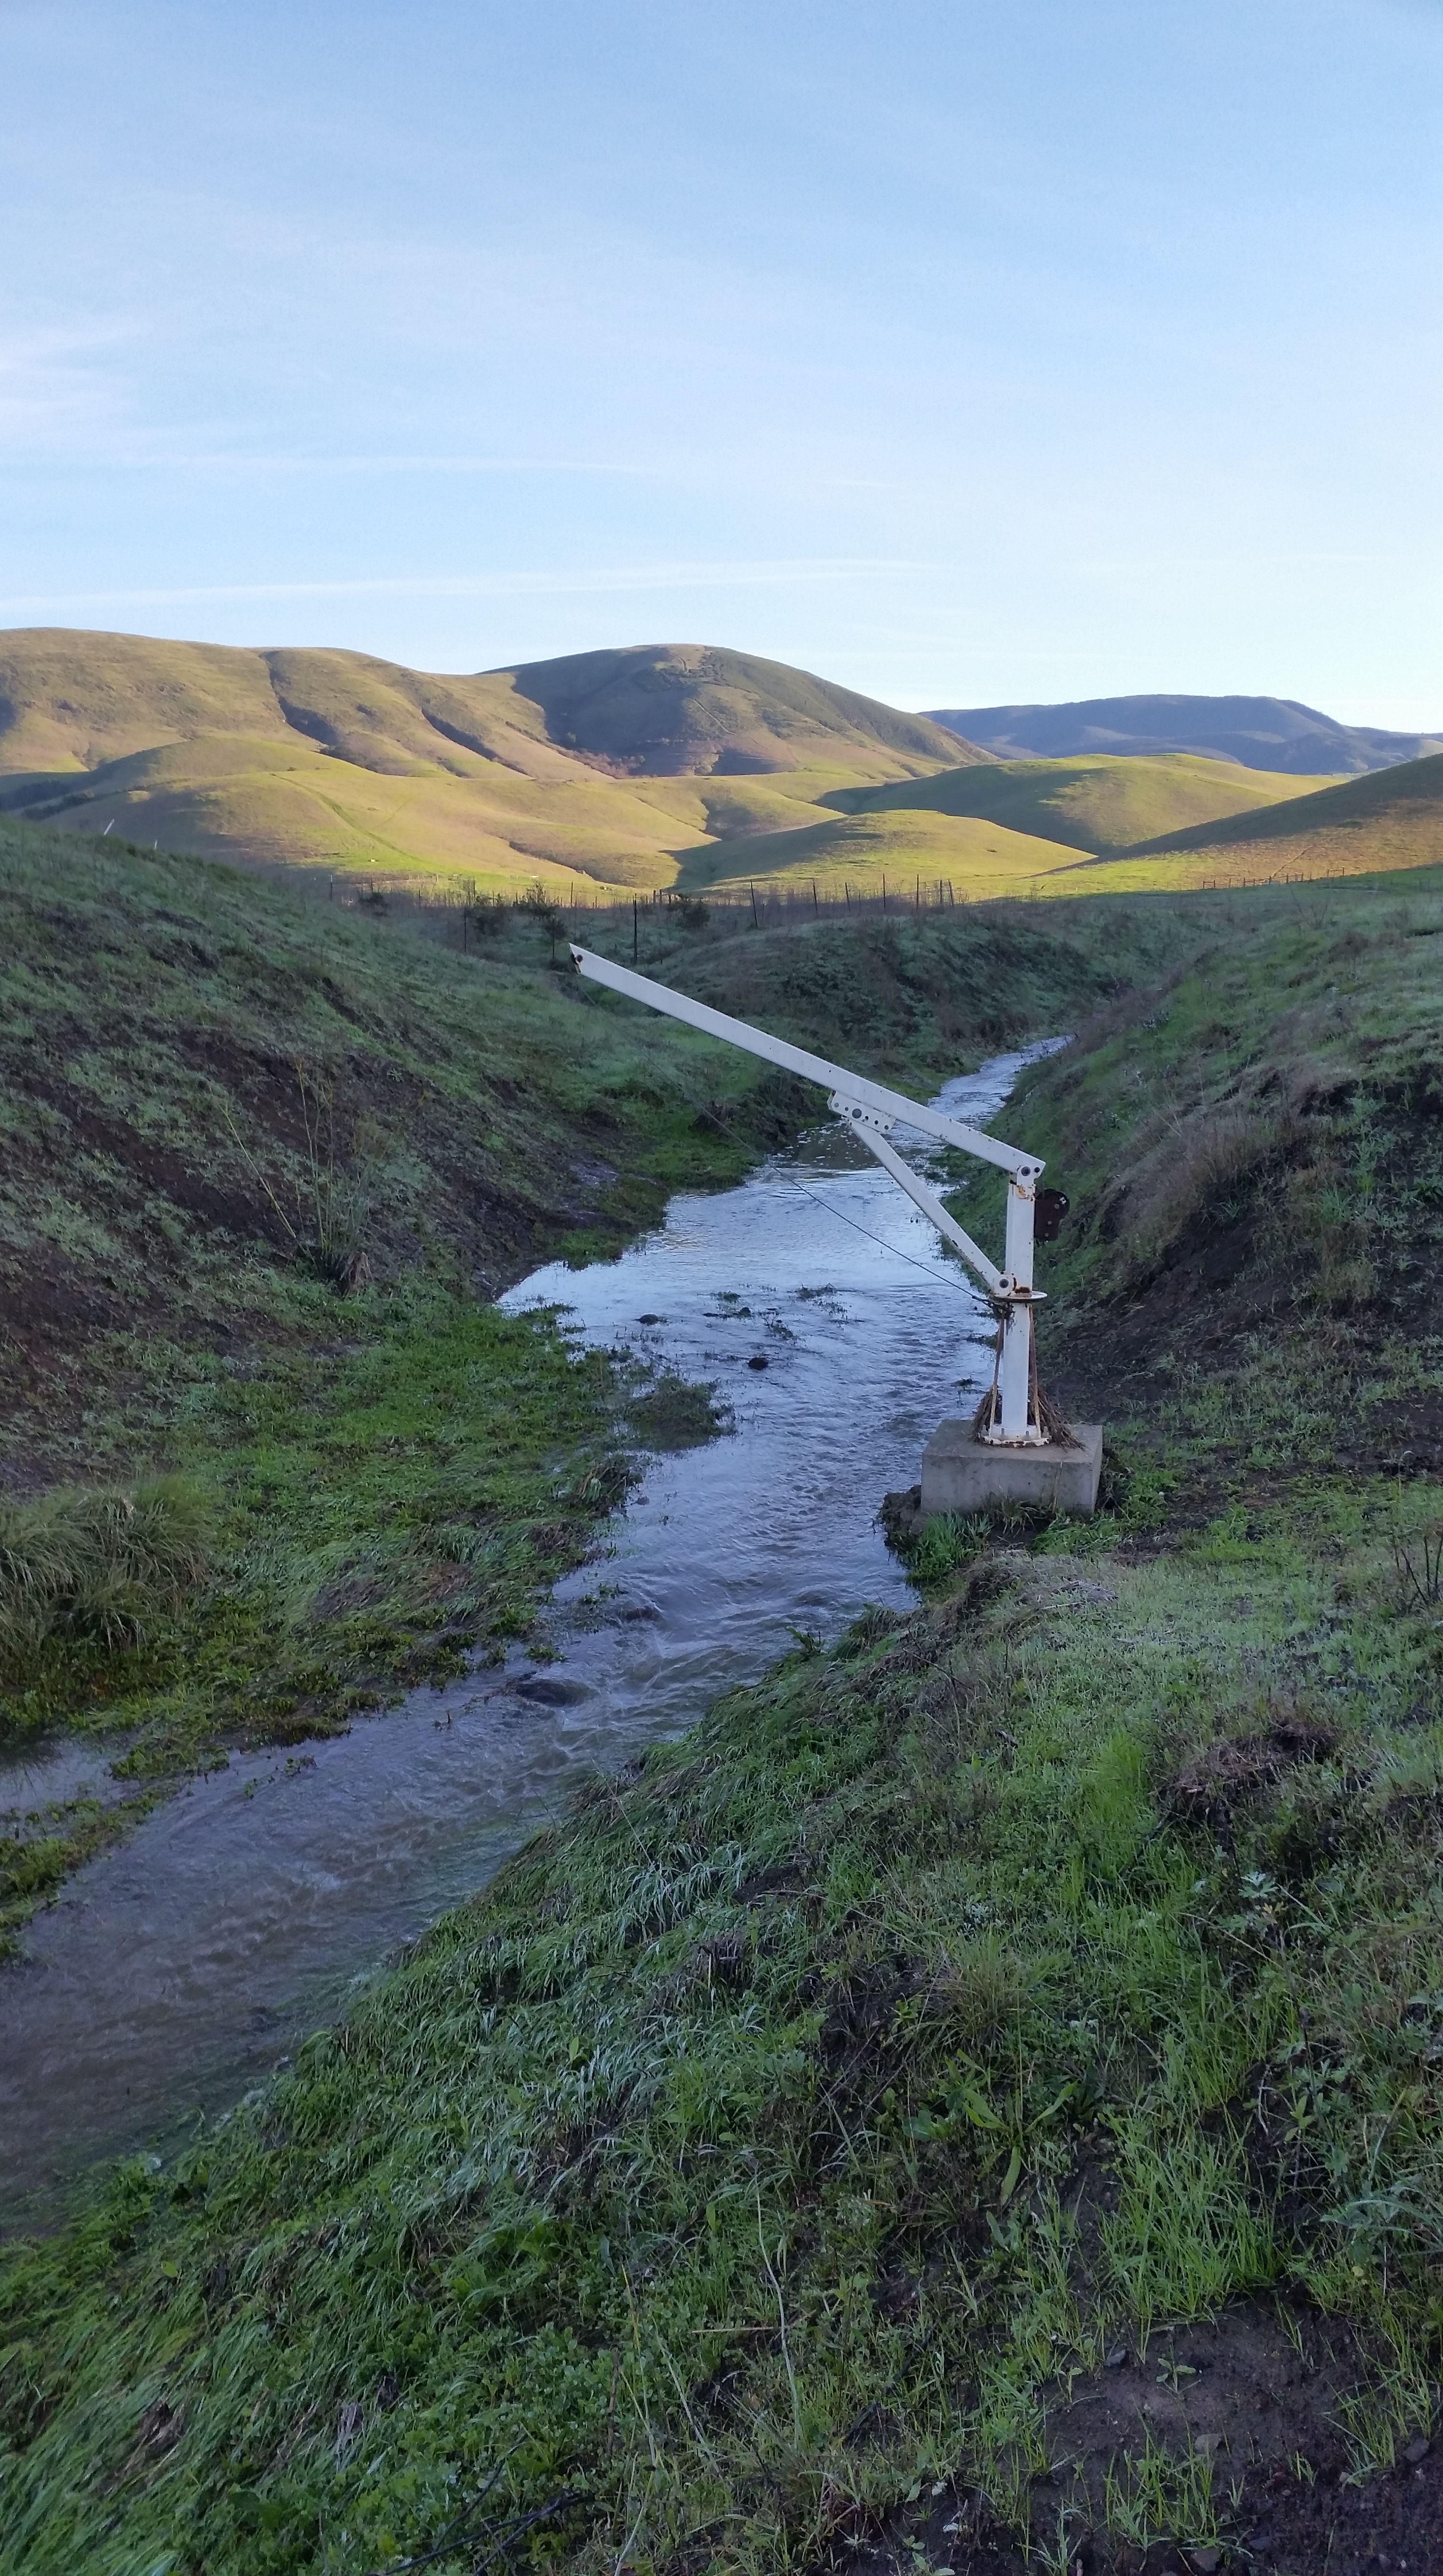
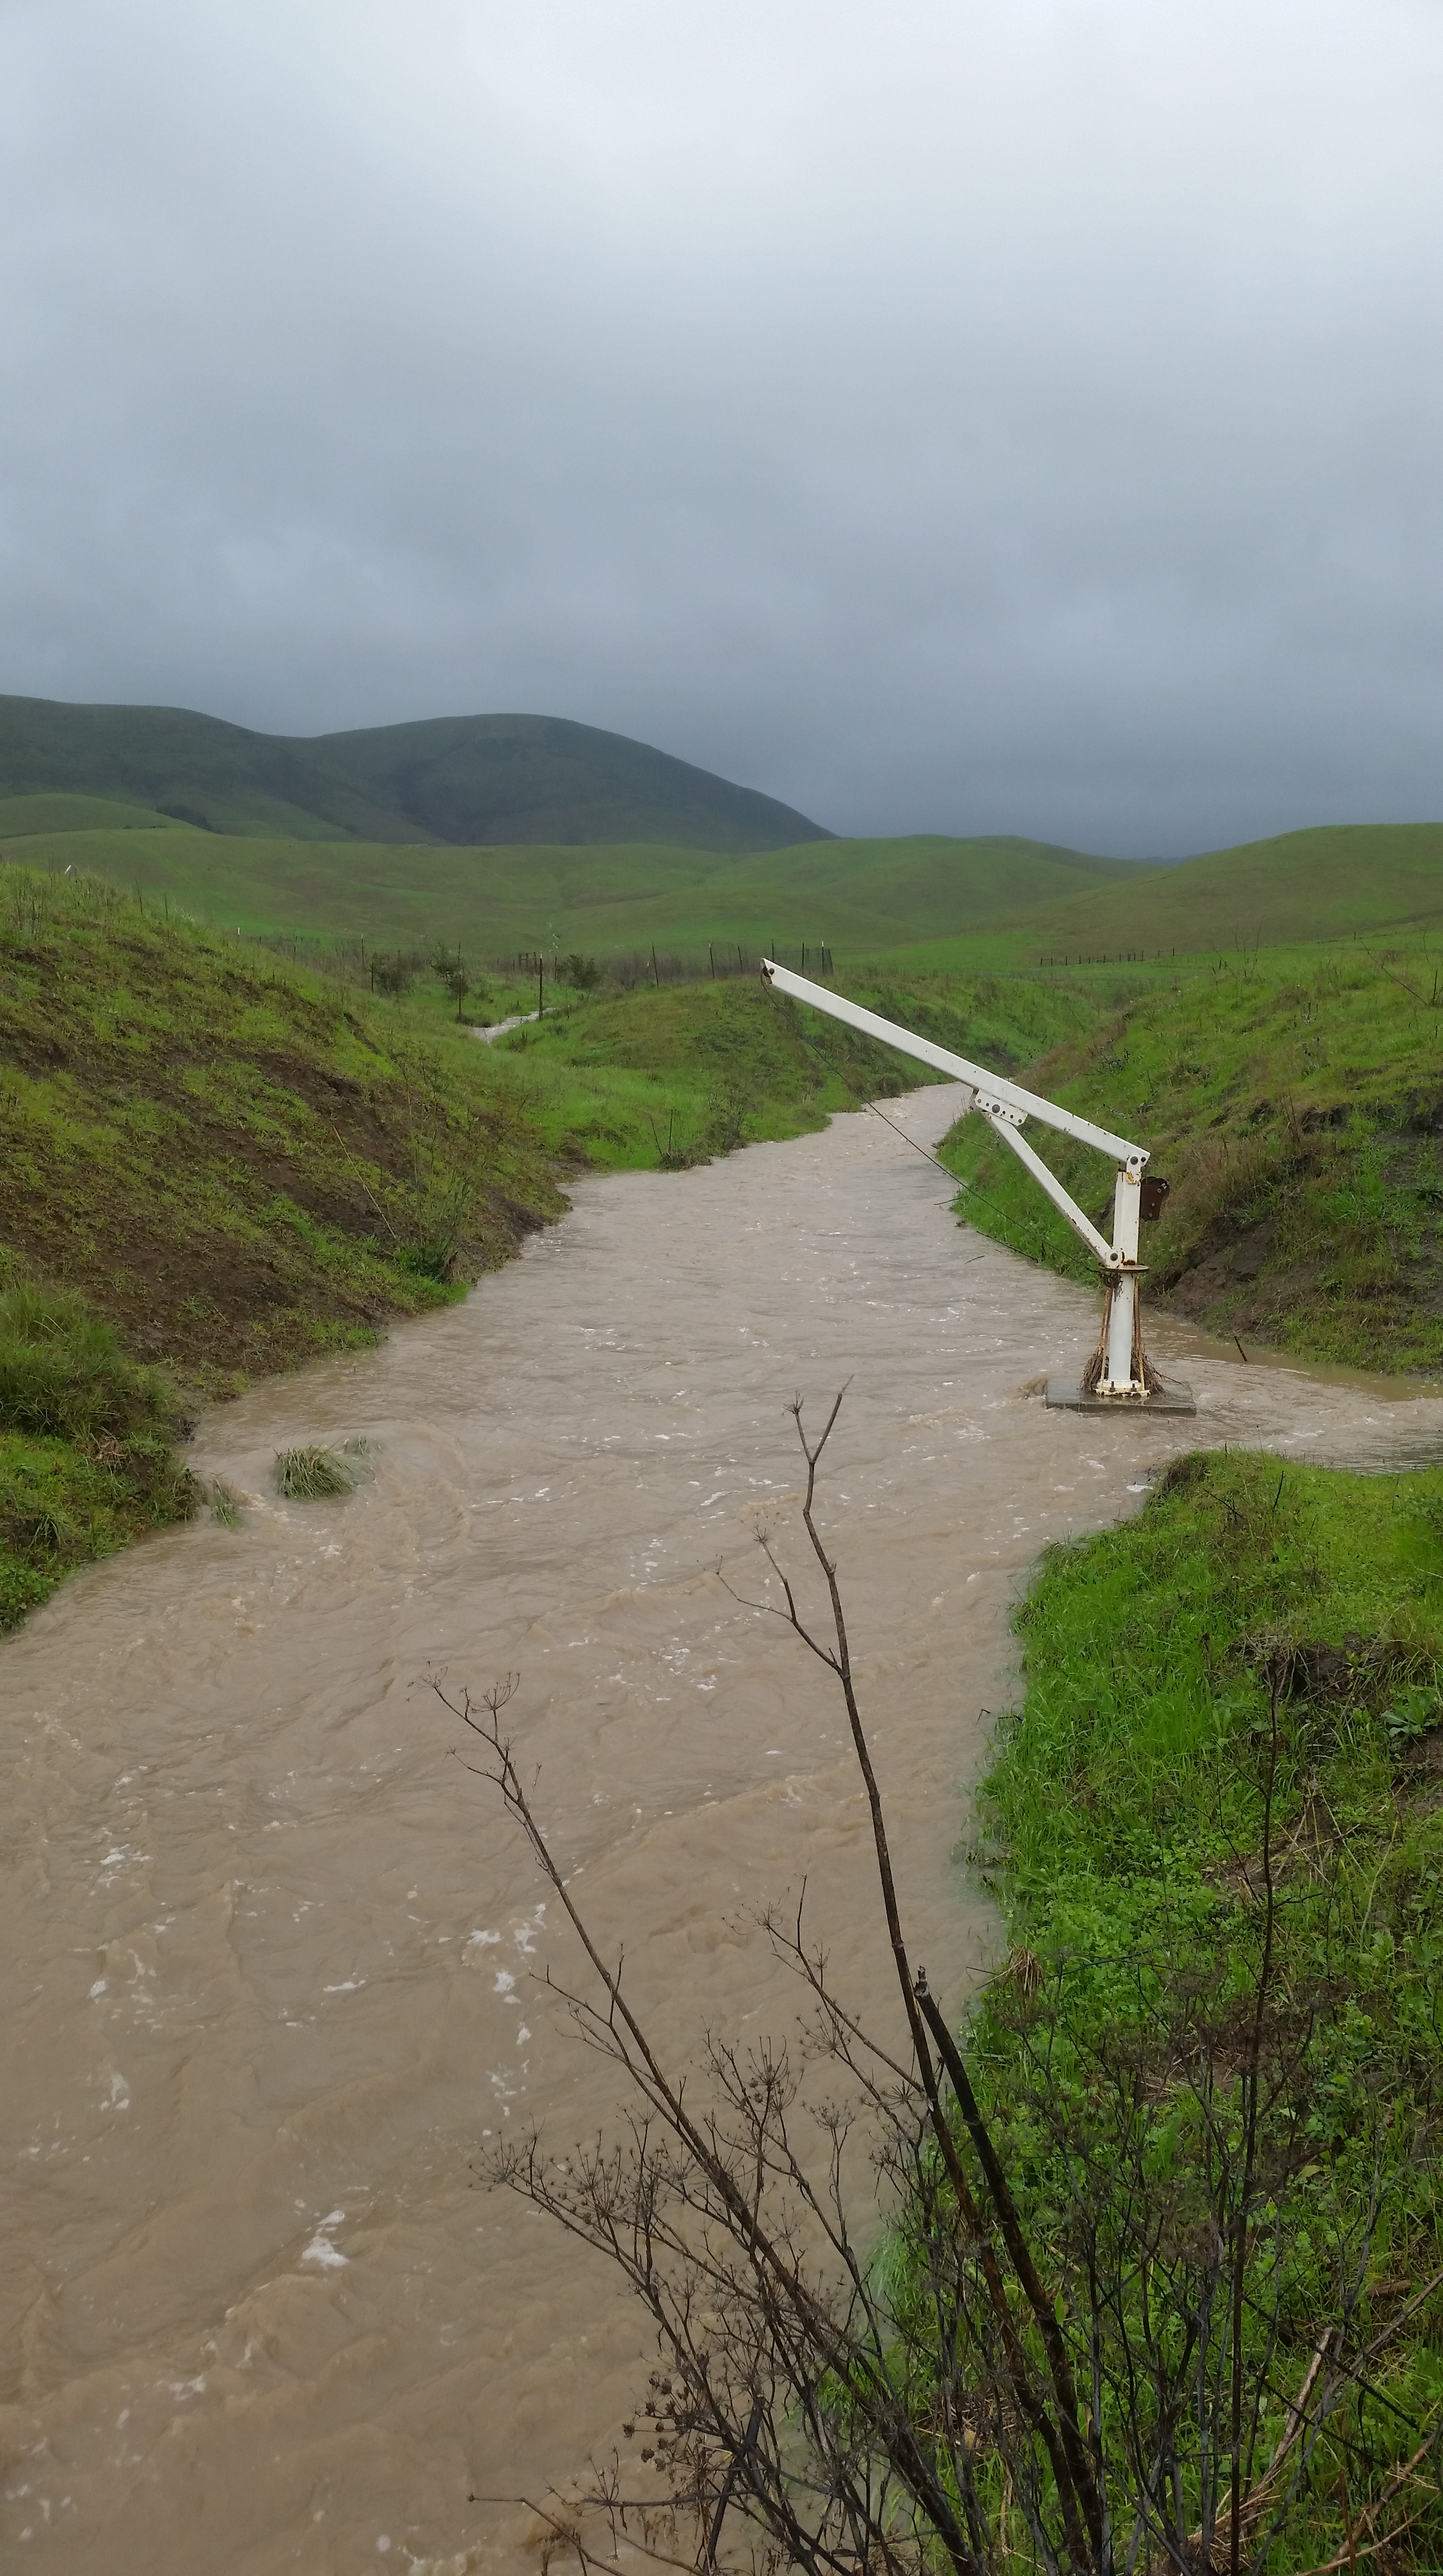
We focused our sediment monitoring efforts in January on Walters Creek and Chorro Creek at Canet Road and deployed our samplers for each storm event after the January 4 rain. The bottles at each sediment collection station have to be changed out every 12 hours. As you can imagine, this kept our field staff busy! Here are some photos to help explain and show our sediment monitoring process.
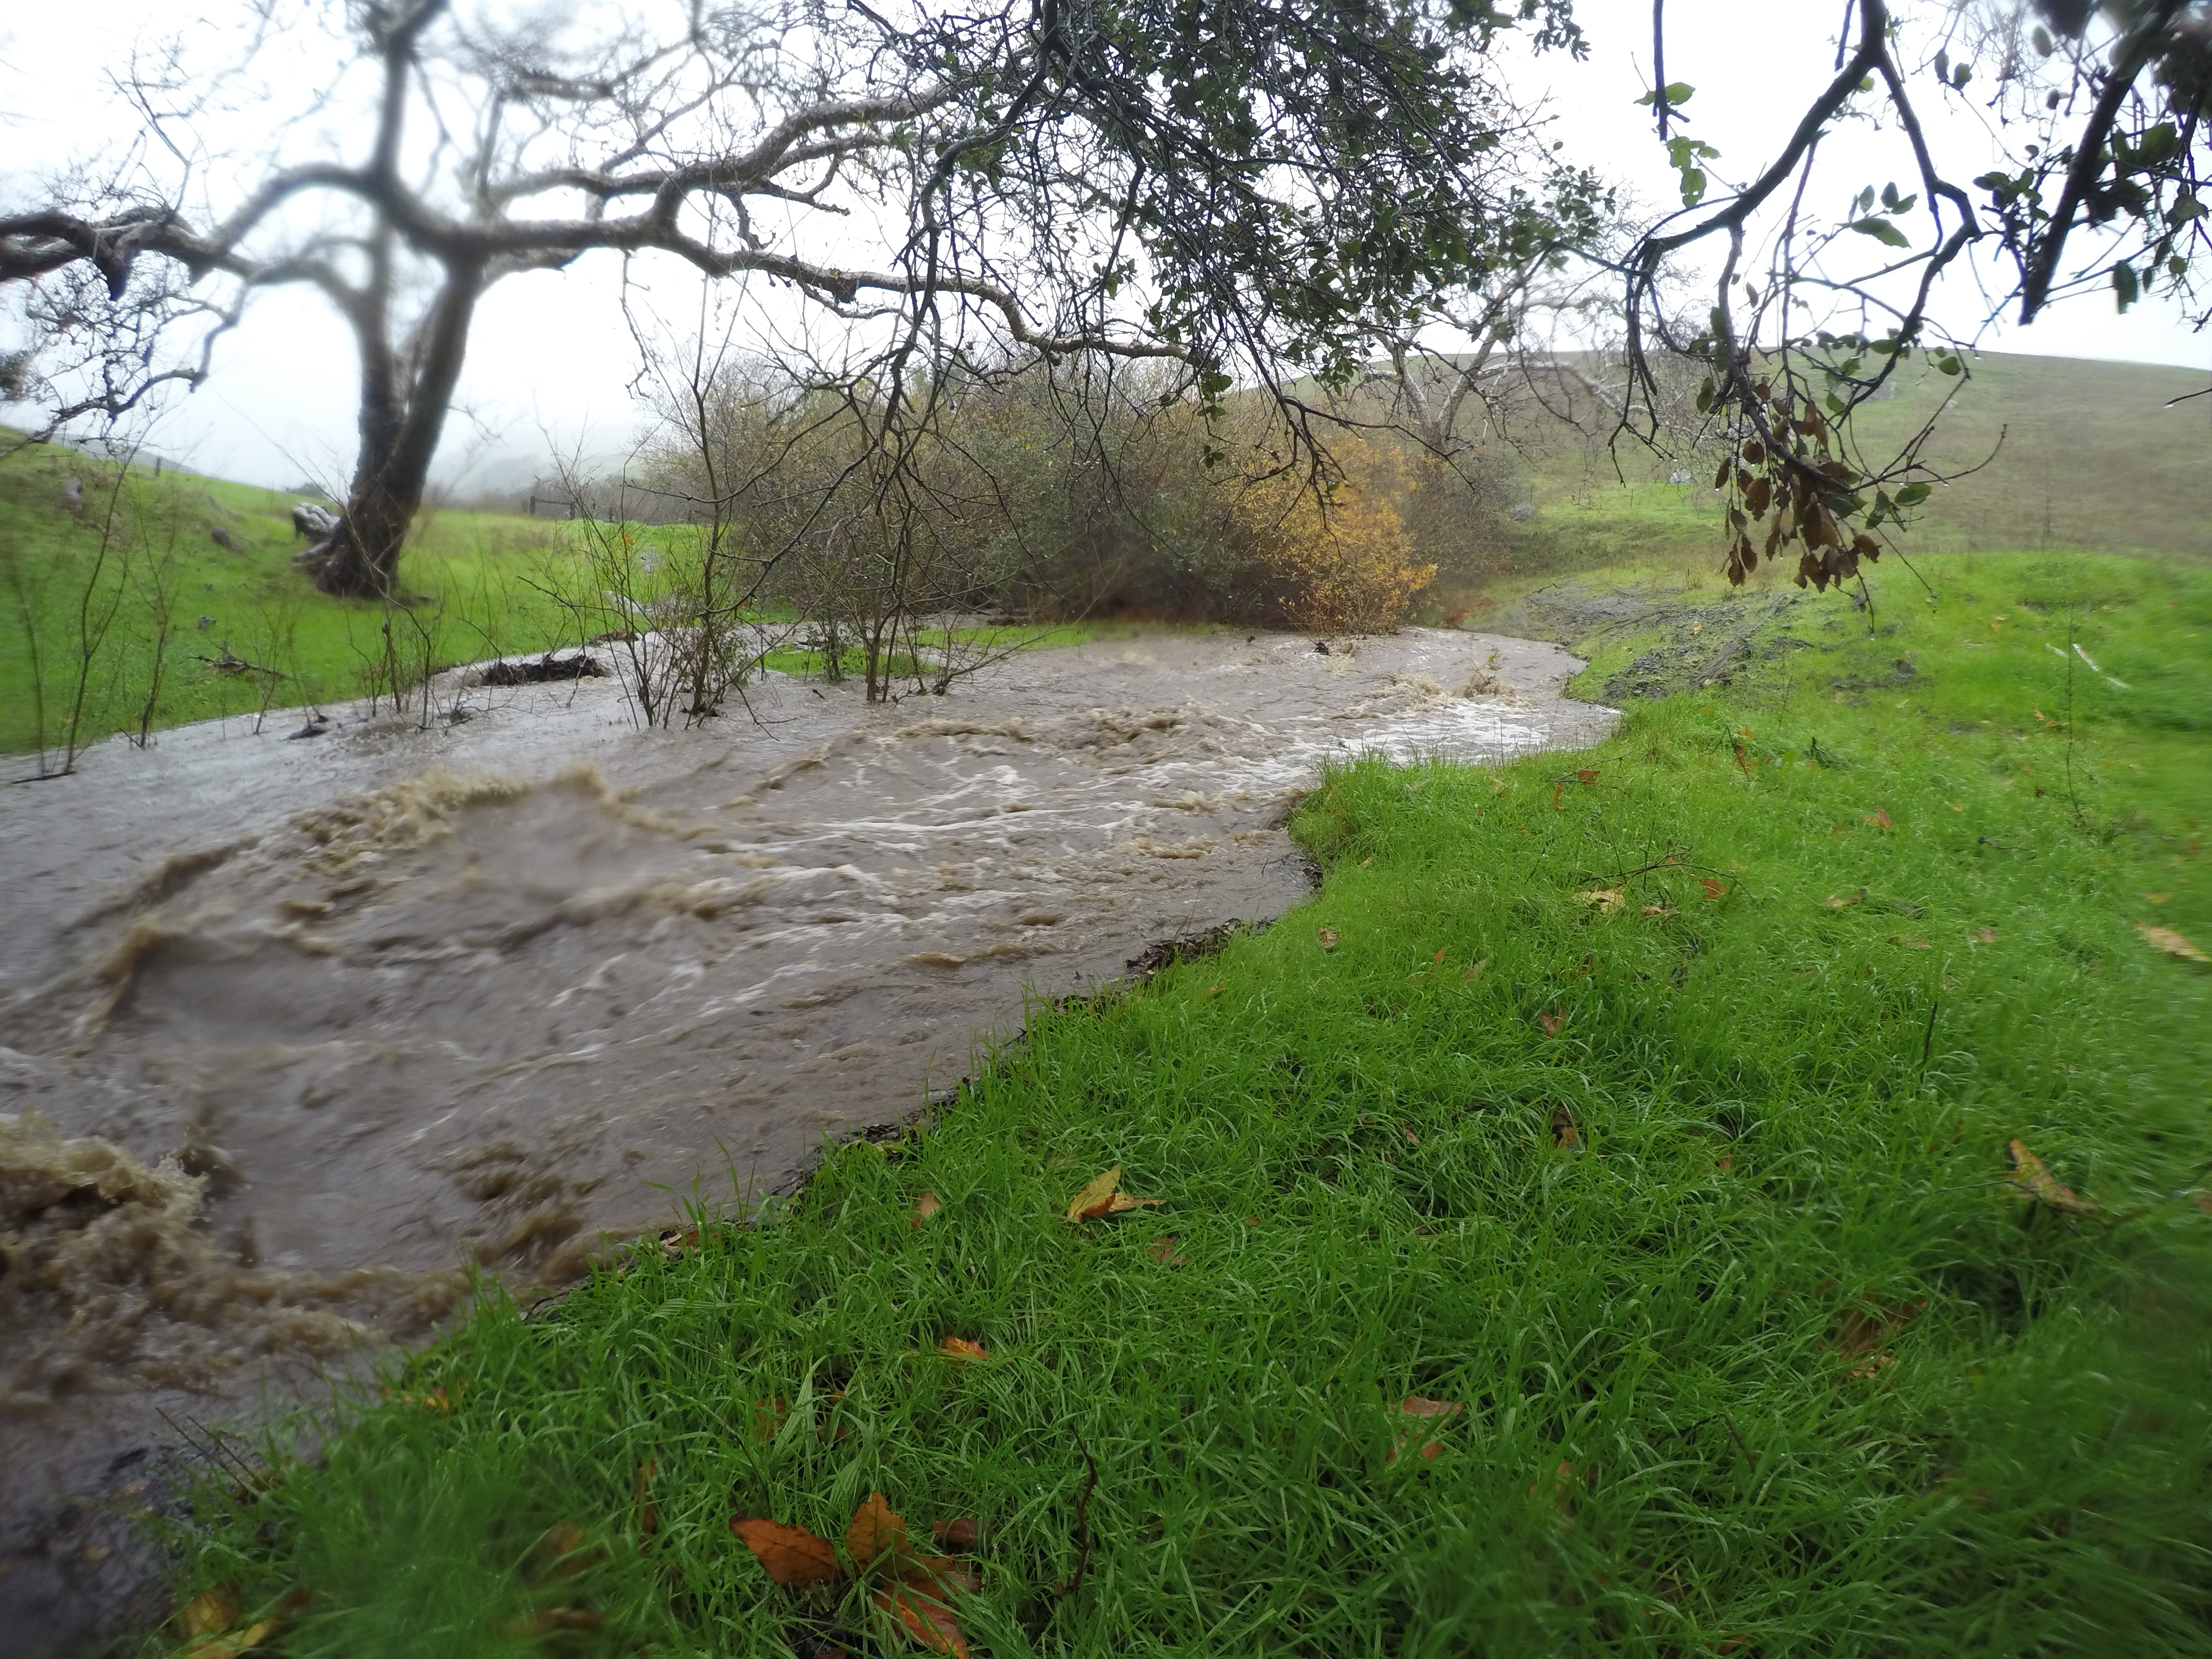
Over the course of the month we got to see Walters go from just starting to flow, to becoming a rushing creek.
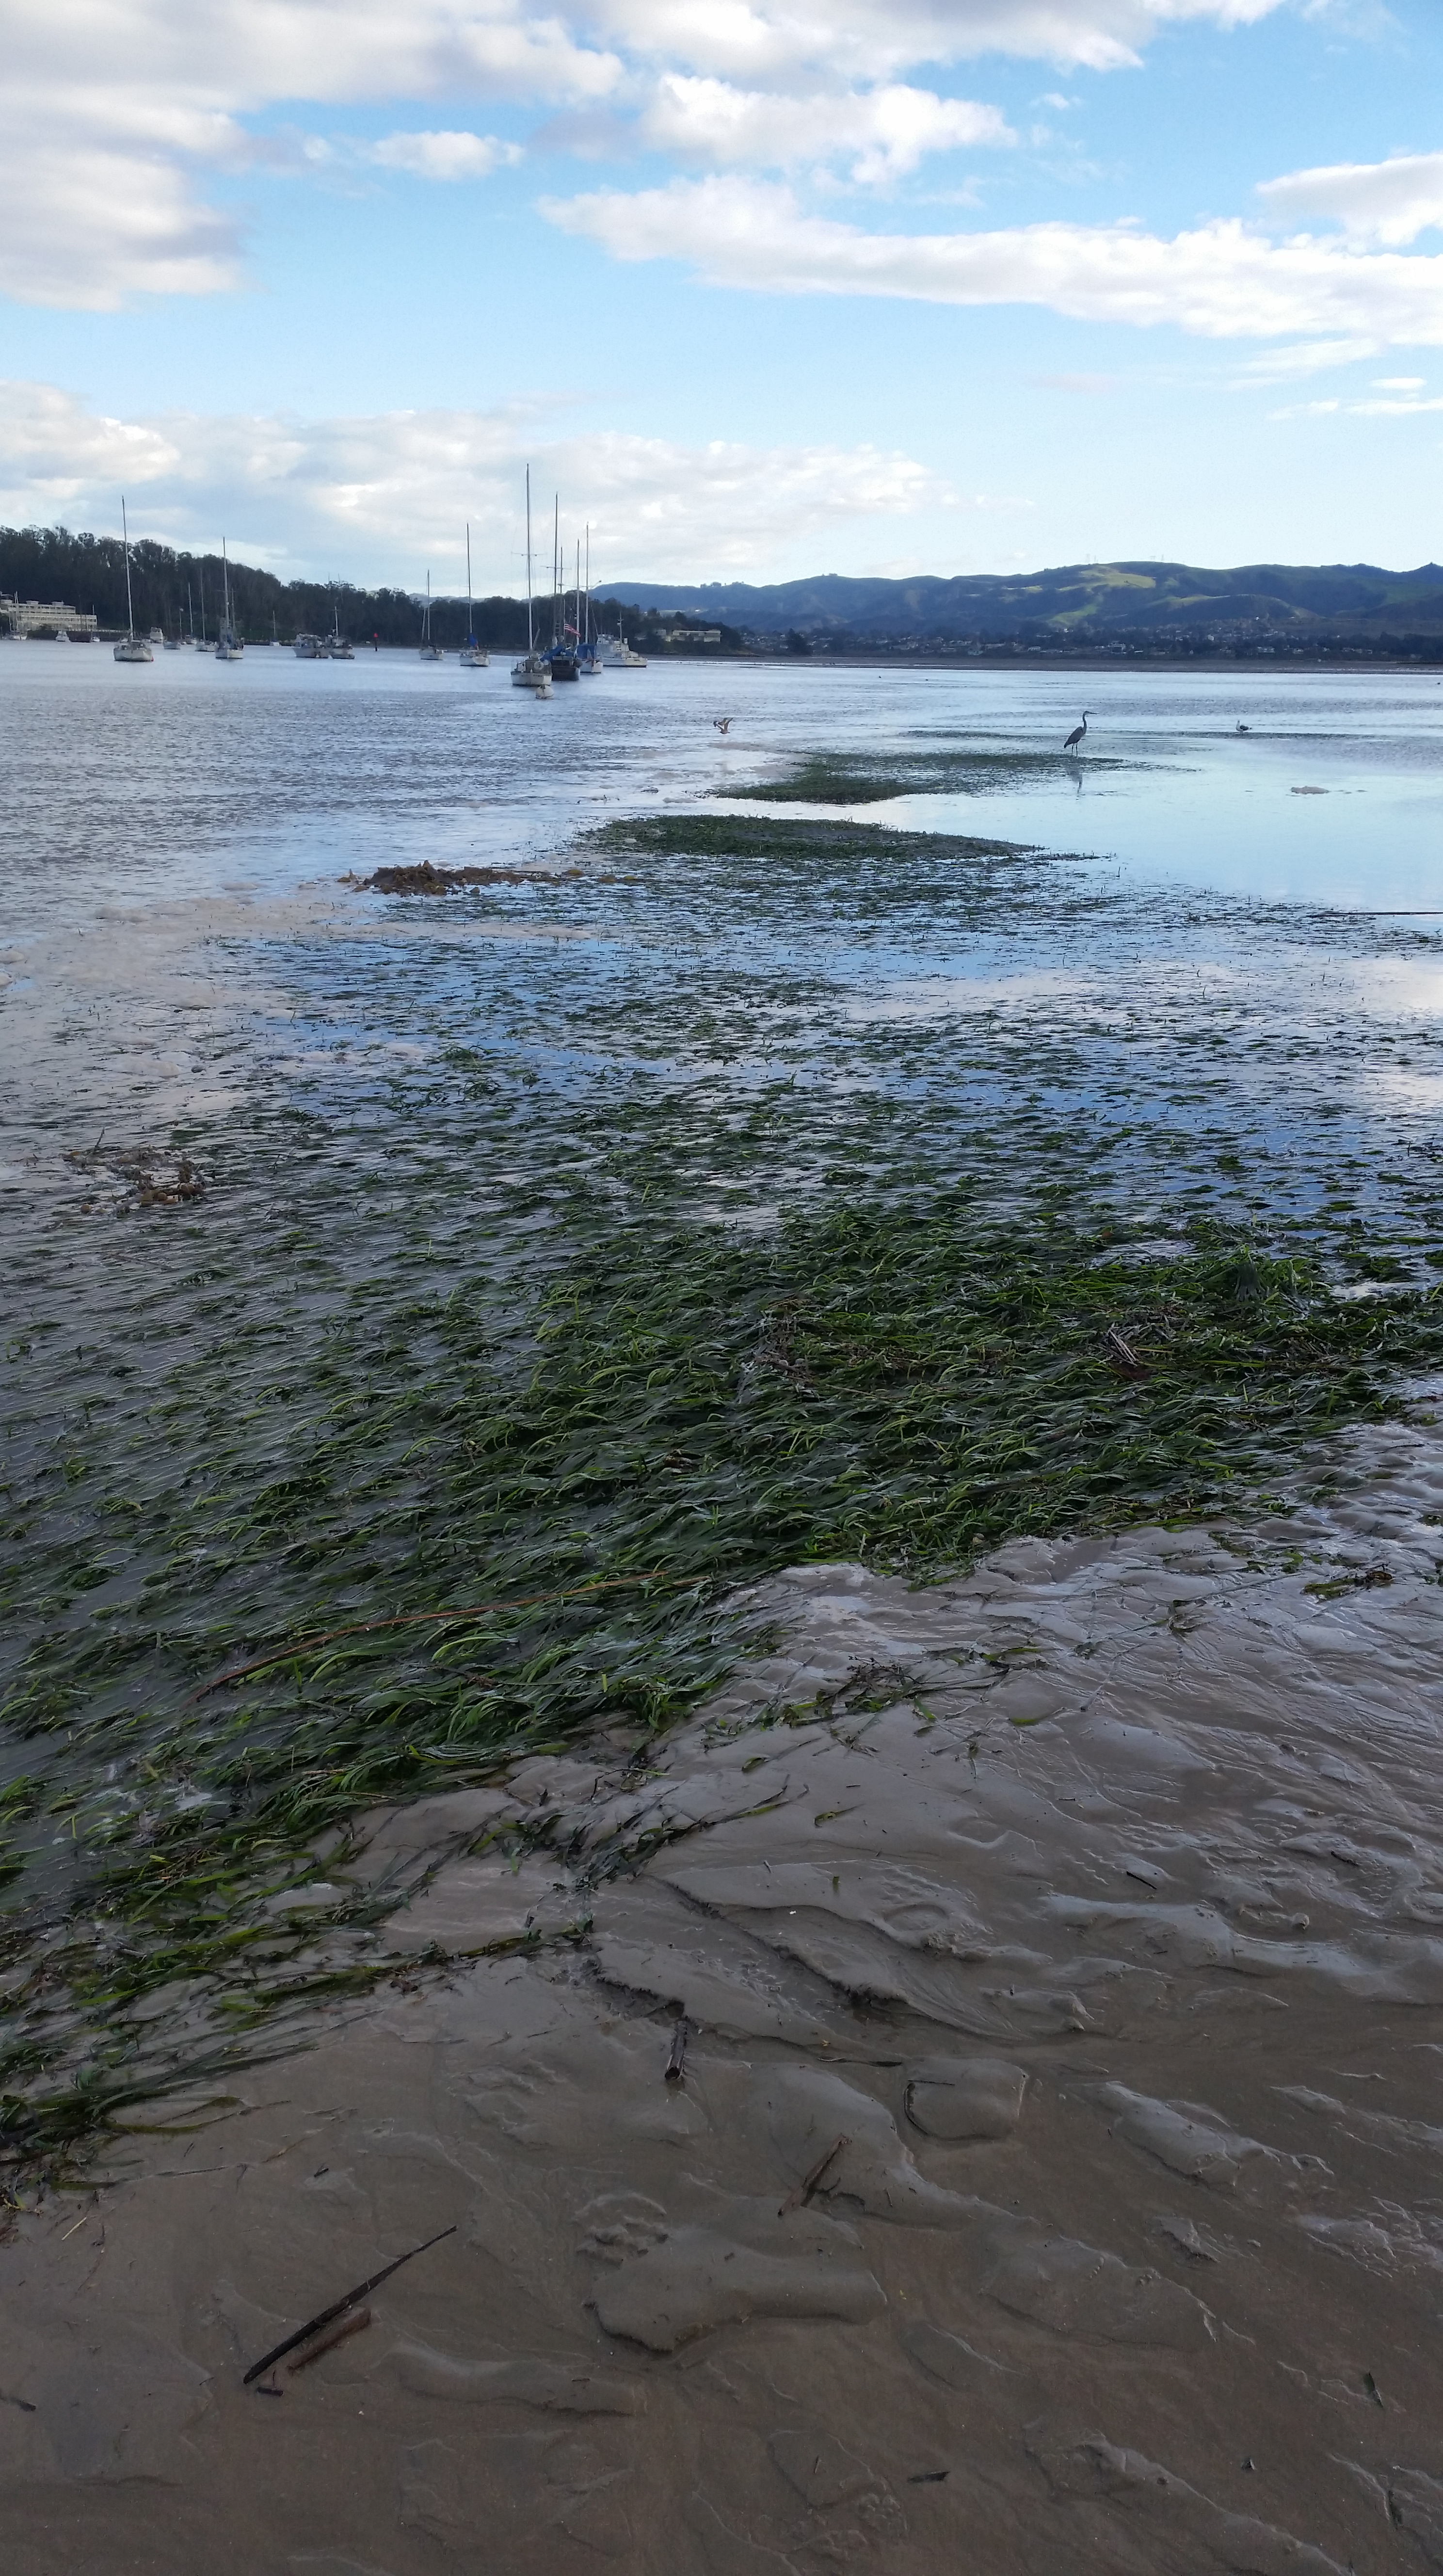
Eelgrass Monitoring
Our field staff spends a lot of time out on paddleboards and kayaks. Recently, Karissa, Shane and Carolyn got to take a kayaking and SUP safety course with members of the eelgrass team from CalPoly, to further their paddling skills. They spent a sunny, calm morning learning new paddle strokes and practicing rescue techniques. A huge thanks to CalPoly for letting our staff join them for this class!
During a break in the rain, we completed one eelgrass survey out on the sandspit, across from Tidelands Park.
For more detailed information on our sediment study findings, read our most recent sediment report.