As a science-based organization, an important focus of the Estuary Program is to collect monitoring data that will inform our management decisions. As part of this process, we compile and analyze data every three years to create an environmental report card called the State of the Bay. Our 2017 report contains data that the Estuary Program and our partners have collected over the years.
In this series of posts, we present some of the highlights from the State of the Bay 2017 report. This first post discusses water quality in the bay and local creeks. The second post will cover eelgrass, sediment, and climate change. The third post will discuss habitat protection, birds, and steelhead.
These posts lead up to our month-long series of State of the Bay events, which begins on Saturday, April 1 with a Clean Water Talk and Wild Ale Launch in partnership with the Libertine Pub. Proceeds benefit the Estuary Program. Join us there and throughout April to explore our estuary through science.
Oxygen in Morro Bay
Plants, birds, animals, and aquatic life depend on clean water and healthy habitats. Just as we need oxygen to survive, the waters of our estuary and creeks must maintain a certain concentration of oxygen to support a diversity of life.
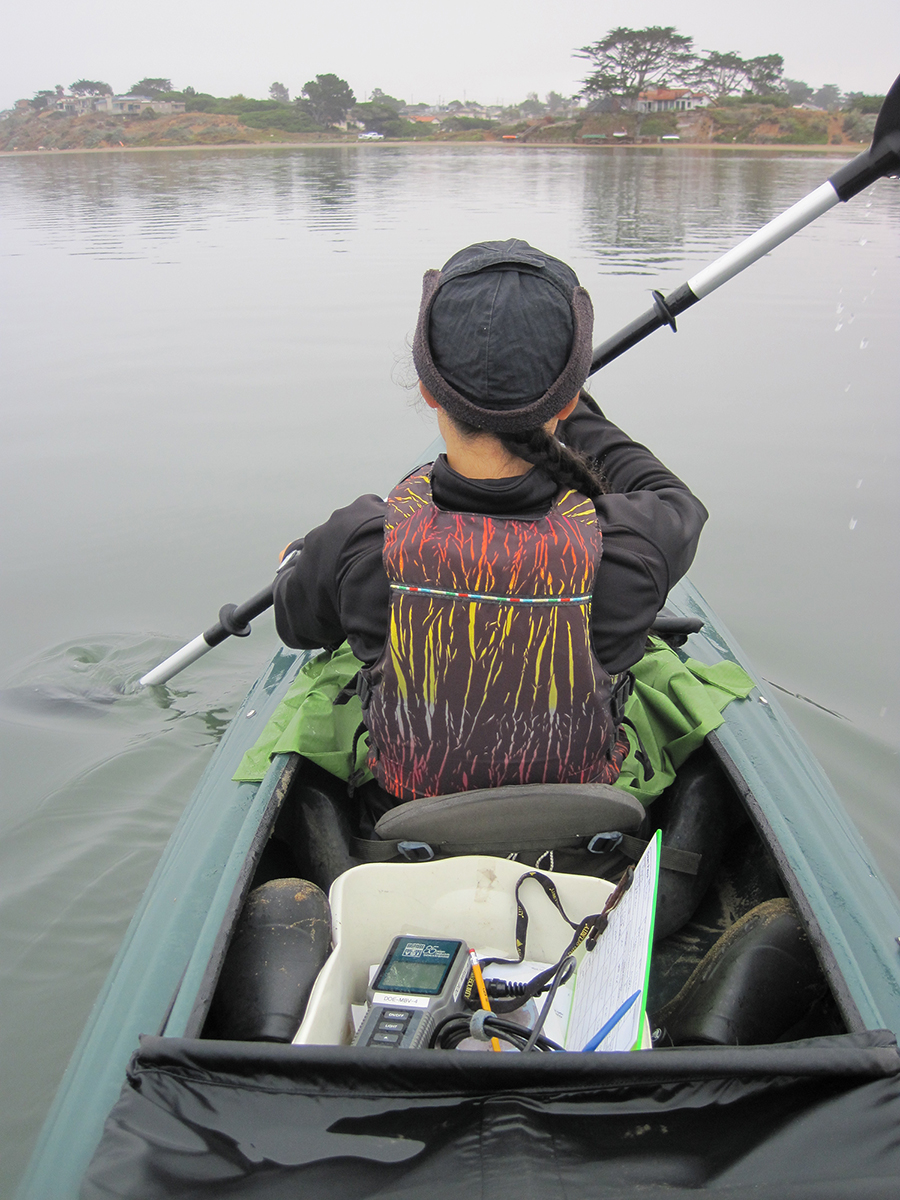
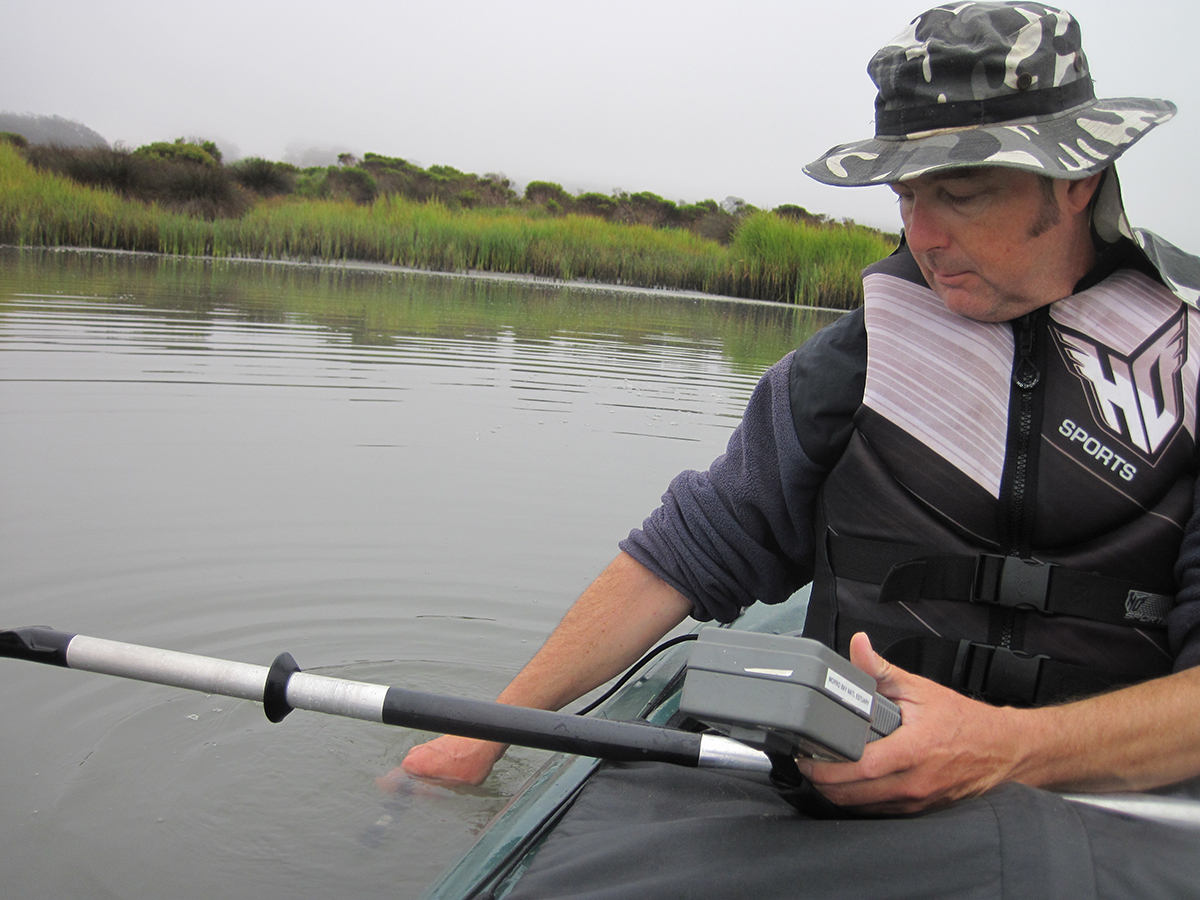
The map below shows a score for dissolved oxygen, which is the amount of oxygen available in water for plants and animals. Estuary Program volunteers paddled the bay’s waters in the early morning hours to collect this data. They go out so early in order to capture the lowest oxygen levels of the day, which typically occur just as the sun is coming up. Locations marked by a yellow drop have oxygen levels that are considered to be Fair. They are lower than ideal, but will still support healthy populations of fish and marine life. Sites colored orange are considered to have Poor oxygen levels, and those colored red have Very Poor levels. These sites may not support a diversity of aquatic life.
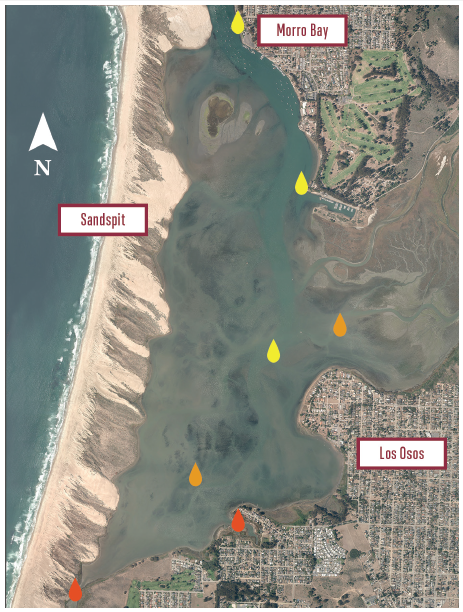
These low oxygen conditions are partly due to the physical layout of the bay. The back bay’s shallow waters do not get flushed out by the tide as frequently because they are farther from the bay mouth and deeper tidal channels. Shallow water also warms more quickly in the sun, and warmer water cannot hold as much oxygen as colder water.
Bugs and Creek Habitat Health
The type of bugs living in a creek can tell you about the water quality there. Bugs that spend a portion of their life cycle in the creek have different levels of sensitivity to pollution and poor water quality conditions.
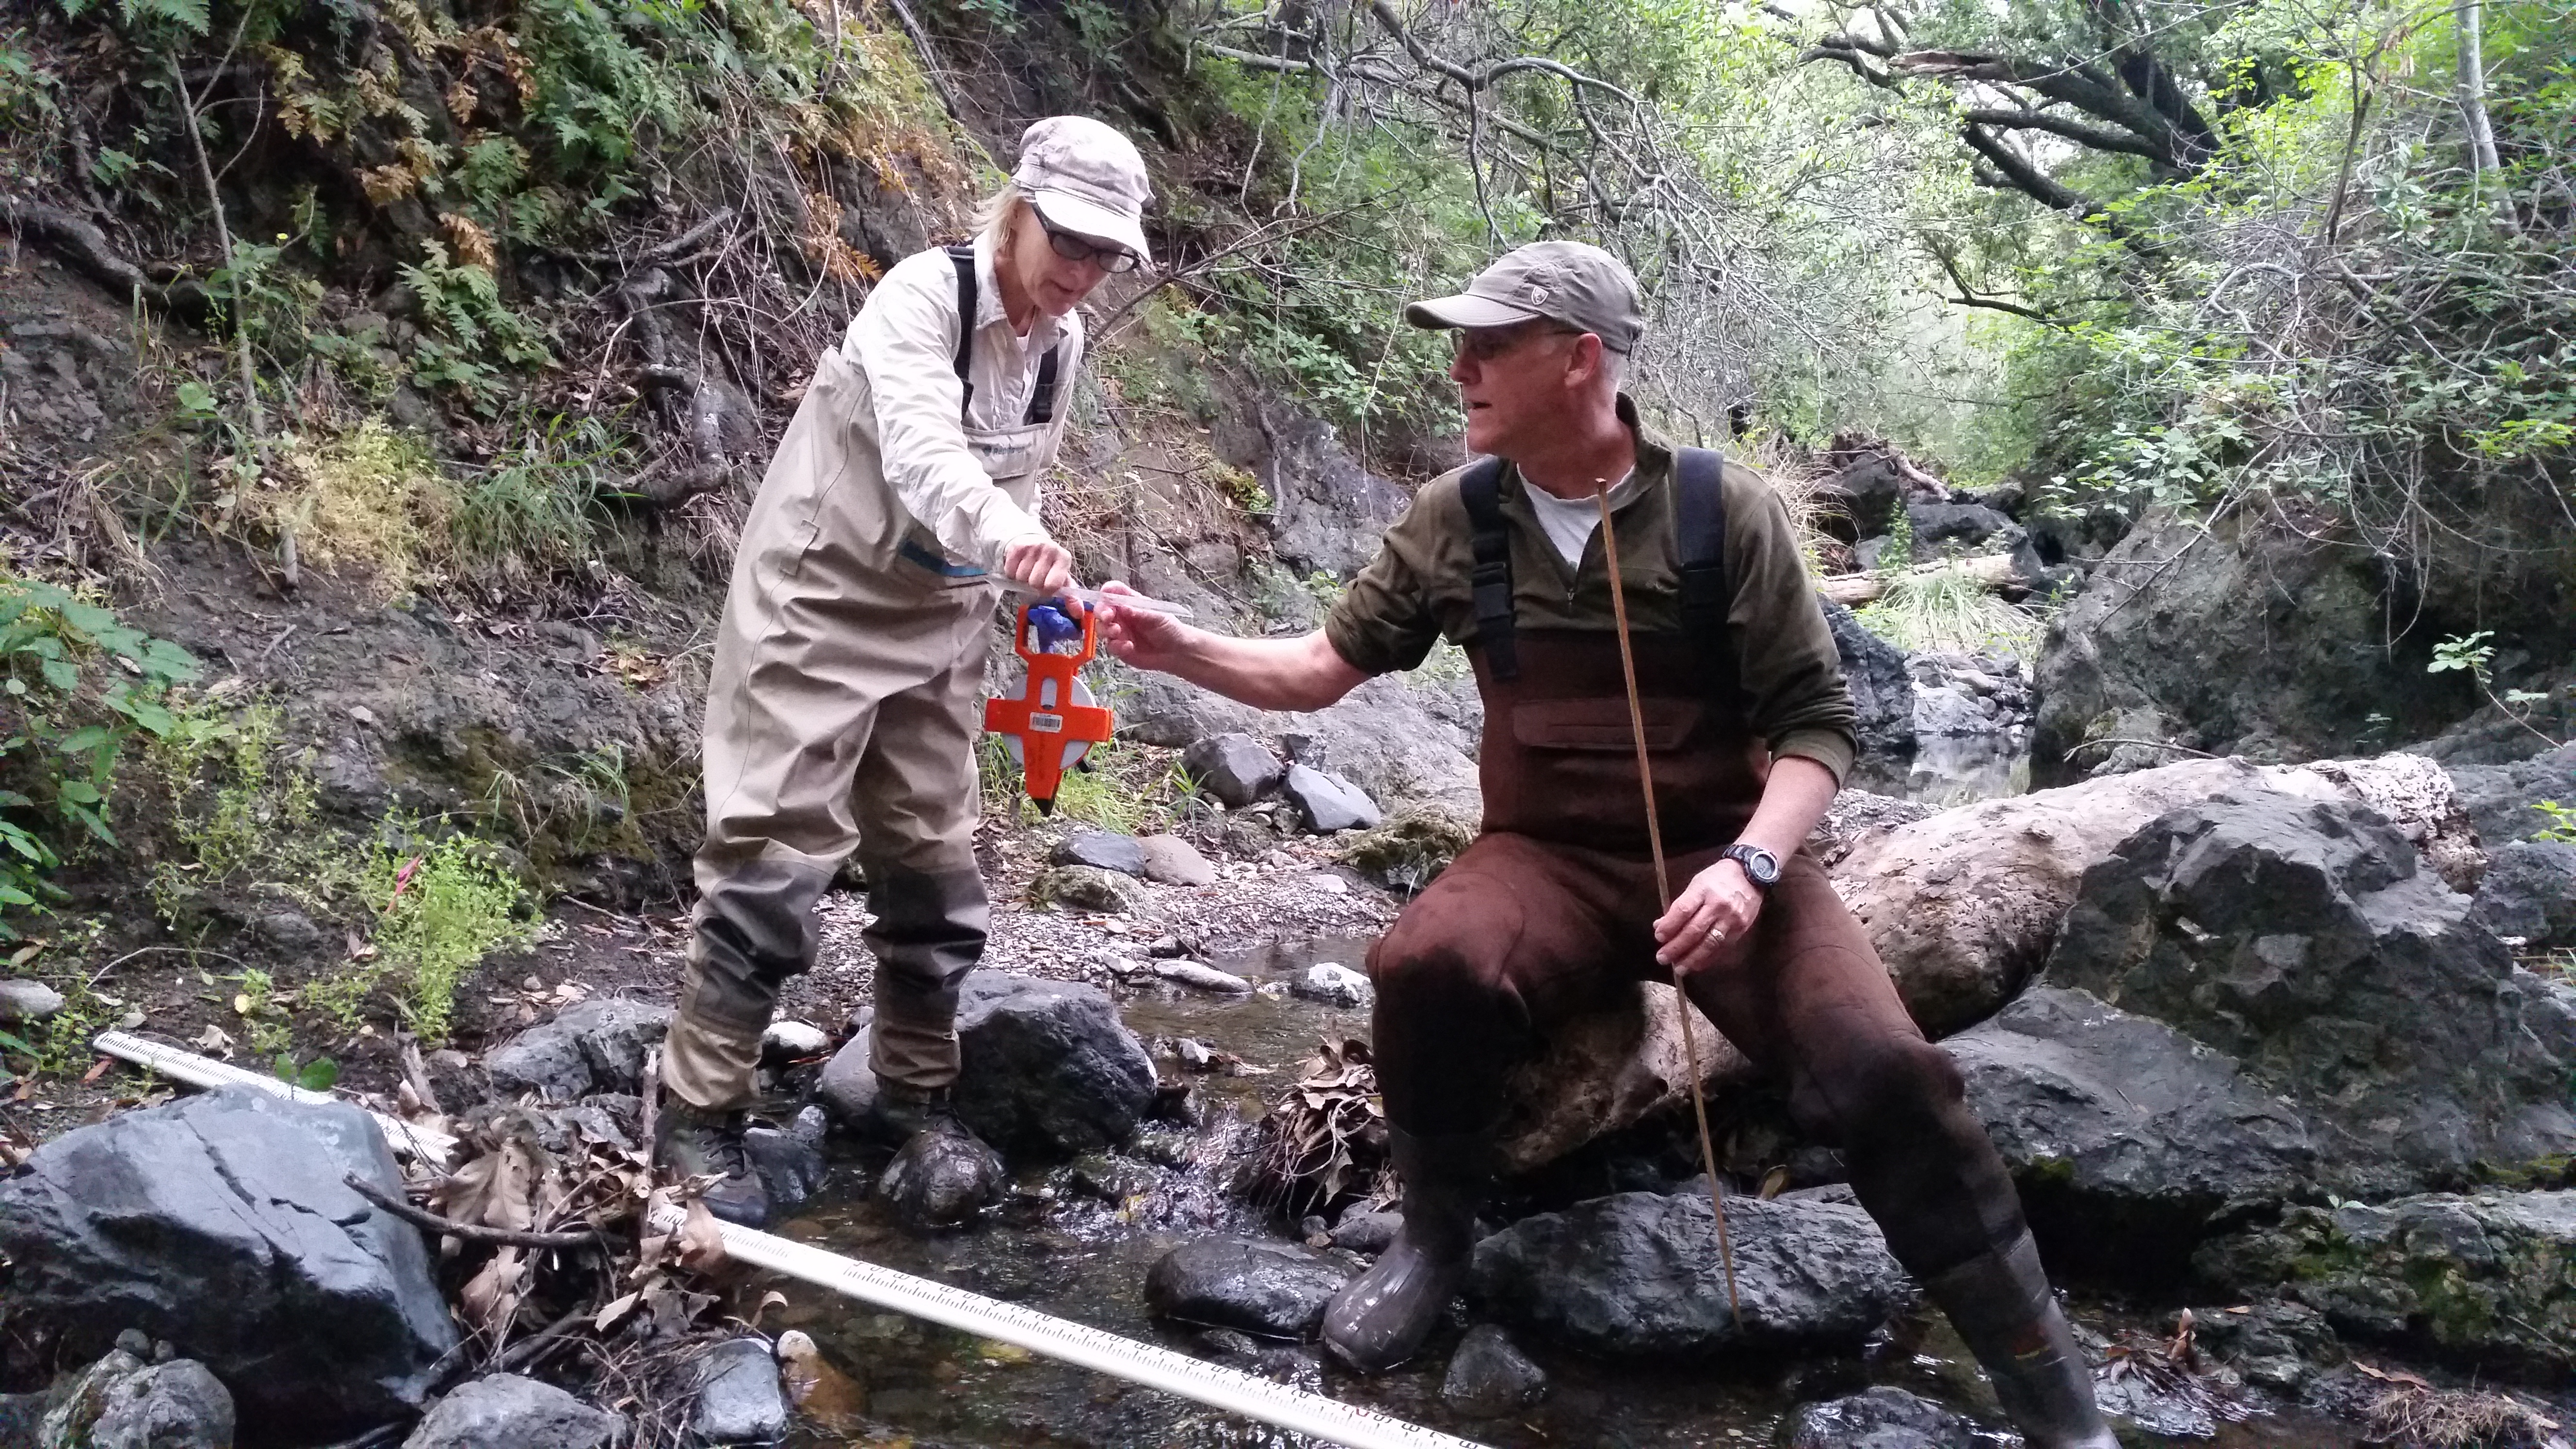
When sensitive bugs such as stoneflies and mayflies are found in a creek, it indicates that the water is cool and well-oxygenated with minimal pollutants. Other bugs, such as worms and snails, are tolerant of poor water quality and habitat. Based on the types of bugs living a creek, we assign it a score according to a system developed by the state of California. We collect bugs from local creeks each spring and send them to a lab for sorting, counting, and identification.
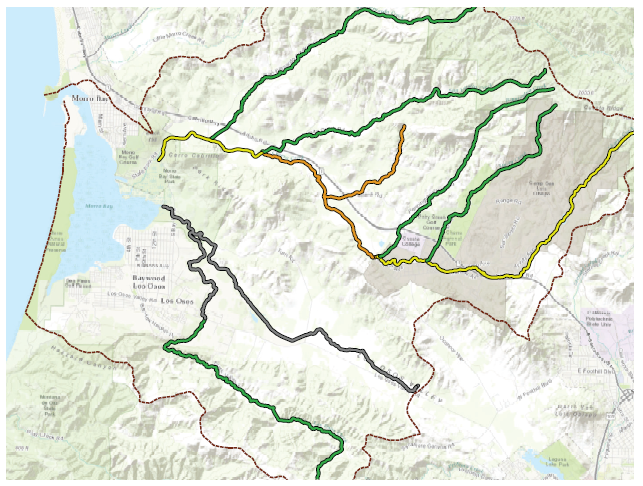
The map above shows averaged scores for all sites on each creek. The date range varies by site, with some data going back to the mid-1990s. The creeks colored green have a Good rating, with water quality and habitat to support sensitive bugs and fish. Those colored yellow have a Fair rating and can still support robust aquatic life, but habitat quality is degraded and sensitive species may not thrive. Creeks with a Poor rating are colored orange. And those colored grey are areas for which we lack data. Overall, the Morro Bay watershed creeks support healthy populations of bugs, with some impacts on Walters Creek and middle Chorro Creek
Safe Swimming: Bacteria in the Bay
The waters of our bay support a diversity of uses including sailing, kayaking, and fishing. The bay also supports two commercial shellfish farming operations. Clean water is essential to each of these uses of our bay. If the water isn’t clean, it can transmit bacteria, viruses, and protozoa that can cause illnesses in humans.
Potentially harmful bacteria can reach the bay from sewage spills, stormwater runoff from our streets, and waste from wildlife or domestic animals.
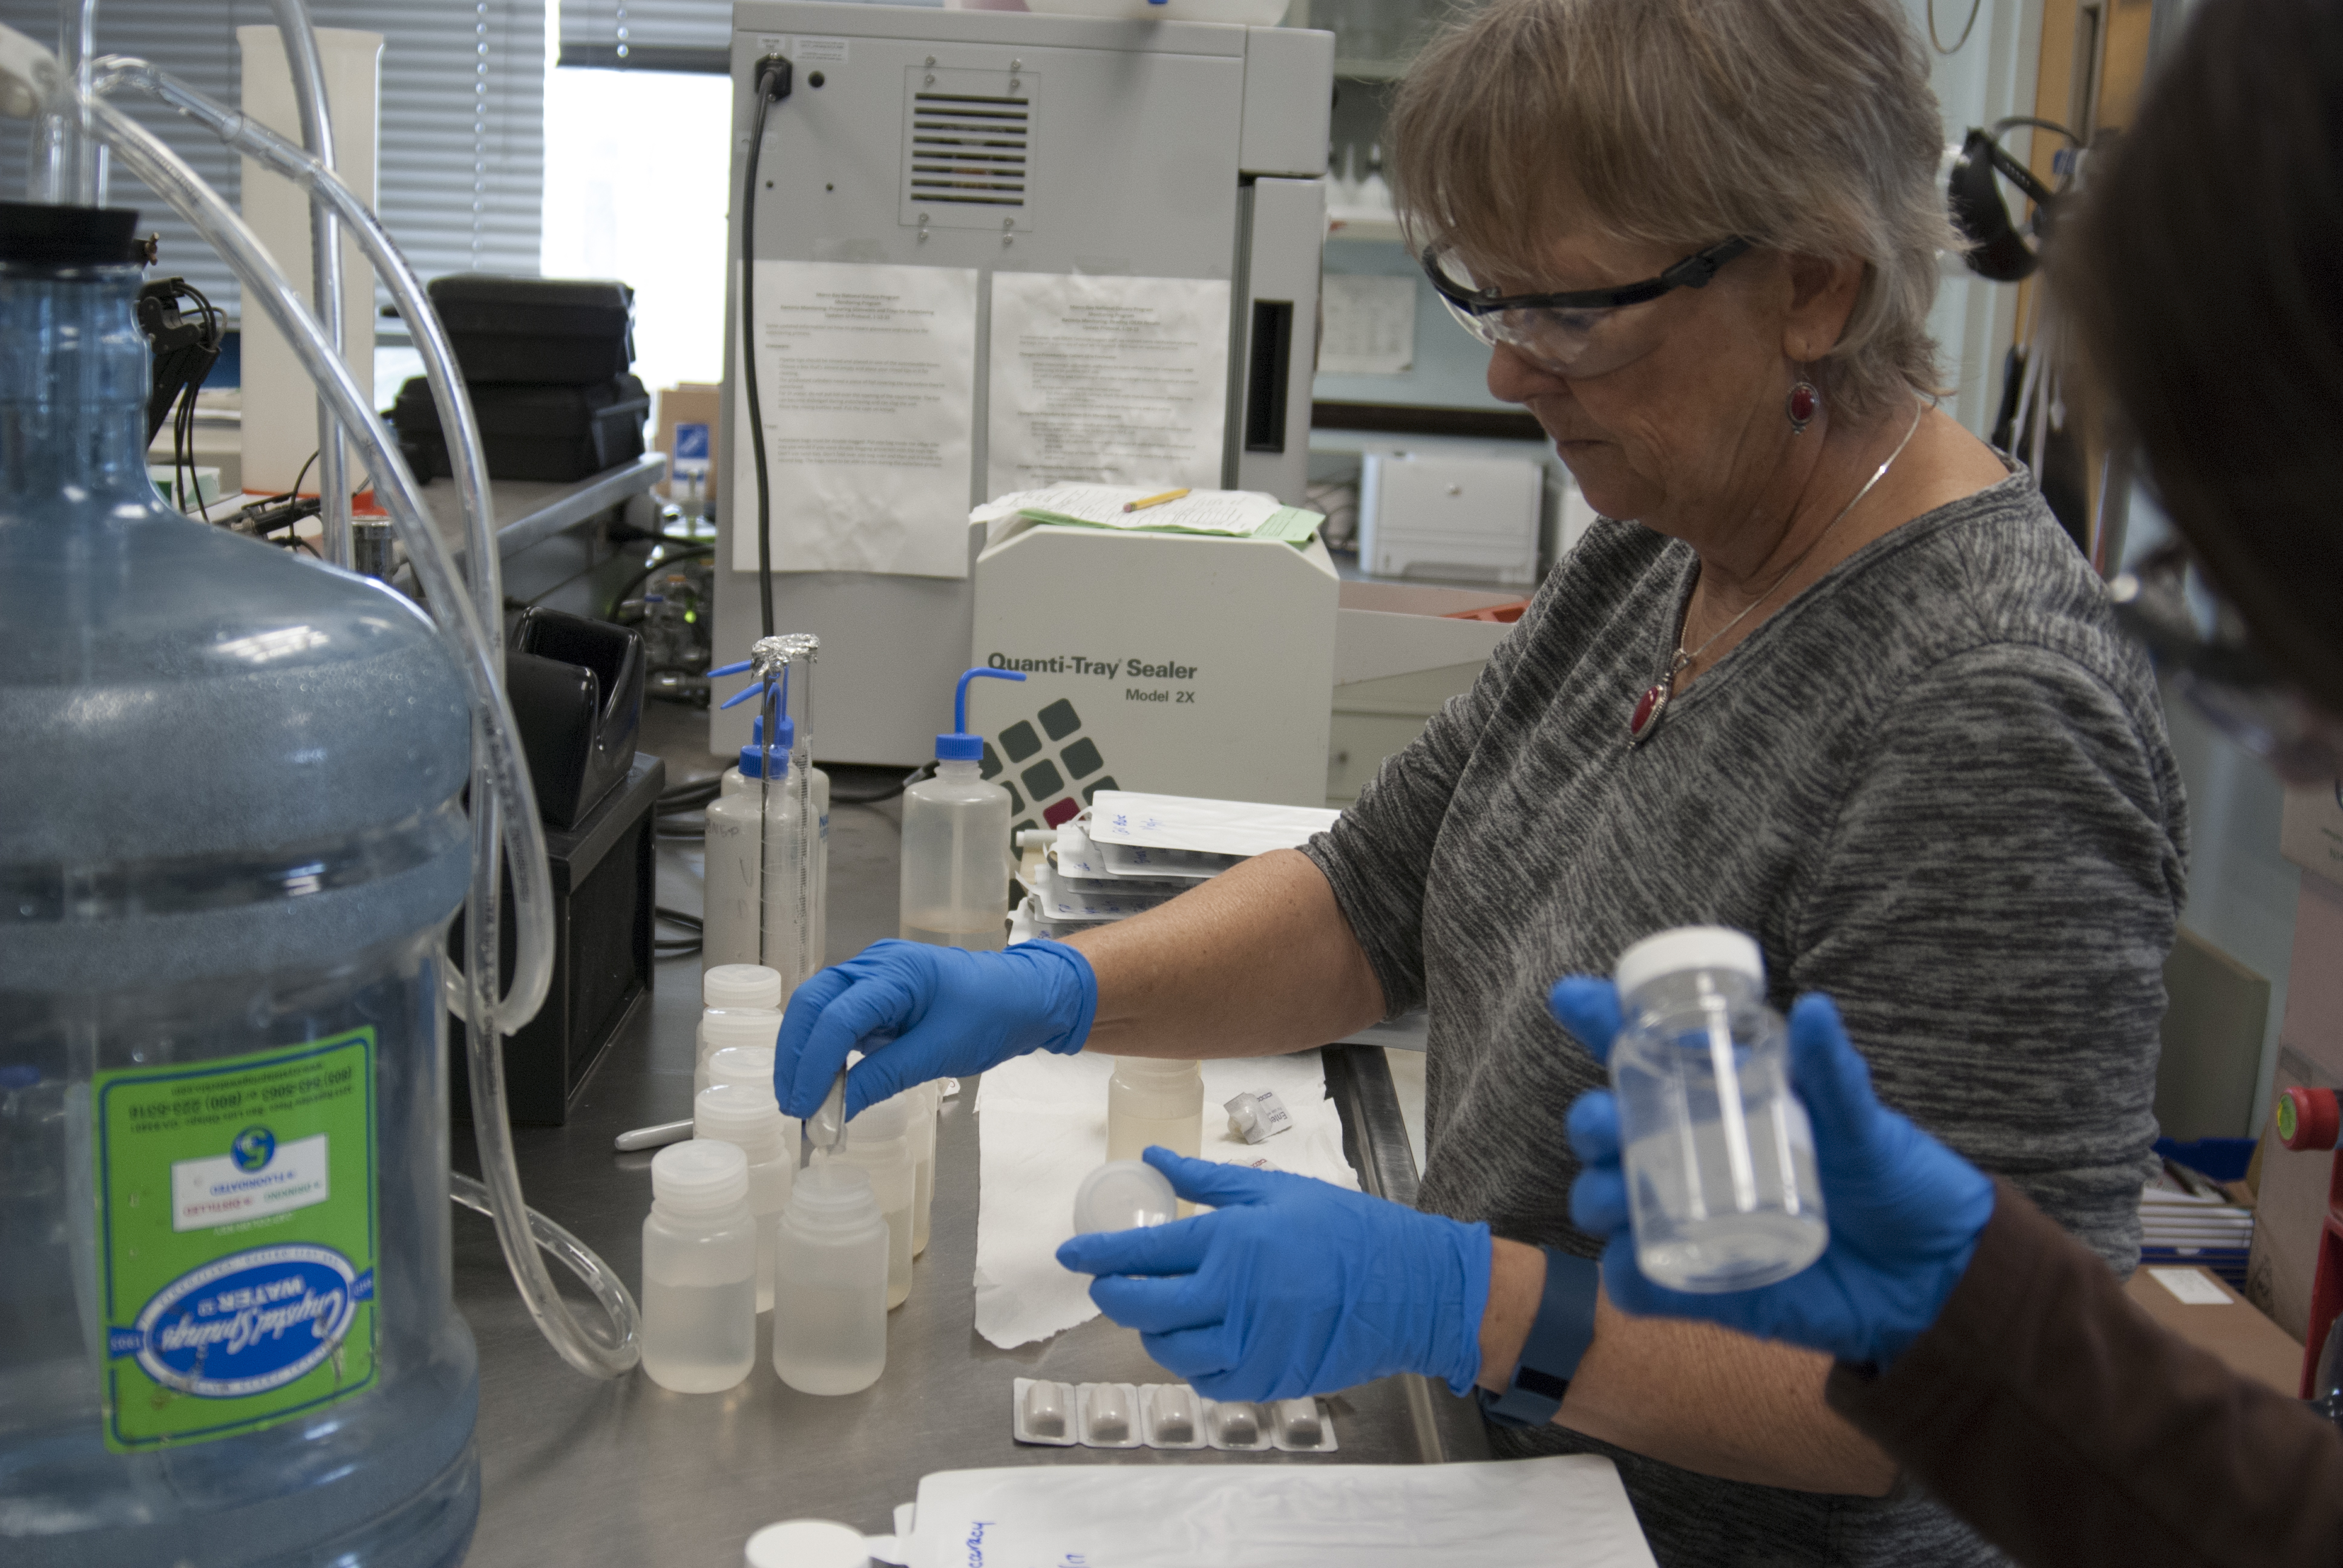
To determine the safety of our bay’s waters for recreational use, Estuary Program volunteers conduct monthly testing at eight bay-shoreline sites. Volunteers test the water for indicator bacteria, which are those that tend to be present when fecal matter is present.
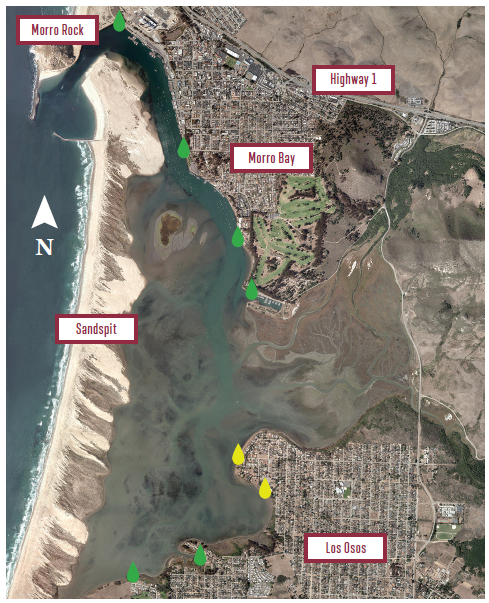
The map above shows the results of monthly sampling for enterococcus, an indicator bacteria for marine waters. Green drops indicate sites with good water quality measured in most of the samples since 2005. Yellow drops indicate slightly elevated bacteria levels. Those sites exceeded the bacteria levels for safe swimming in 20% or less of the samples tested. For the most part, it is safe to recreate in Morro Bay’s waters. But remember, always wash your hands after coming in contact with waters, and stay out of the water for 72 hours following a storm.
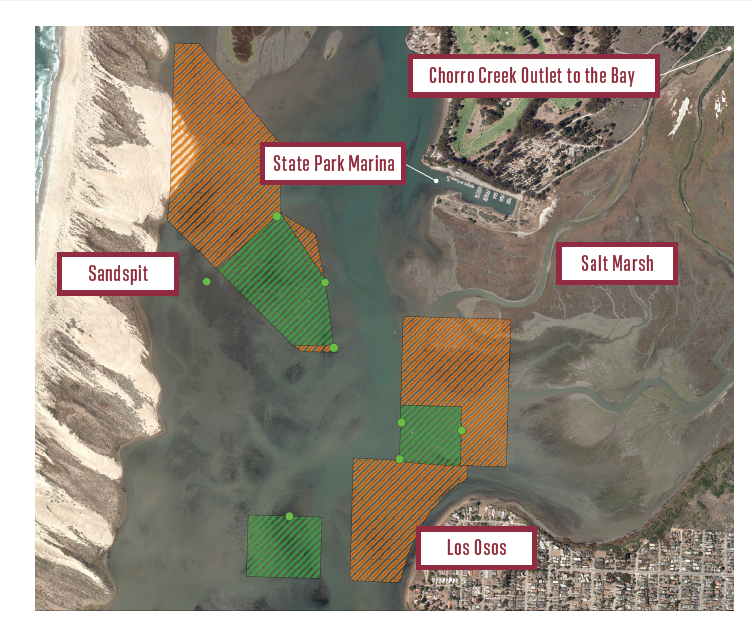
The map above shows the active shellfish farming lease areas, where harvesting can occur, in green. Harvesting is prohibited in inactive lease areas, shown in orange, due to historically poor water quality or lack of data. The dots indicate regular testing locations, and the green color indicates bacteria levels that are safe for harvesting. This means that the waters are clean enough such that shellfish grown in these areas are safe to eat.
For more details on this and other related data, read the full report available on our website.
Tune in next week for a discussion of eelgrass, sedimentation, and climate change data.