What is the California King Tides Project?
Scientists need you to be their eyes on the ocean December 13–15, 2020 and—if you live north of Point Conception—January 11 and 12, 2021. On these dates, the California coast will experience King Tides, the highest tides of the year. These extreme tides often encroach on infrastructure, submerging coastal access stairways, swallowing beach-side trails, overwhelming boardwalks, surging into storm-drains, and flooding roads. They can also inundate coastal habitats that aren’t typically submerged, like higher marsh areas or even dune scrub.
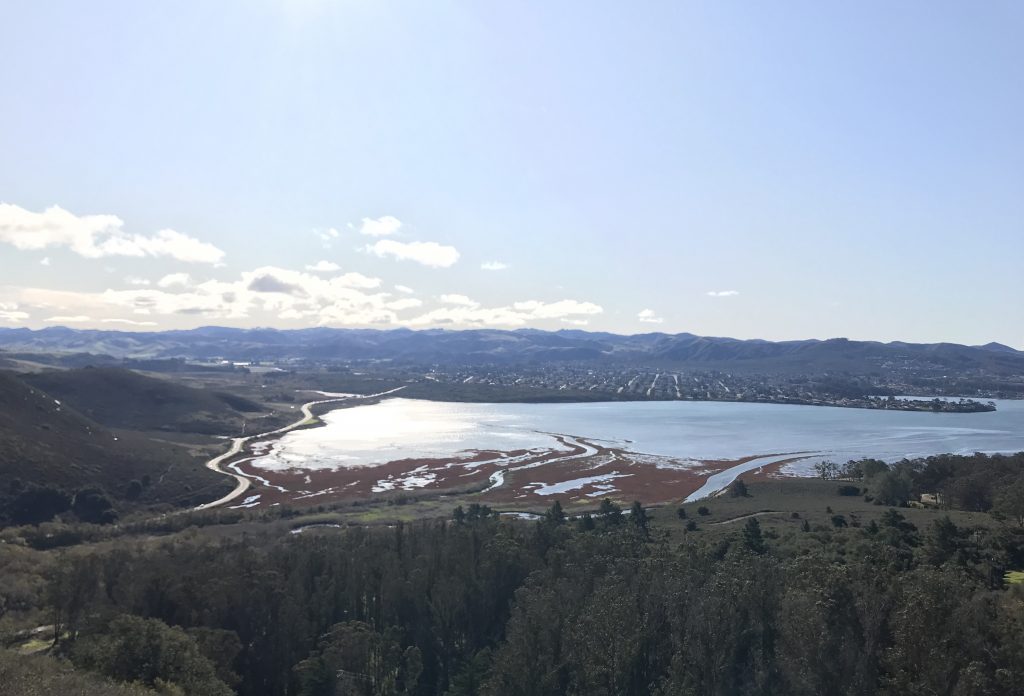
With the rate of sea level rise increasing worldwide, what we consider ultra-high tides today may be what we experience every day in 2050 or 2100.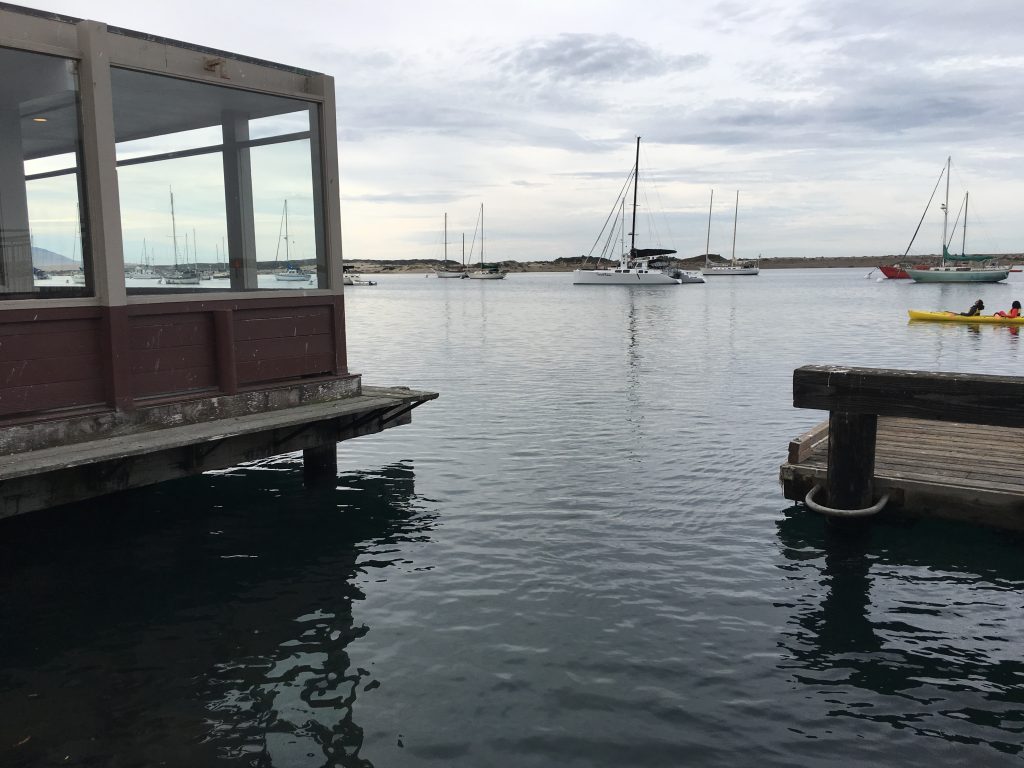
A recent King Tide rose to the top of the pilings beneath Rose’s restaurant (left) and brought floating docks close to their maximum height (right) along Morro Bay’s Embarcadero.
California King Tides Project photos inform scientists and policy makers
The California King Tides Project depends on community members to head out to the coast during King Tide events, take photographs of infrastructure and wild lands when the tides are at their highest, and upload them to the King Tides Project’s database. These photographs are added to the project map for everyone to see, and the data they contain helps researchers and policy makers evaluate potential impacts to California’s coastline as the sea level continues to rise.
Participate in the California King Tides Project
Step 1: take pictures at high tide
It is easy to participate. Just pick one of the days below, find a safe place to view the tides, and snap a picture during the morning high tide. The tide table below is adjusted for Morro Bay from the NOAA Tides and Currents predictions for Port San Luis.
| Date | High Tide | Height | Low Tide | Height |
| December 12, 2020: | 7:42 AM | 6.53 ft | 2:32 PM | -0.94 ft |
| December 13, 2020 | 8:22 AM | 6.8 ft | 3:40 PM | -1.42 ft |
| December 14, 2020 | 9:04 AM | 6.89 ft | 4:27 PM | -1.66 ft |
| December 15, 2020 | 9:47 AM | 6.78 ft | 5:15 PM | -1.65 ft |
| January 11, 2020 | 8:05 AM | 6.68 ft | 3:35 PM | -1.49 ft |
| January 12, 2020 | 8:51 AM | 6.71 ft | 4:19 PM | -1.59 ft |
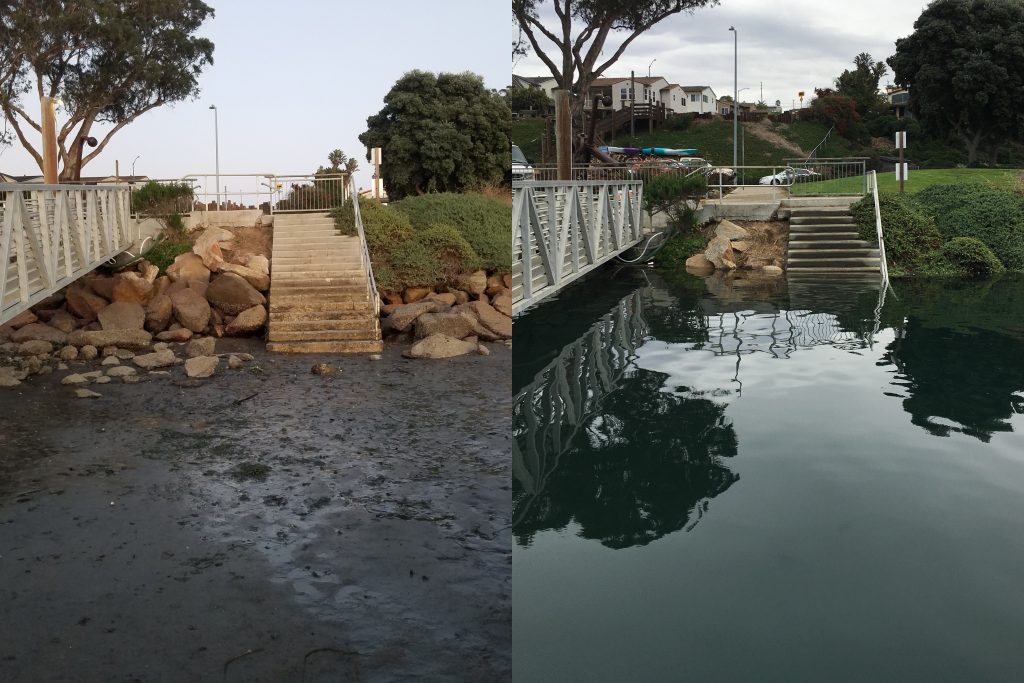
The extreme high tides are mirrored by extreme low tides during these times. If you’d like to see the contrast between the two, try visiting the same spot at high and low tides on the same day. You’ll be amazed at the difference. We’ve listed both the high and low tides in the table, though the King Tides Project collects photographs only of the high tide impacts.
COVID and coastal safety precautions
If you choose to contribute to the California King Tides project this year, please comply with COVID safety precautions when you do so. This means taking photographs while you are already out and about for exercise rather than making a special trip. It is also important to wear a mask over your nose and mouth and to keep at least six feet of distance from others.
There are also typical coastal safety concerns to keep in mind. Please exercise caution near the bay and open ocean. Keep your eye on the waterline, avoid jetties and big waves, and keep your distance from bluff edges and overhangs. Your safety is much more important than any photograph.
Step 2: upload your pictures
This is the most important part! Please take the time to download the free Survey123 app and upload your photographs to the California King Tides Project.
Click here to visit the California King Tides Project’s website for detailed instructions on downloading the app and using it when you have phone service or when you’re out of the service area.
You can also download PDF instructions for using the app, complete with screenshots, here.
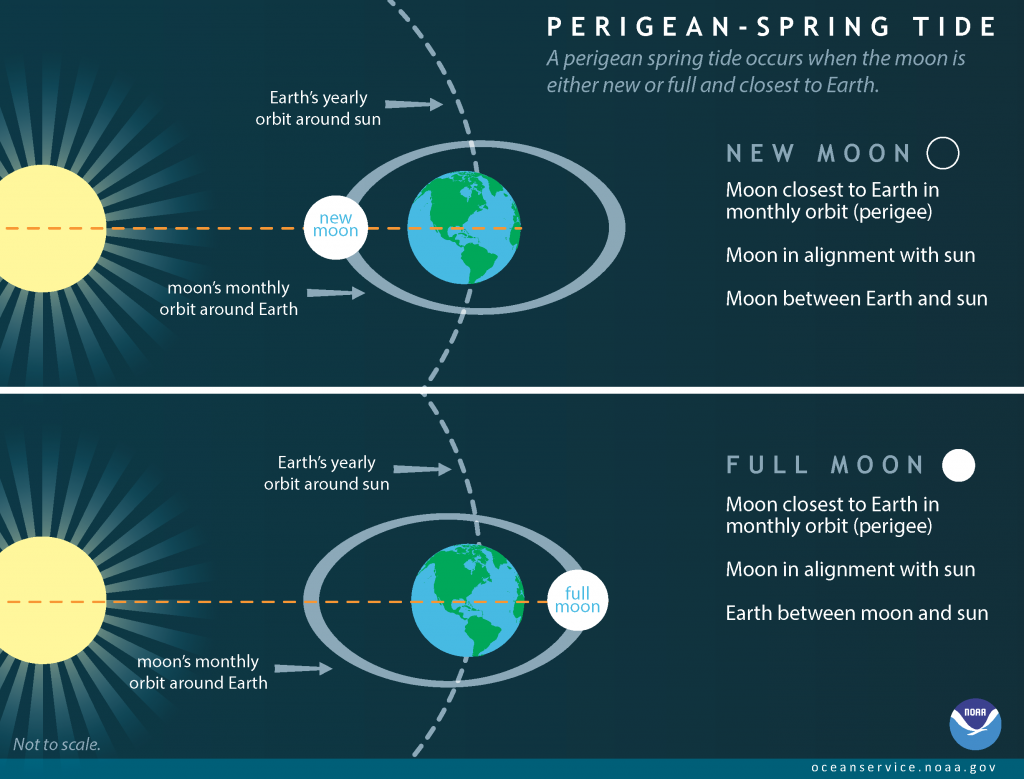
What causes King Tides
These exceptionally high tides occur each winter when:
- Earth is at its closest to the sun (i.e. at perihelion),
- the moon is at its closest to the earth (i.e. at perigee), and
- all three bodies are aligned, producing either a full or new moon.
Because these tides occur when the moon is at perigee, the more technical name for them is perigean-spring tides. The infographic below, from NOAA Ocean Service, illustrates the conditions that combine to create these extra-high tides.
In this position, the sun exerts an extra gravitational pull that causes the ocean bulge to increase further. Watch the video below to see this process in action.
To learn more about tidal cycles and why they exist, visit NOAA.
Help protect and restore the Morro Bay estuary
- Donate to the Estuary Program today and support our work in the field, the lab, and beyond.
The Estuary Program is a 501(c)3 nonprofit. We depend on funding from grants and generous donors to continue our work. - Support us by purchasing estuary-themed gear from ESTERO. This locally owned and operated company donates 20% of proceeds from its Estuary clothing line and 100% of Estuary decal proceeds to the Estuary Program. Thank you, ESTERO!
- Purchase items from the the Estuary Program’s store on Zazzle. Zazzle prints and ships your items, and the Estuary Program receives 10% of the proceeds. Choose from mugs, hats, t-shirts, and even fanny packs (they’re back!) with our fun Estuary Octopus design, our classic Estuary Program logo, or our Mutts for the Bay logo.
Thank you for your support!