First rain!
The Morro Bay watershed received its first rainfall for the new water year on October 24! A local rain gauge at Canet Road off Highway 1 in the Morro Bay watershed recorded 2.32 inches of rainfall over a three-day period.
Local rain gauge network
The Estuary Program has a local rain gauge network that compiles rainfall data and tracks hyper-local trends. This network relies on citizen scientists to gather rainfall data from their yards, schools, businesses, offices, or any outside space where a small rain gauge can sit undisturbed and collect the rain.
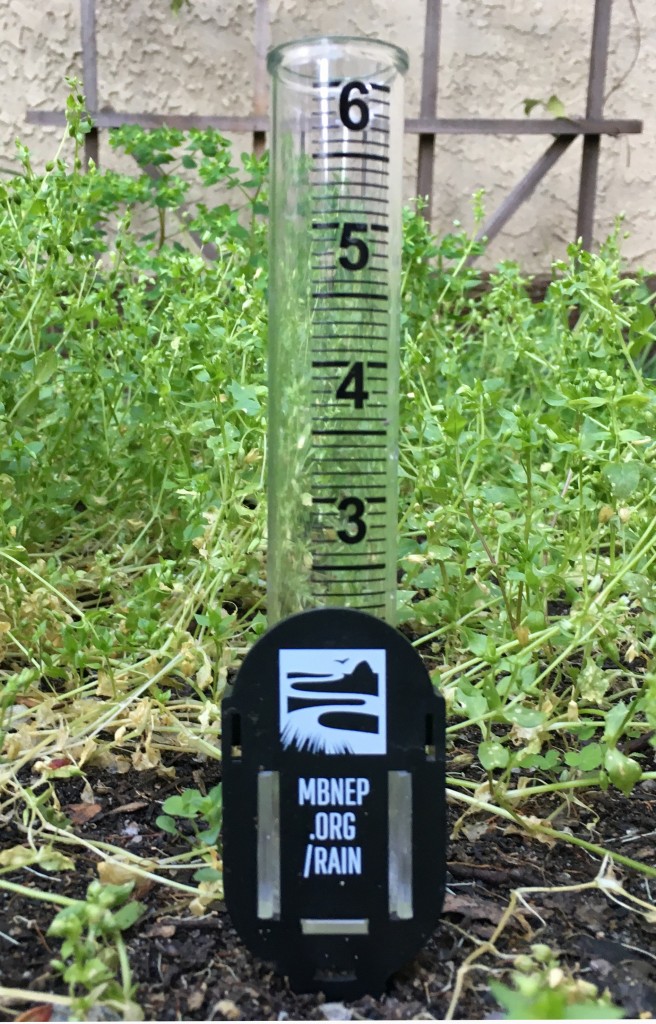
If you’re not already a part of the Morro Bay Rain Gauge Network, now is a great time to join! The Estuary Program provides free rain gauges like the one pictured above. Contact [email protected] to schedule a time to pick up your rain gauge, and start recording the rain at your home, school, or workplace!
Rainfall influences our creeks
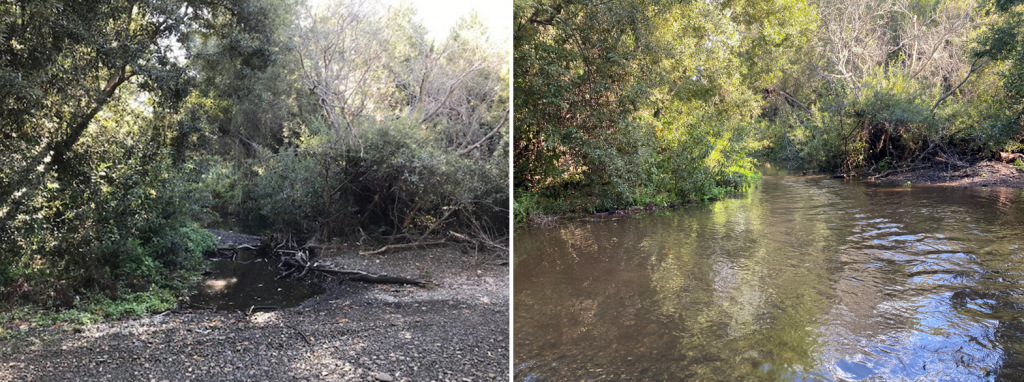
October’s first rainfall generated enough runoff to raise the depth of water, known as stage height, on Chorro Creek by over one foot at peak flow. The stage height prior to the storm was approximately 4.44 feet, and at its highest point, the stage height reached 5.53 feet.
The photos show a section of Chorro Creek that was dry prior to the storm and fully connected and flowing shortly after the storm.
Flow returns to pre-storm levels
Although this rain event brought some much needed water to our creeks, the stage height in the days following the storm doesn’t appear to have changed drastically.
The graph below from SLO County’s monitoring site illustrates the stage height at Canet Road from pre-storm to post-storm. The dark blue line shows the recorded stage height compared to the creek bottom, which is indicated by the orange line.
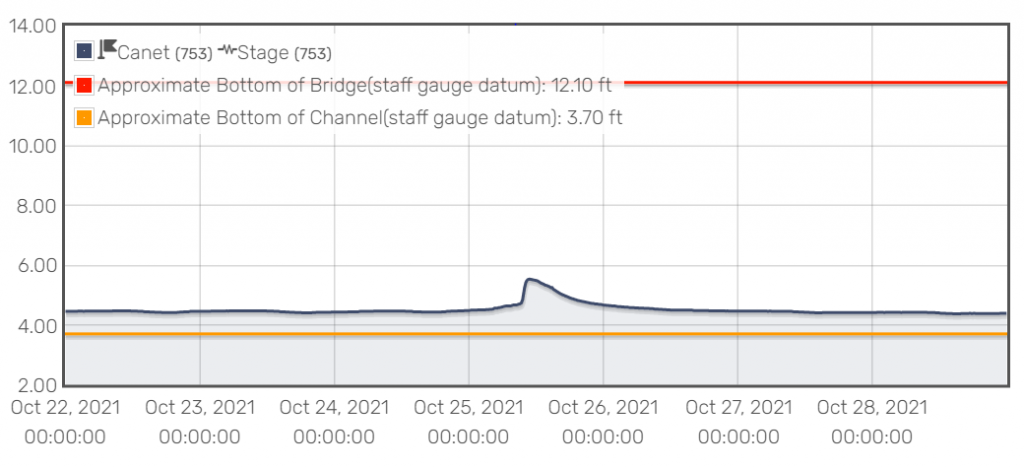
Prior to the storm, the stage height was approximately 4.4 feet. While the stage height increased in response to the storm, the stage height returned to about 4.5 feet after the storm receded. This minimal change is likely a result of the long dry period prior the storm, as the dry ground soaked up much of that rain and less of it ran off into nearby creeks.
Rainfall and stage height data, including graphs like the one here, can be viewed in real-time or downloaded from the County of San Luis Obispo Public Works Department webpage.
Rainfall affects groundwater
Even though the stage height at Canet Road didn’t change considerably in response to the October rainfall event, there are other ways the watershed continues to hold water. As rainfall soaks into the ground, it percolates down to the water table and recharges groundwater.
Recharging groundwater is important for a number of reasons. Humans rely on groundwater for drinking water, irrigation, and industrial purposes. Surface water systems like lakes, rivers and wetlands also rely on groundwater to keep them replenished. Groundwater provides a crucial source of water for these systems, especially during the dry season.
Rainfall increases urban runoff
While we always get excited about the first rainfall of the water year, these flows typically have the highest levels of polluted runoff.
Pollutants build up during dry periods in places like streets and yards. Runoff picks up and carries these pollutants to the nearest storm drain, and then into a nearby creek or the bay. This is especially true in areas with a lot of paved surfaces where water isn’t able to sink into the earth.
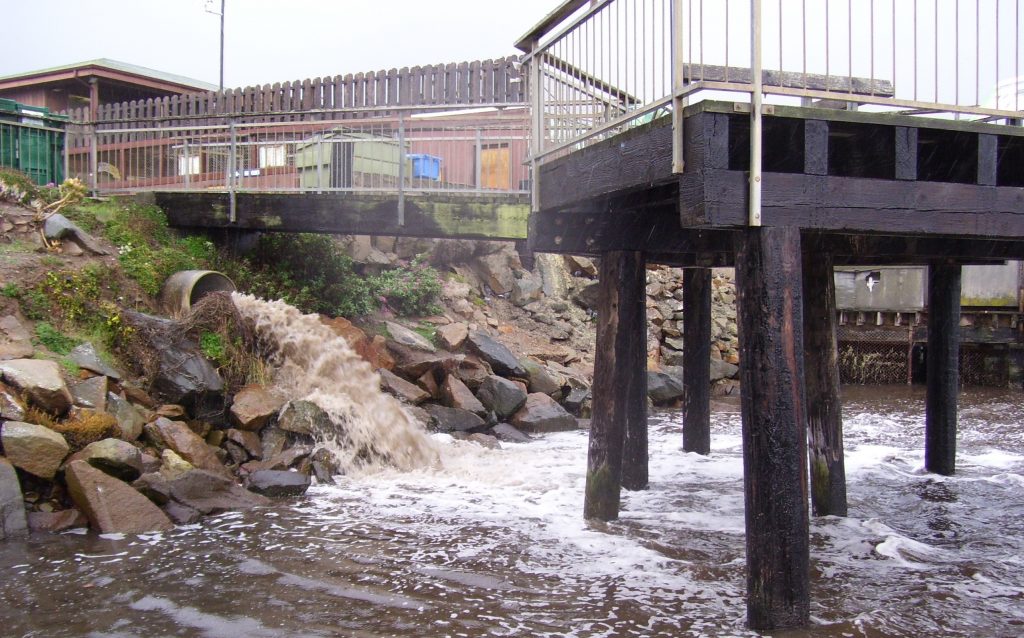
The Estuary Program monitors this runoff at Morro Bay State Park Marina as part of First Flush monitoring. This year’s First Flush monitoring was triggered by the late October storm, and results are anticipated in the coming months.
Help protect and restore the Morro Bay estuary
- Donate to the Estuary Program and support our work in the field, the lab, and beyond.
The Estuary Program is a 501(c)3 nonprofit. We depend on funding from grants and generous donors to continue our work. - Support us by purchasing estuary-themed gear from ESTERO. This locally owned and operated company donates 20% of proceeds from its Estuary clothing line and 100% of Estuary decal proceeds to the Estuary Program. Thank you, ESTERO!
- Purchase items from the the Estuary Program’s store on Zazzle. Zazzle prints and ships your items, and the Estuary Program receives 10% of the proceeds. Choose from mugs, hats, t-shirts, and even fanny packs (they’re back!) with our fun Estuary Octopus design or our Mutts for the Bay logo.
Thank you for your support!