Estuary Program staff got out on the bay between storms this winter for various monitoring efforts. Bay fieldwork in this season allows us to take advantage of some of the lowest tides of the year. The data collected helps track eelgrass health, eelgrass extent, and phytoplankton abundance.
Tracking Eelgrass Health
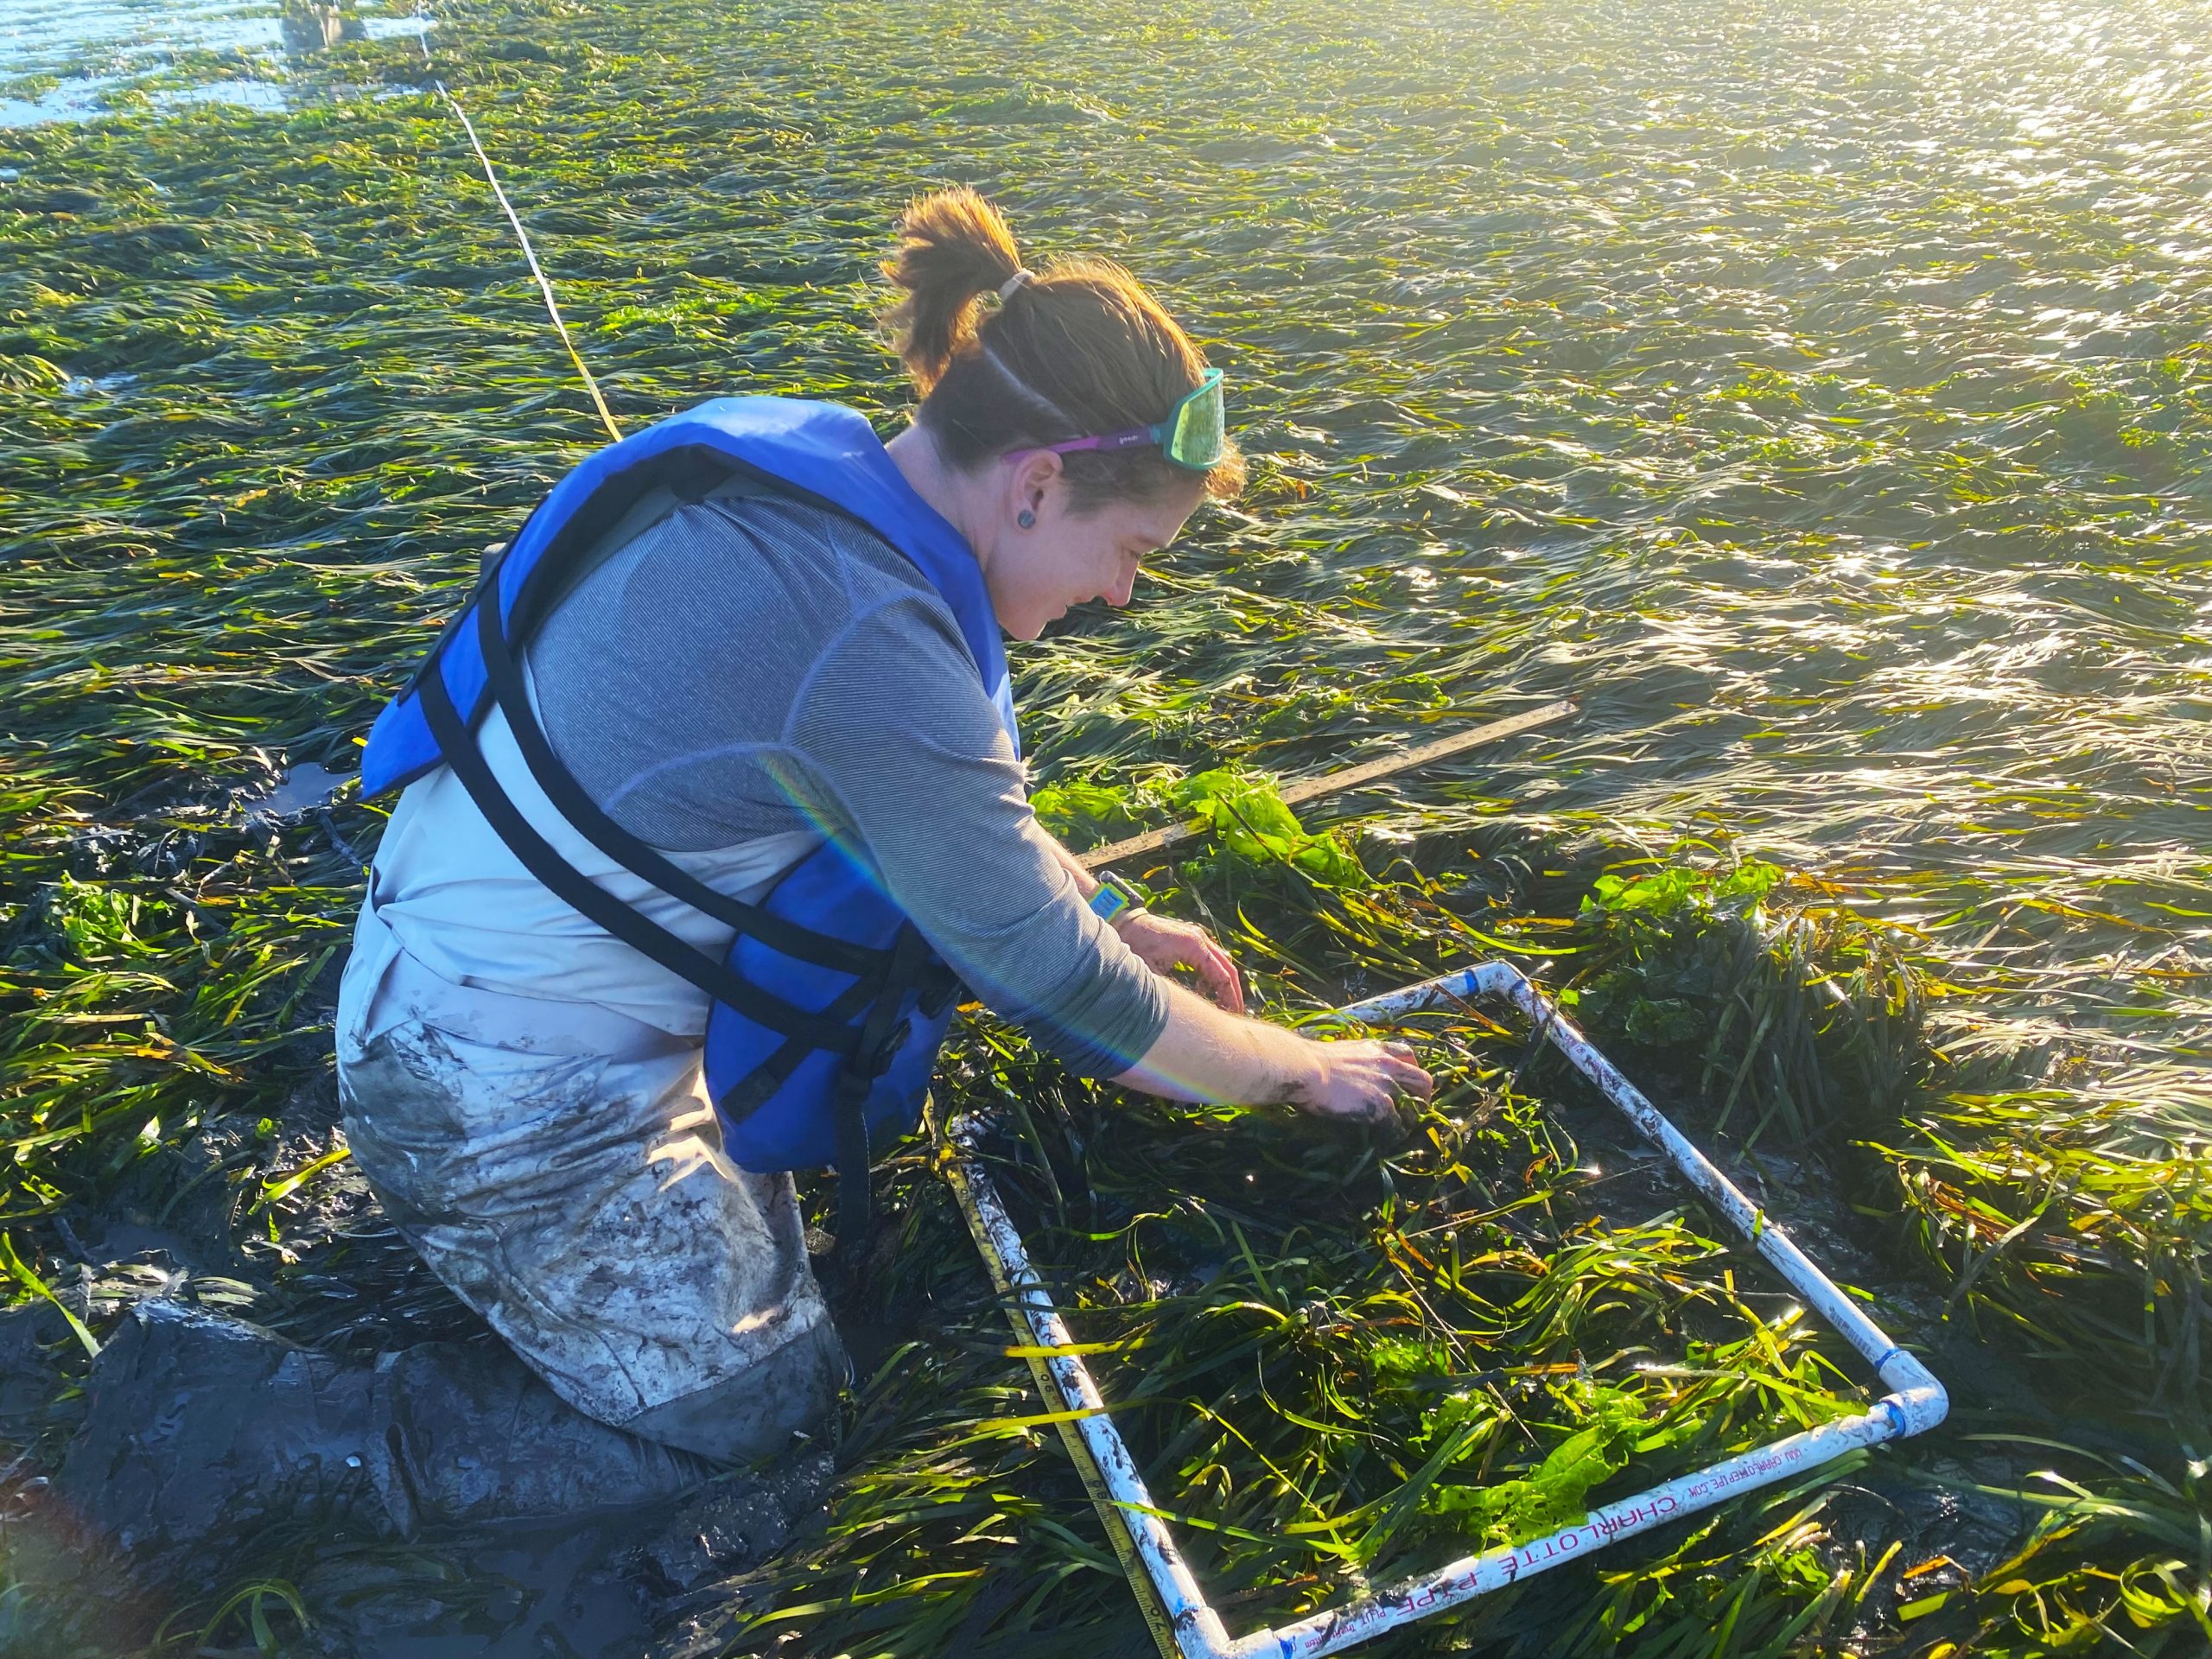
Estuary Program staff donned their waders, hopped aboard paddleboards, and ventured into the estuary for the annual Permanent Transect eelgrass monitoring. This project started in 2005 as a way to monitor changes in eelgrass density. This measure of the number of eelgrass plants present in a certain area is an important metric to track. Typically, more dense eelgrass beds are healthier than those with lower shoot densities.
To monitor density, staff visit six different locations in the estuary. Each site is denoted by precise GPS points so they can be revisited each year. Staff place ½ meter by ½ meter squares made of PVC pipe, known as quadrats, at predetermined intervals along a 50-meter transect. Then, they count eelgrass shoots within each quadrat. By visiting the same sites and using the same sampling methods each year, staff can visualize how eelgrass density has changed over time.
Transect Monitoring
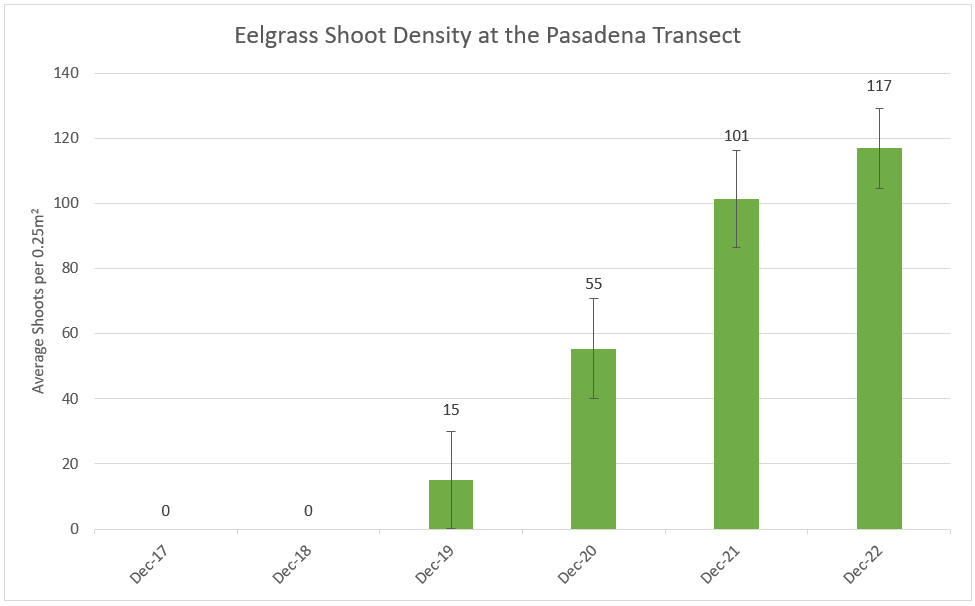
Results from this year’s Permanent Transect monitoring were very encouraging. Four out of the six monitoring sites experienced increases in eelgrass density. Those that did not increase only declined by a small amount. These results indicate that the eelgrass beds surveyed are continuing to grow or have reached a stable shoot density at this point in time.
Eyes in the Sky and Boots on the Ground
Permanent Transect monitoring was not the only eelgrass-related fieldwork taking place this season. Our eelgrass-mapping partners at Cal Poly flew their drone in December and January to collect high-resolution imagery of the exposed intertidal zone. This imagery allows the Estuary Program and our partners to keep an eye on eelgrass conditions around the bay.
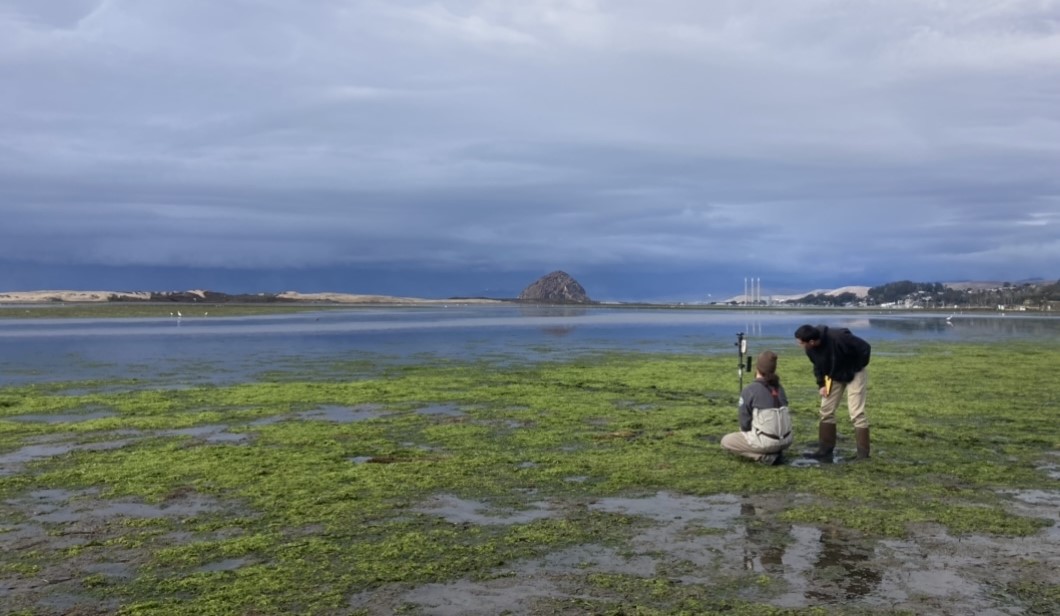
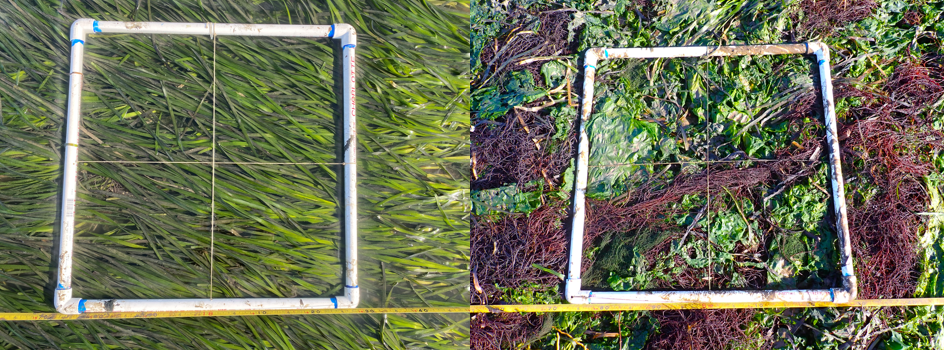
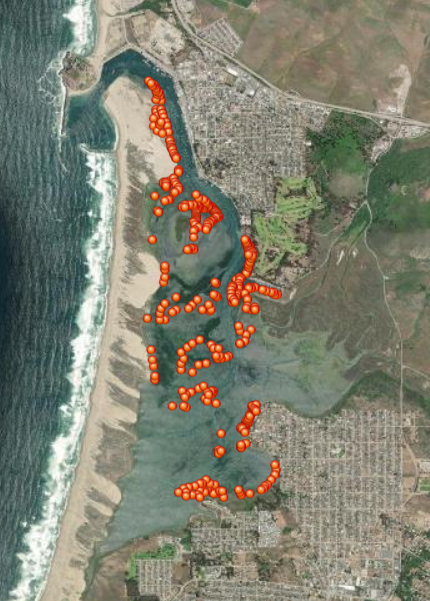
The images obtained from drones are high-resolution and present an incredibly clear picture of the bay’s vegetation. However, it can still be challenging to distinguish between living eelgrass beds, large mats of green algae, and piles of dead eelgrass blades (called “wrack”). To determine the differences in vegetation, Estuary Program staff and volunteers use a technique called ground-truthing. Ground-truthing involves hiking or paddling out into the bay with a highly-accurate GPS unit to record the types of vegetation encountered at specific locations. These points are all added to a map, which the Cal Poly team can use to verify what was seen on the drone imagery. For more information on how we map eelgrass using drones, check out this previous blog post.
Researching Phytoplankton
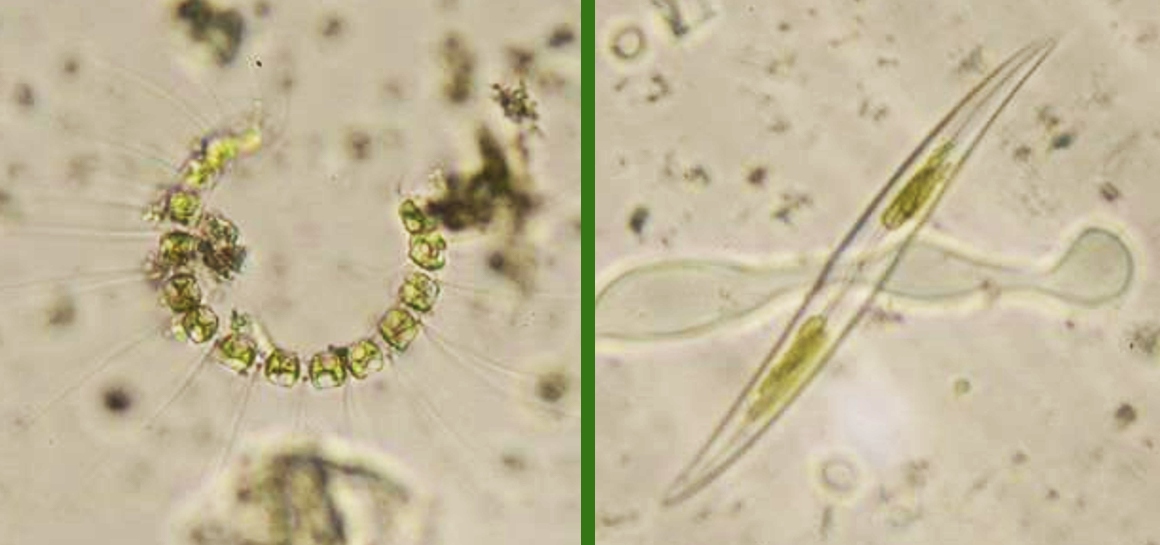
The Estuary Program recently partnered with Dr. Alexis Pasulka of Cal Poly to expand upon an existing phytoplankton monitoring project within the estuary. These microscopic algae form the base of the marine food web and, through photosynthesis, produce at least half of the oxygen we breathe. While phytoplankton are essential components of the ecosystem, some species produce biotoxins. These toxins can accumulate in shellfish tissue and cause illness if consumed by animals or people.
Site Testing
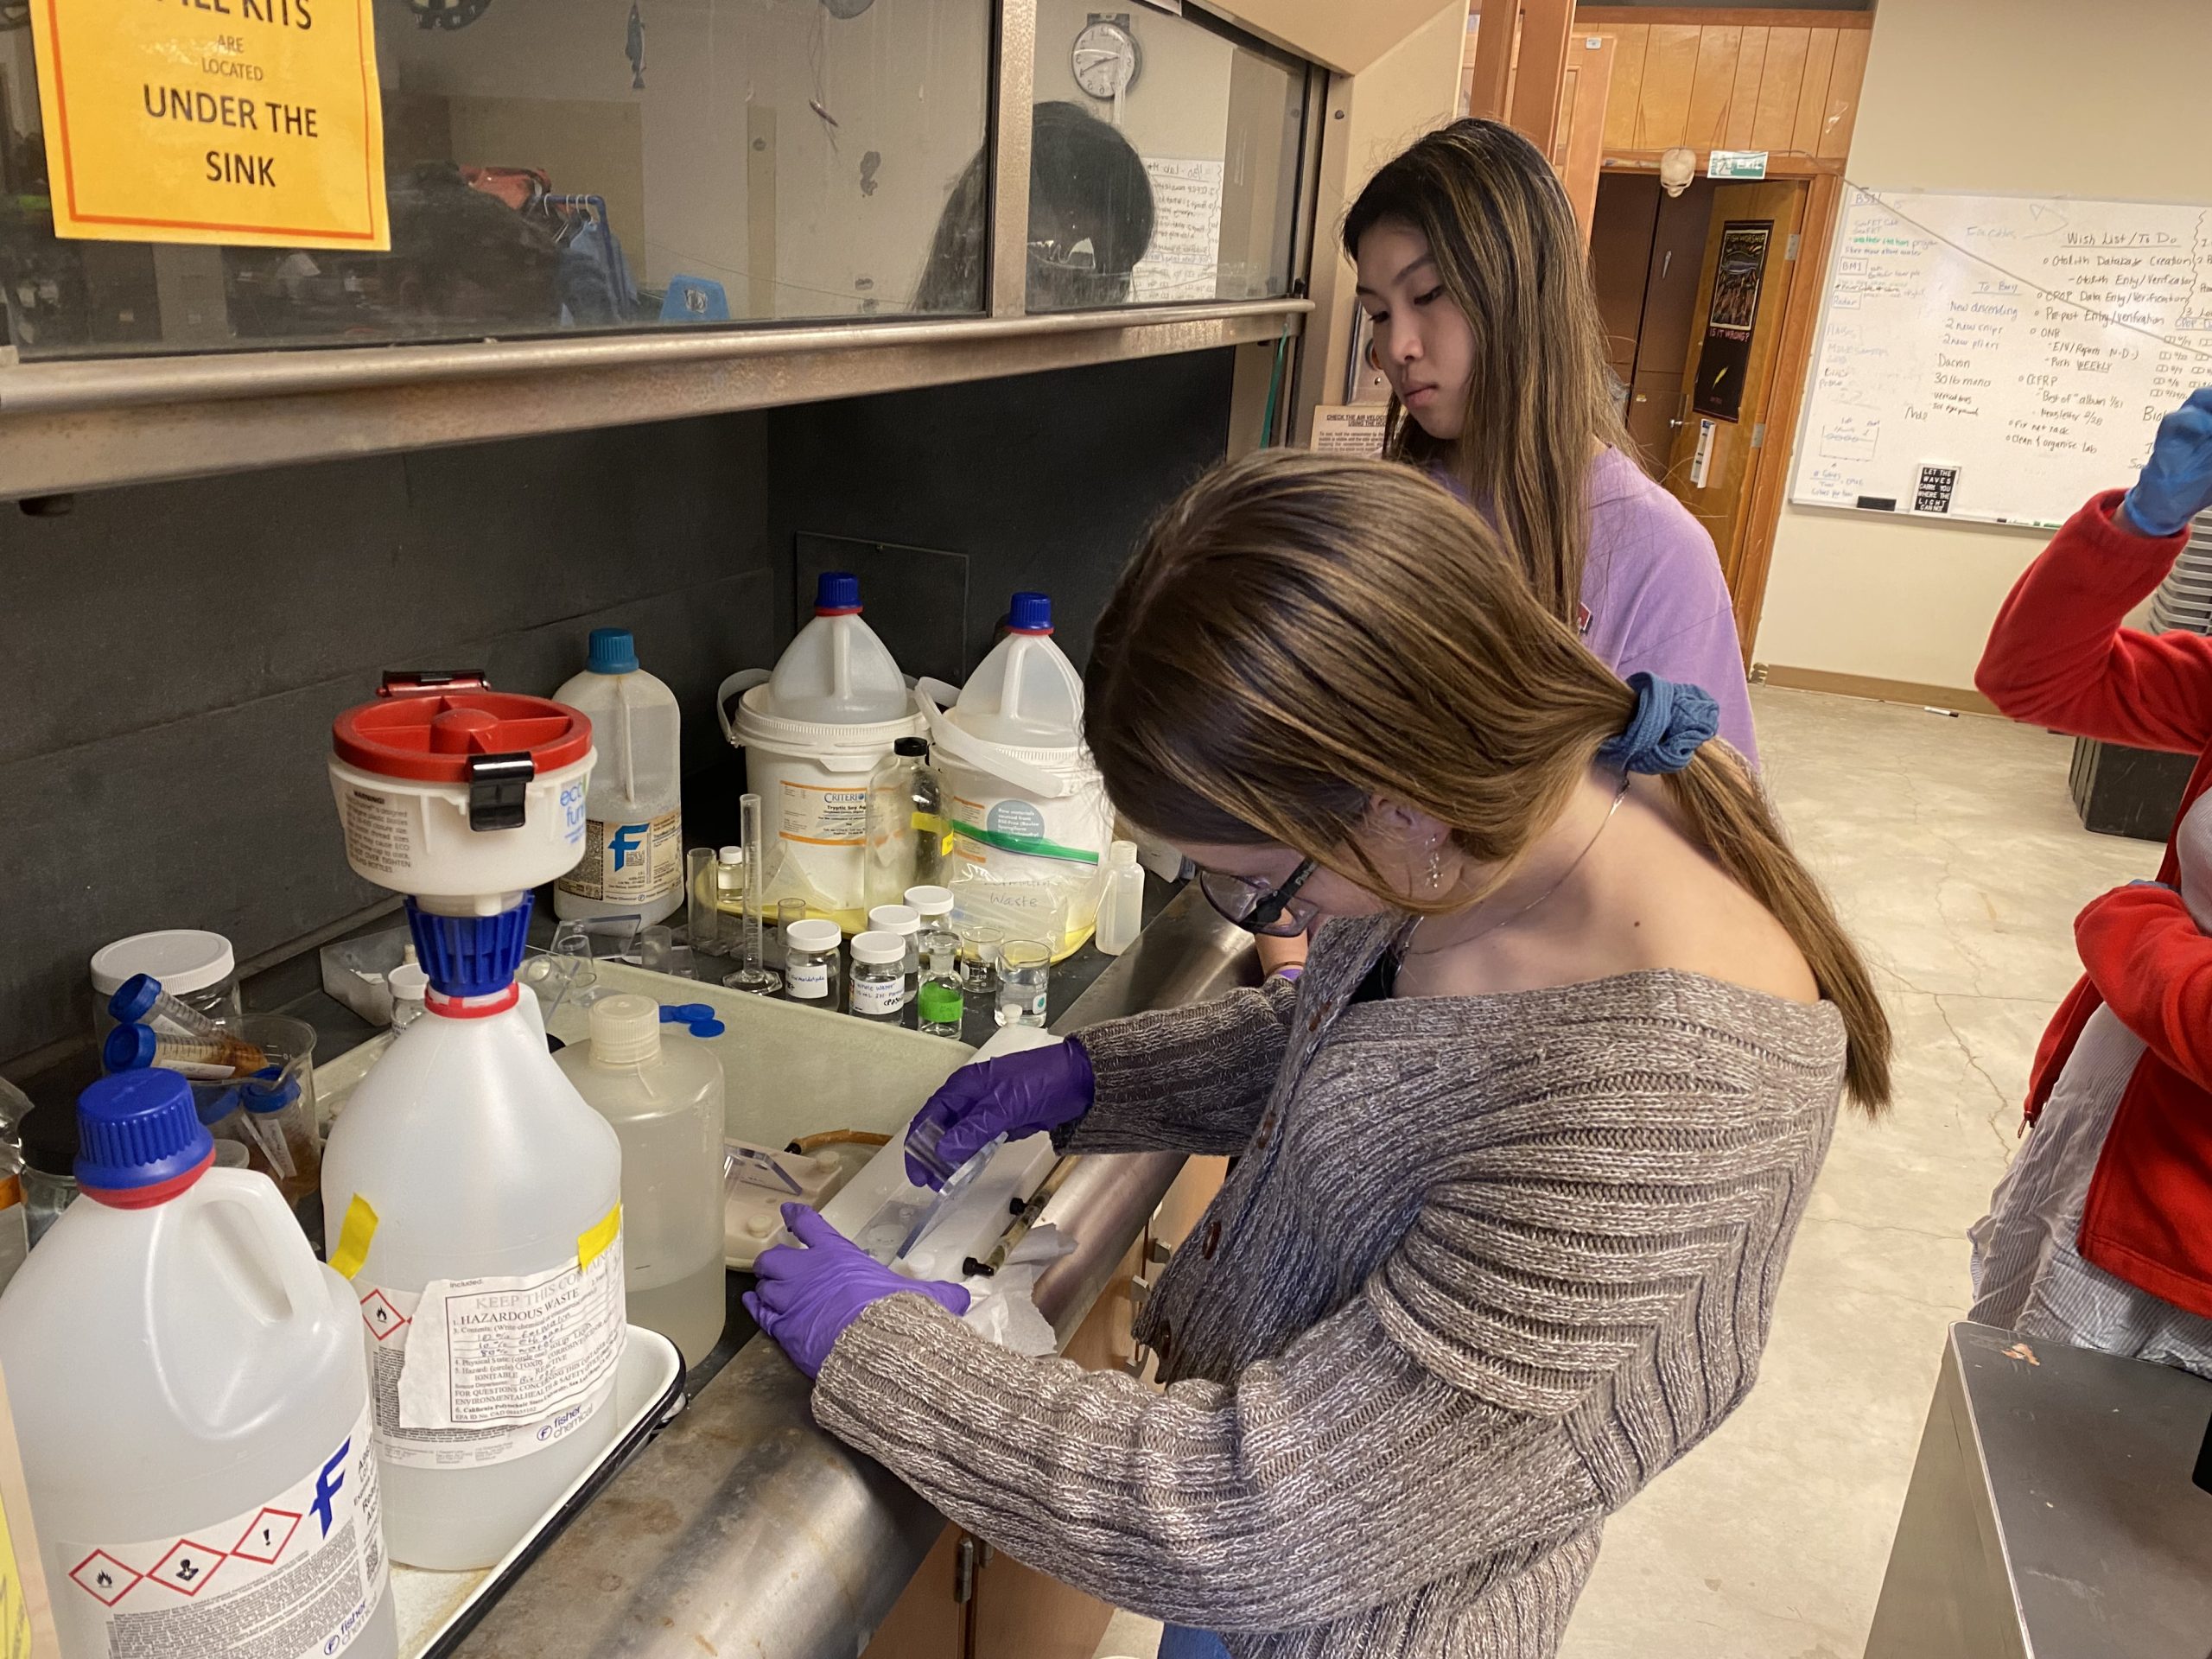
Cal Poly students prepare microscope slides for identification and counting of phytoplankton.
Dr. Pasulka and her students track the abundance of over 200 phytoplankton species from two sites in Morro Bay. One site is located in the Front Bay near the Coast Guard T-Pierne. Another is located in the Back Bay at Pasadena Point. At each location, water samples are collected for phytoplankton identification and molecular samples are collected to detect species that are difficult to identify under a microscope. Measurements such as temperature and salinity are taken in the field to investigate how environmental conditions influence the phytoplankton community. Overall, this project seeks to develop a better understanding of the driving factors behind the presence of toxic phytoplankton and develop ways to predict their occurrence.
Help us protect and restore the Morro Bay estuary!
- Donate to the Estuary Program today and support our work in the field, the lab, and beyond.
The Estuary Program is a 501(c)3 nonprofit. We depend on funding from grants and generous donors to continue our work. - Support us by purchasing estuary-themed gear from ESTERO. This locally owned and operated company donates 20% of proceeds from its Estuary clothing line and 100% of Estuary decal proceeds to the Estuary Program. Thank you, ESTERO!
- Purchase items from the Estuary Program’s store on Zazzle. Zazzle prints and ships your items, and the Estuary Program receives 10% of the proceeds. Choose from mugs, hats, t-shirts, and even fanny packs (they’re back!) with our fun Estuary Octopus design, our classic Estuary Program logo, or our Mutts for the Bay logo.
Thank you for helping our beautiful, bountiful, biodiverse bay!