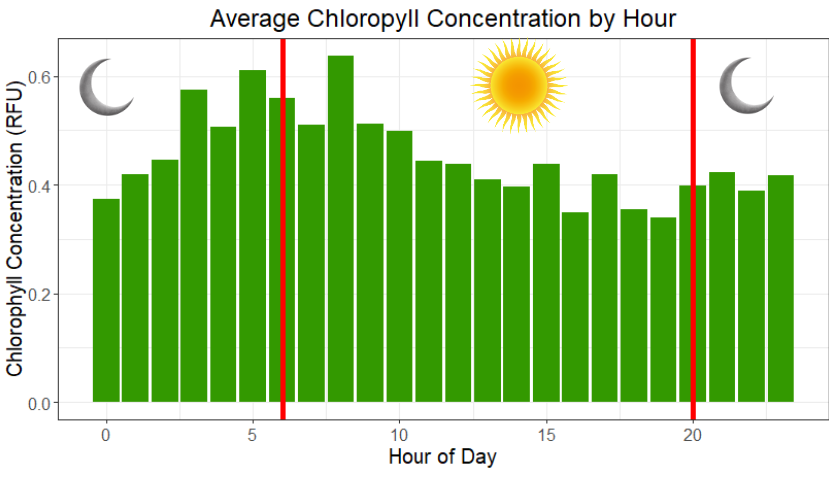
This graph displays average chlorophyll pigment concentrations throughout the day, using data collected during a recent EXO3 deployment. The red lines represent sunrise and sunset.
Enter your email address to subscribe to this blog and receive notifications of new posts by email.
Email Address
Subscribe