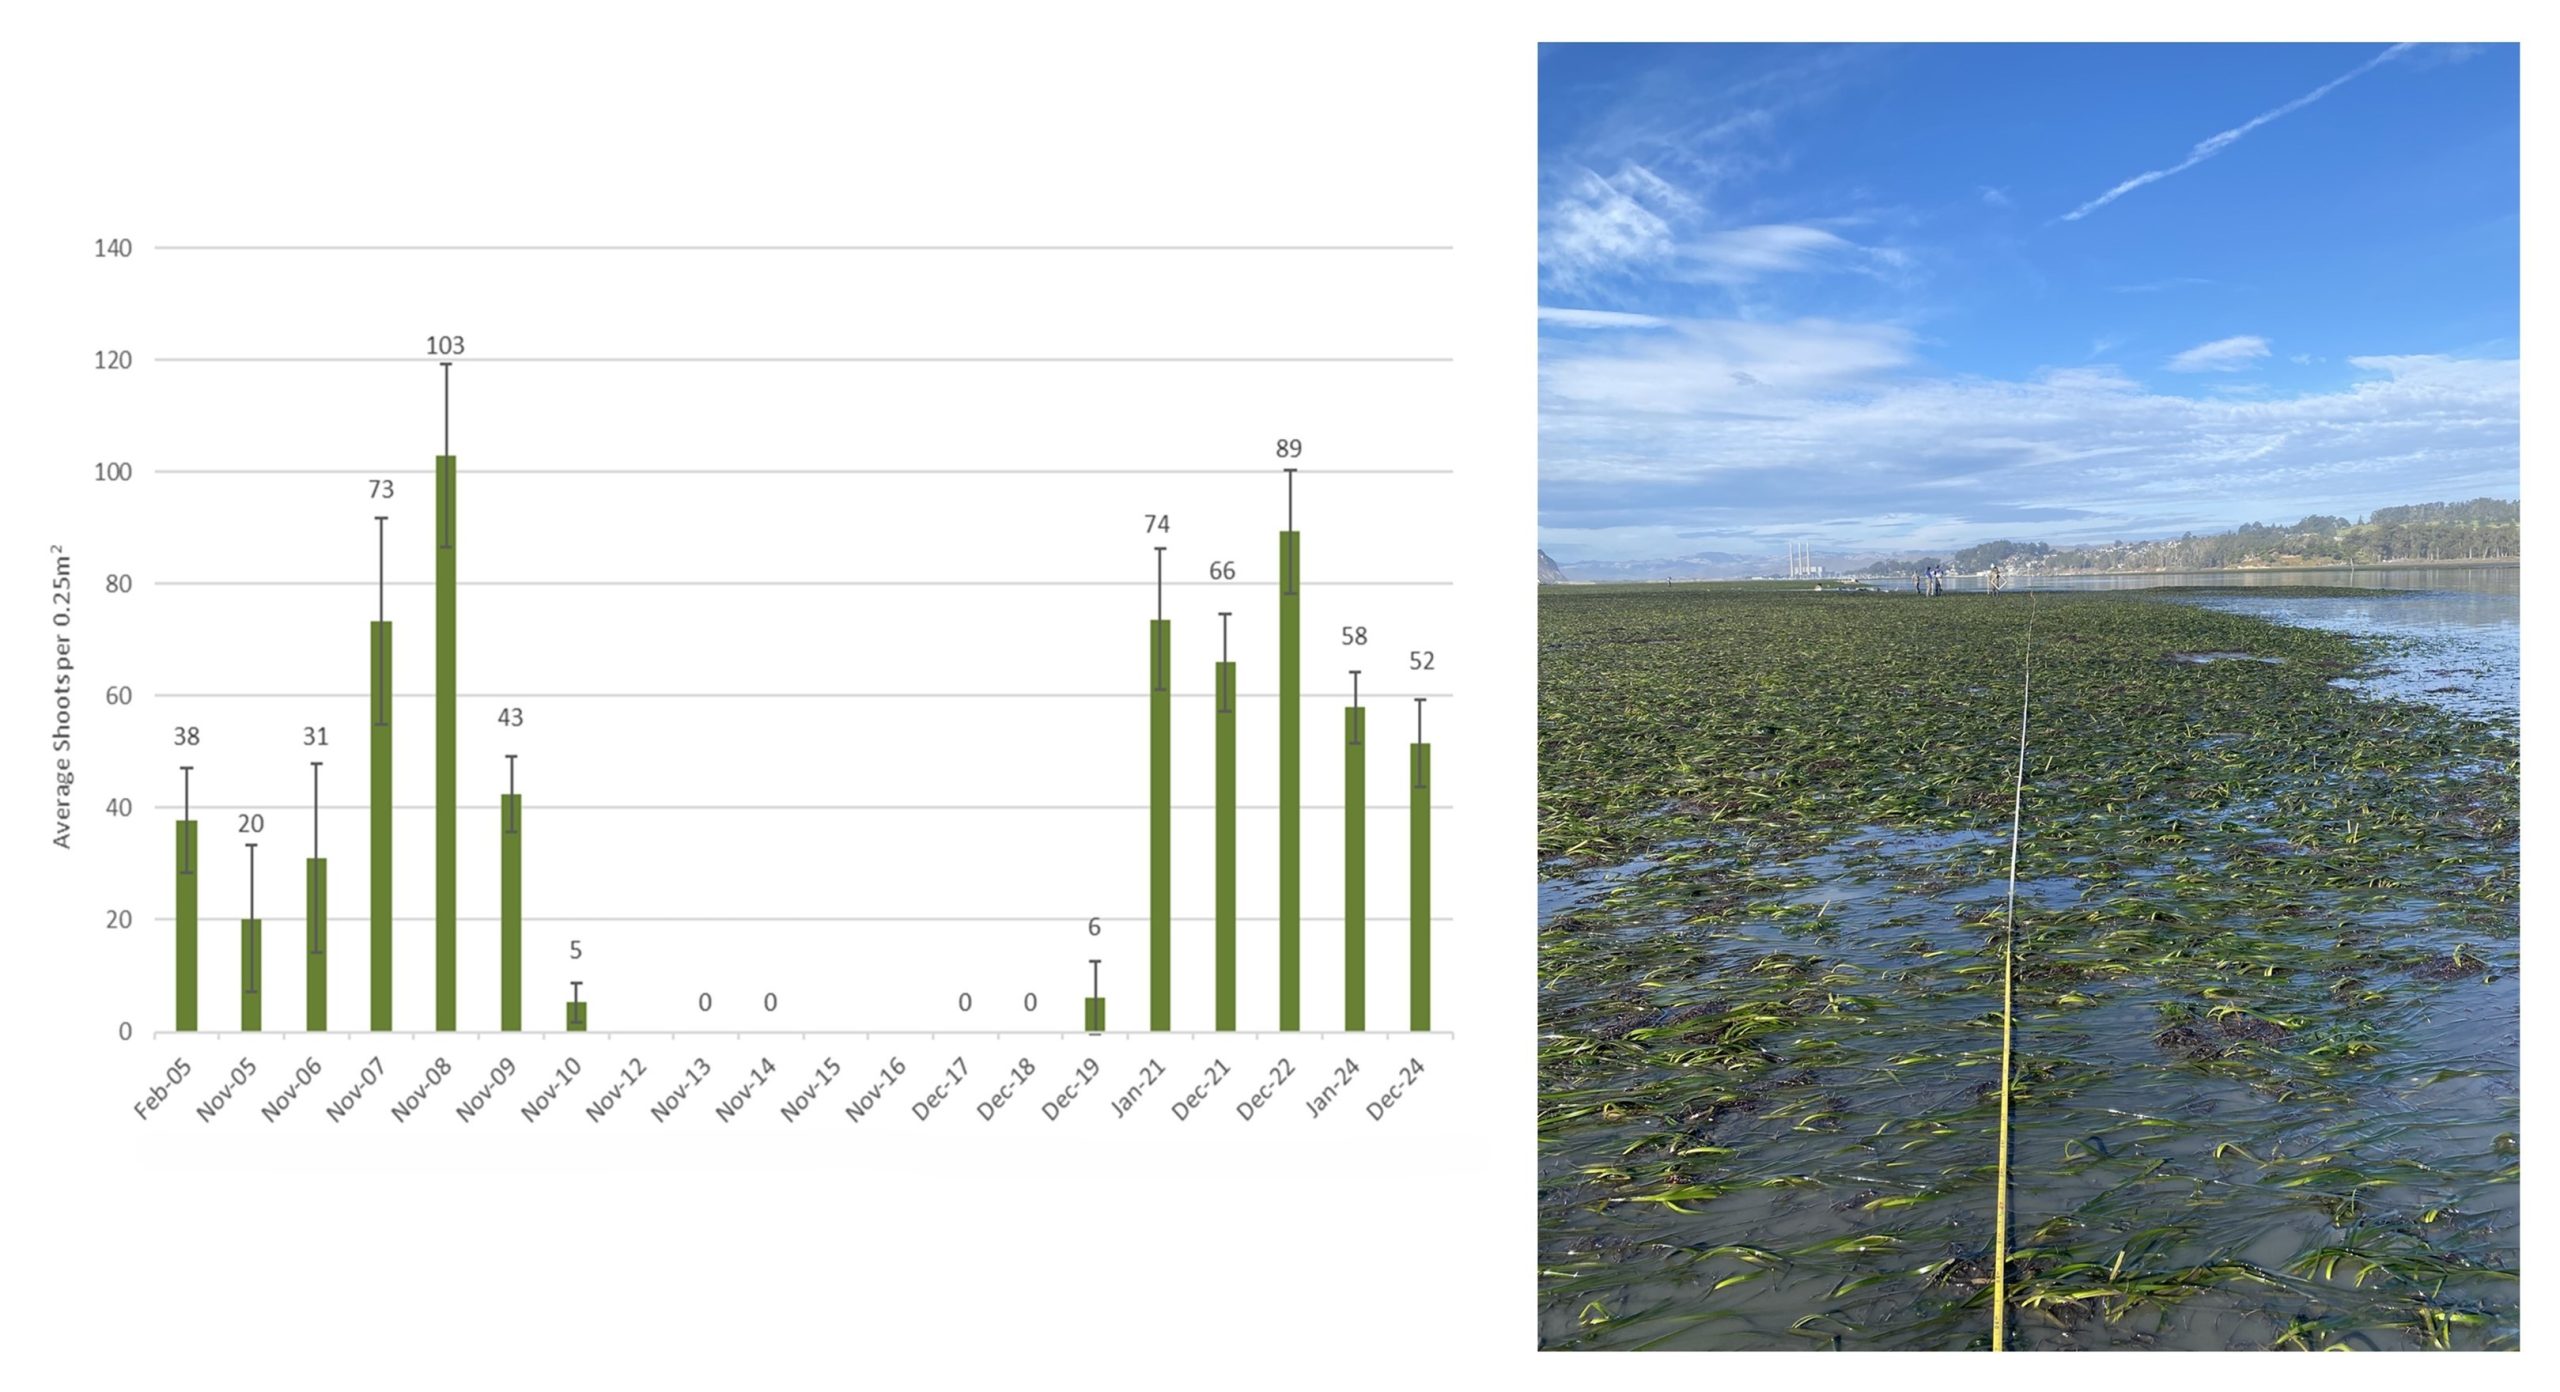
The graph shows the average density of eelgrass shoots along a transect at a monitoring site in the mid-bay. Years with a “0” indicate there was no eelgrass present. The error bars represent a 95% confidence interval. The photo on the right shows the current state of this healthy dense eelgrass bed.