The Morro Bay National Estuary Program (Estuary Program) monitors the water quality of local creeks using a variety of different indicators, including dissolved oxygen, flow, pH and conductivity (which is a measure of the ability of water to pass an electrical current). Staff and volunteers collect this data on a monthly to bimonthly basis.
Continuous data loggers track temperature
For other parameters, such as water temperature, the Estuary Program uses continuous data loggers that record water temperature at thirty-minute intervals. This continuous dataset allows us to see the specific time and day when water temperatures begin to rise or fall.
Water temperature is an important indicator of creek health
But why study water temperature?
Water temperature directly affects which aquatic organisms can thrive in that environment. Sensitive aquatic species like steelhead trout need a temperature range of about 13–18°C, or 56–64°F, in order to spawn¹. If the temperature exceeds this level, especially for a prolonged period of time, steelhead and other species experience a substantial amount of physiological stress. This stress can affect their ability to survive and reproduce.
In addition to its direct effects on biodiversity, water temperature has a substantial influence on a number of other factors, including dissolved oxygen, conductivity, and pH ². The Estuary Program continually monitors these trends and their relationship to water temperature dynamics.
Continuous water temperature loggers in the Morro Bay watershed
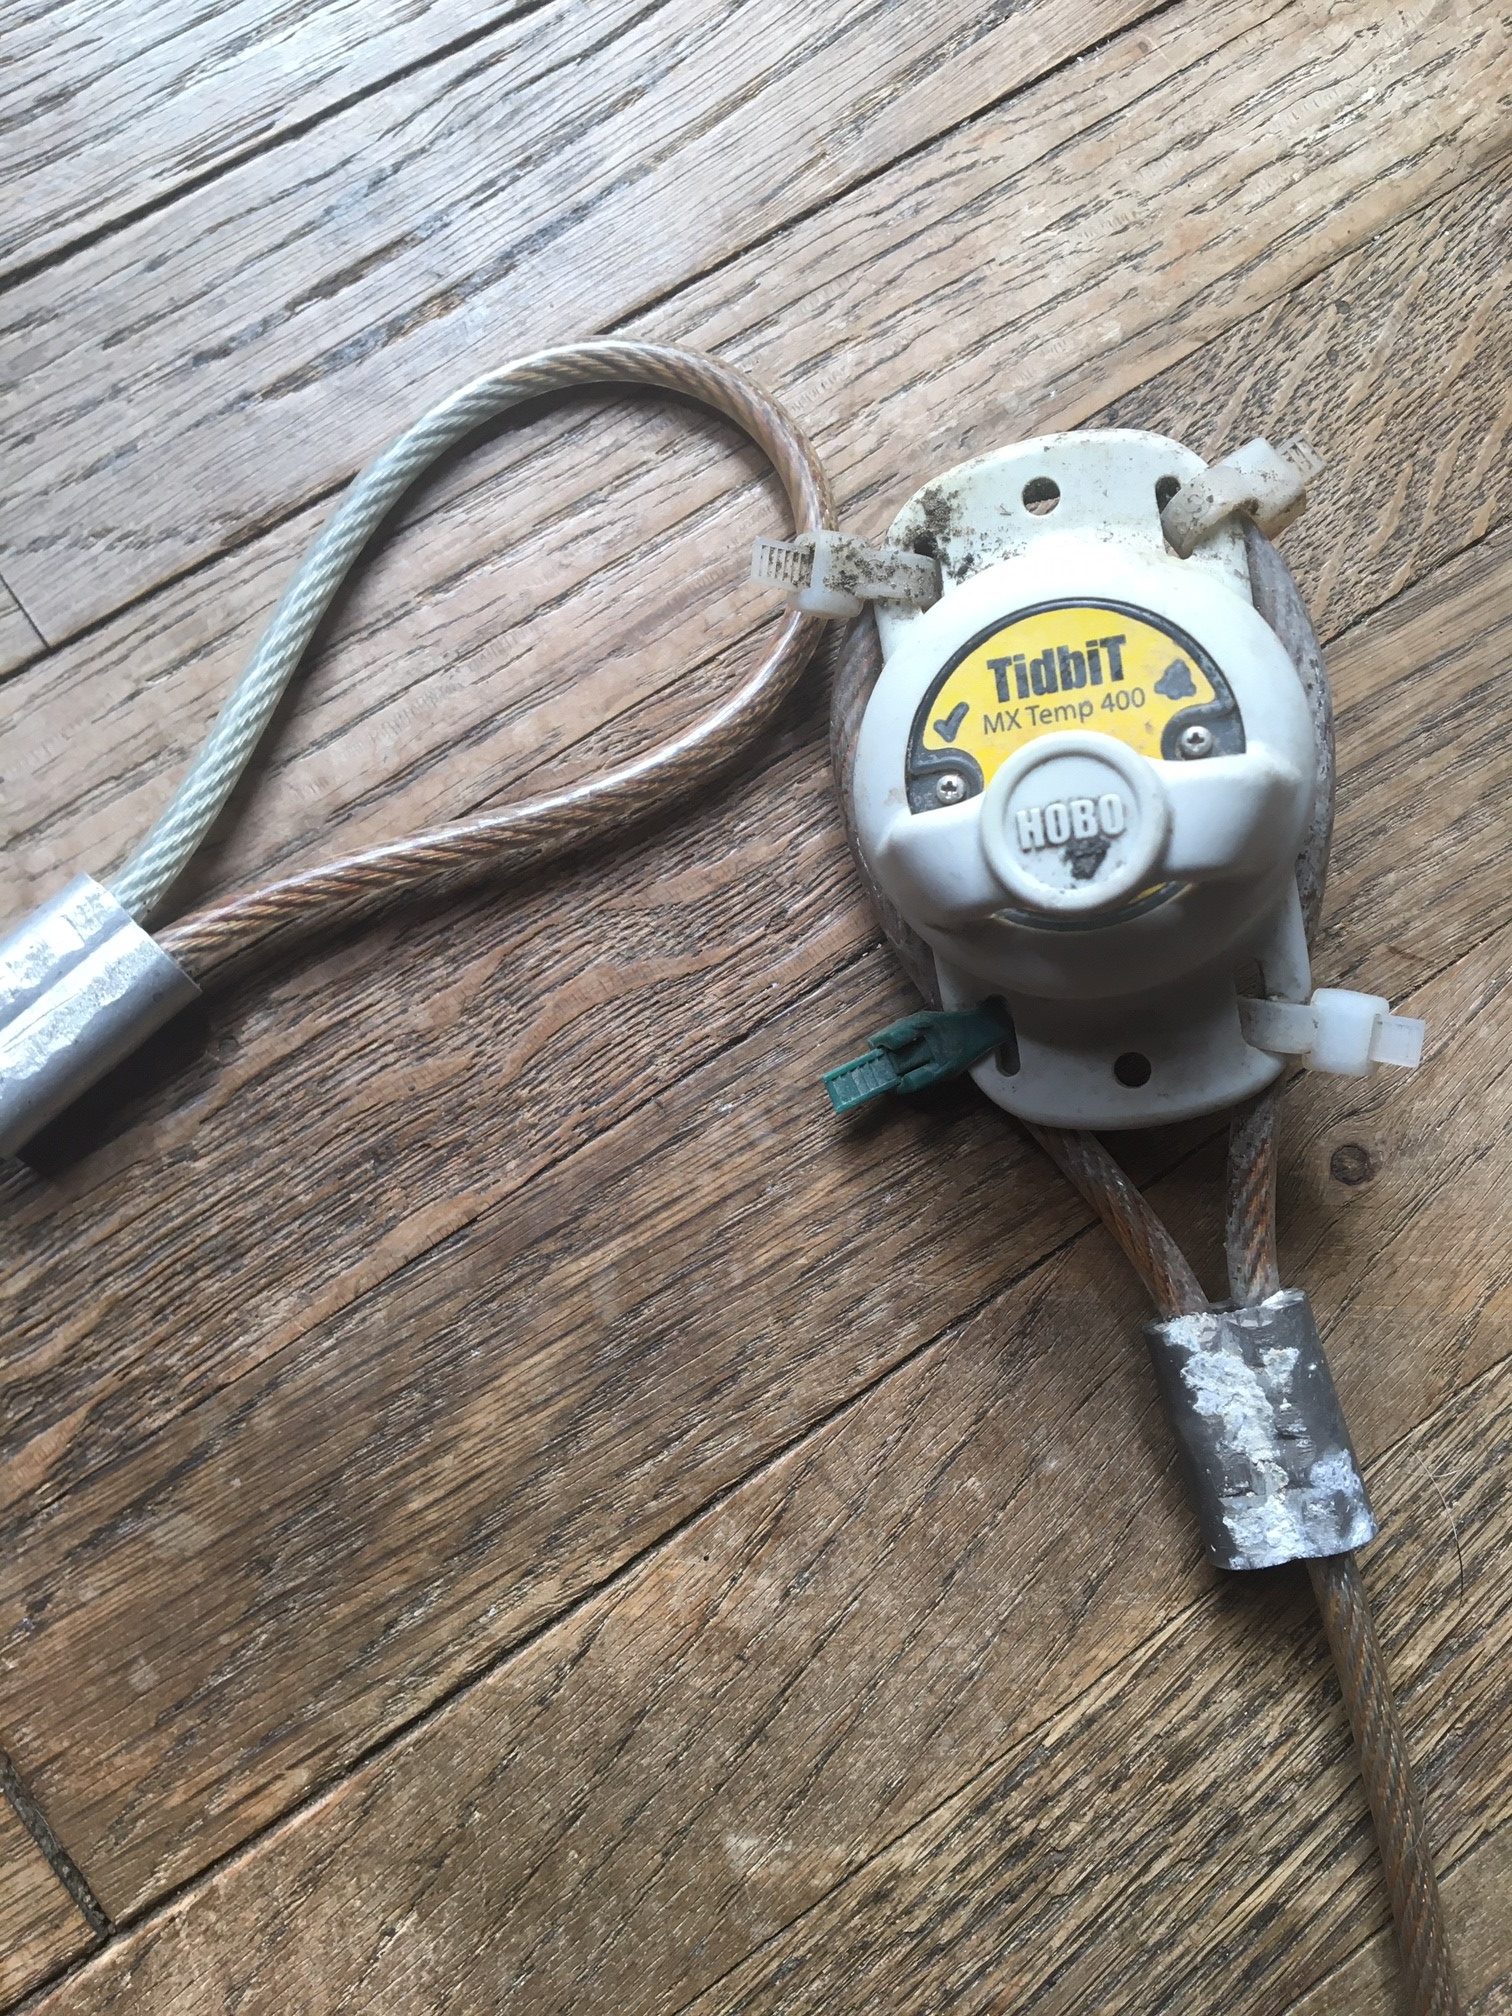
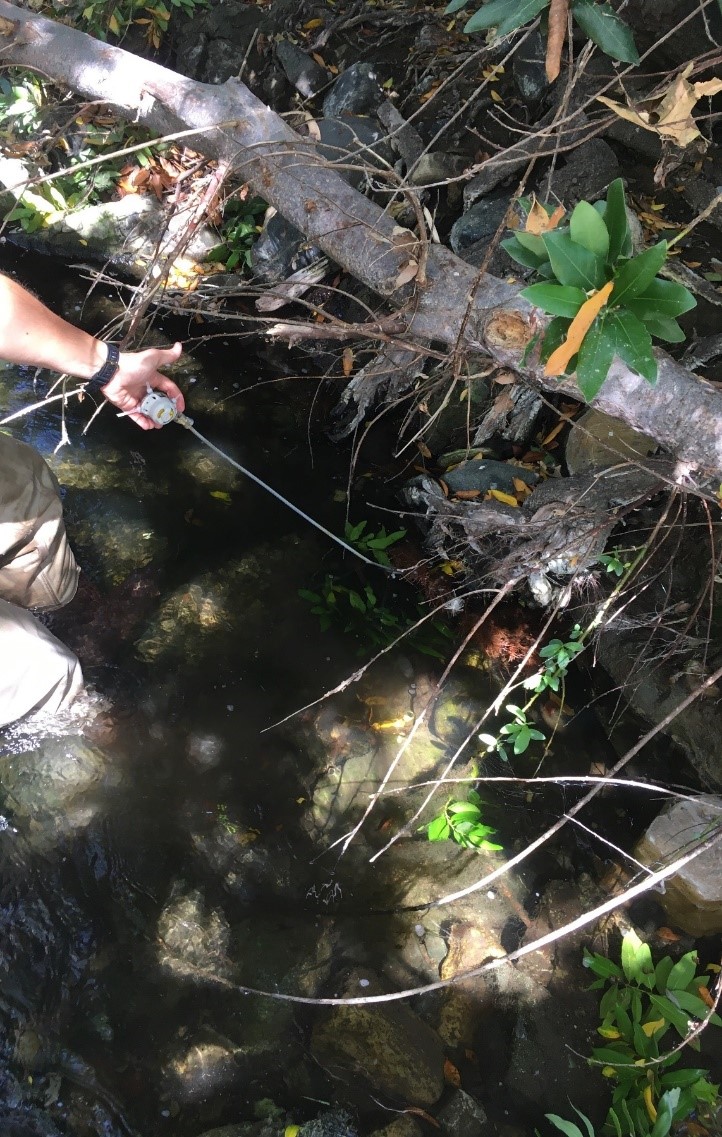
To date, the Estuary Program has eight continuous water temperature loggers deployed throughout the watershed. These small but mighty loggers are typically submerged in deep pools and attached to stable, live anchors that do not move, such as thick rootwads or the bases of hearty creekside shrubs. We can download data from these loggers in the field using a simple Bluetooth connection and a secure password.
The Estuary Program uses HOBO TidbiT MX 2203 temperature loggers, which are accurate to plus or minus 0.2°C in waters that are between freezing and 70°C, or plus or minus 0.36°F between freezing and 158°F. These temperature loggers are relatively simple to use and do not need to be calibrated to continue collecting accurate data. This saves us time and ensures a continuous data feed. The battery life on these loggers is so good that they could be left out in the stream for up to five years, taking a measurement every minute.
The Estuary Program typically deploys these temperature loggers in March and retrieves them in December, before any large winter storms might dislodge them and wash them downstream. For comparison and quality assurance purposes, we manually check the water temperature at each site two or three times throughout the deployment period of each logger.
A look at temperature logger data
Chorro Creek data
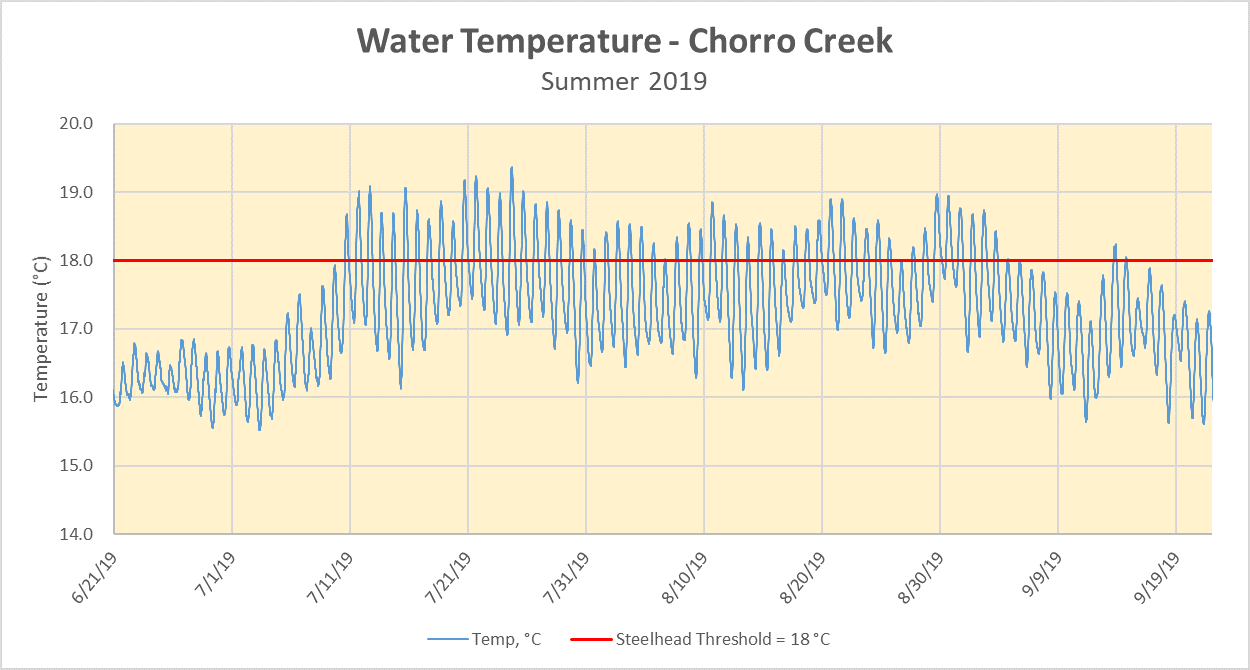
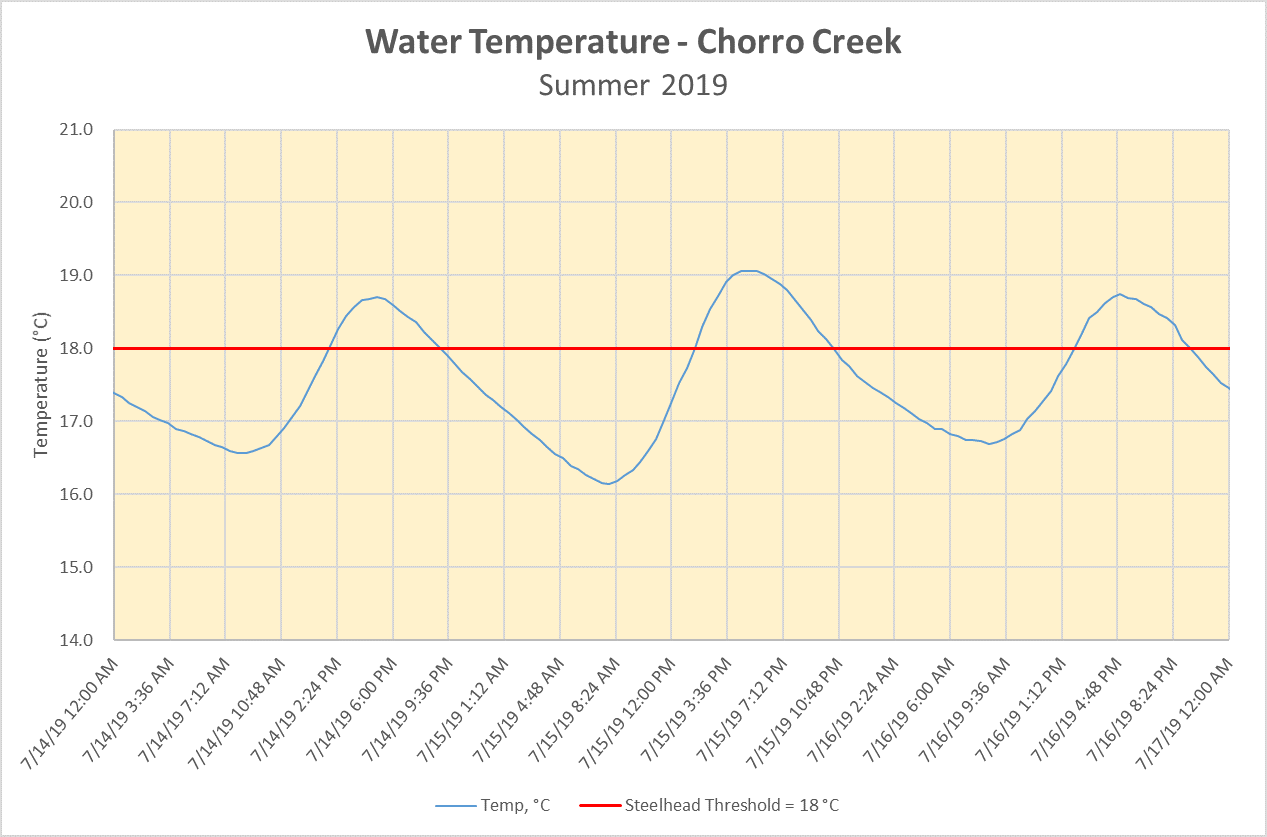
Below is an example of water temperature results from a monitoring site on Chorro Creek during the summer of 2019. The blue line indicates the water temperature reading in degrees Celsius (°C) taken at 30-minute intervals. The red line is a reference line, showing the water temperature threshold for South-Central Coast Steelhead, which is 18°C, or 64.4°F.
Temperatures above the 18°C threshold do not necessarily indicate sensitive species mortality, but they do place these species under physiological stress that can lead to the lack of reproduction. In the graph below, you’ll notice that in the height of the summer, water temperatures in Chorro Creek regularly exceed this 18°C threshold.
If you look closer at the graph, you’ll notice that the blue line has a consistent variation pattern on a daily basis. To show this pattern in greater detail, the graph below enlarges three days in mid-summer, July 14 through 18. The consistent pattern here shows the diurnal fluctuation of the water temperature, where the water temperature begins to rise mid-morning, at approximately 10:00 a.m., and begins to fall around 5:30 p.m.
In the graph below, water temperatures exceed the 18°C sensitive species threshold from about 2:00 p.m. until about 9:30 p.m. each day, with some days, like July 15, exceeding that level for even longer, from 1:30 p.m. until 11p.m. Warmer water temperature typically leads to lower levels of dissolved oxygen. These elevated temperatures mean that for sensitive aquatic species such as steelhead trout, Chorro Creek might not have adequate oxygen levels for seven to eight hours on an average summer day, and potentially even longer in the height of summer. The Estuary Program is currently researching continuous dissolved oxygen loggers and hopes to have continuous dissolved oxygen data soon.
Pennington Creek data
The following graph is from a monitoring site on Pennington Creek during the same time summer timeframe.
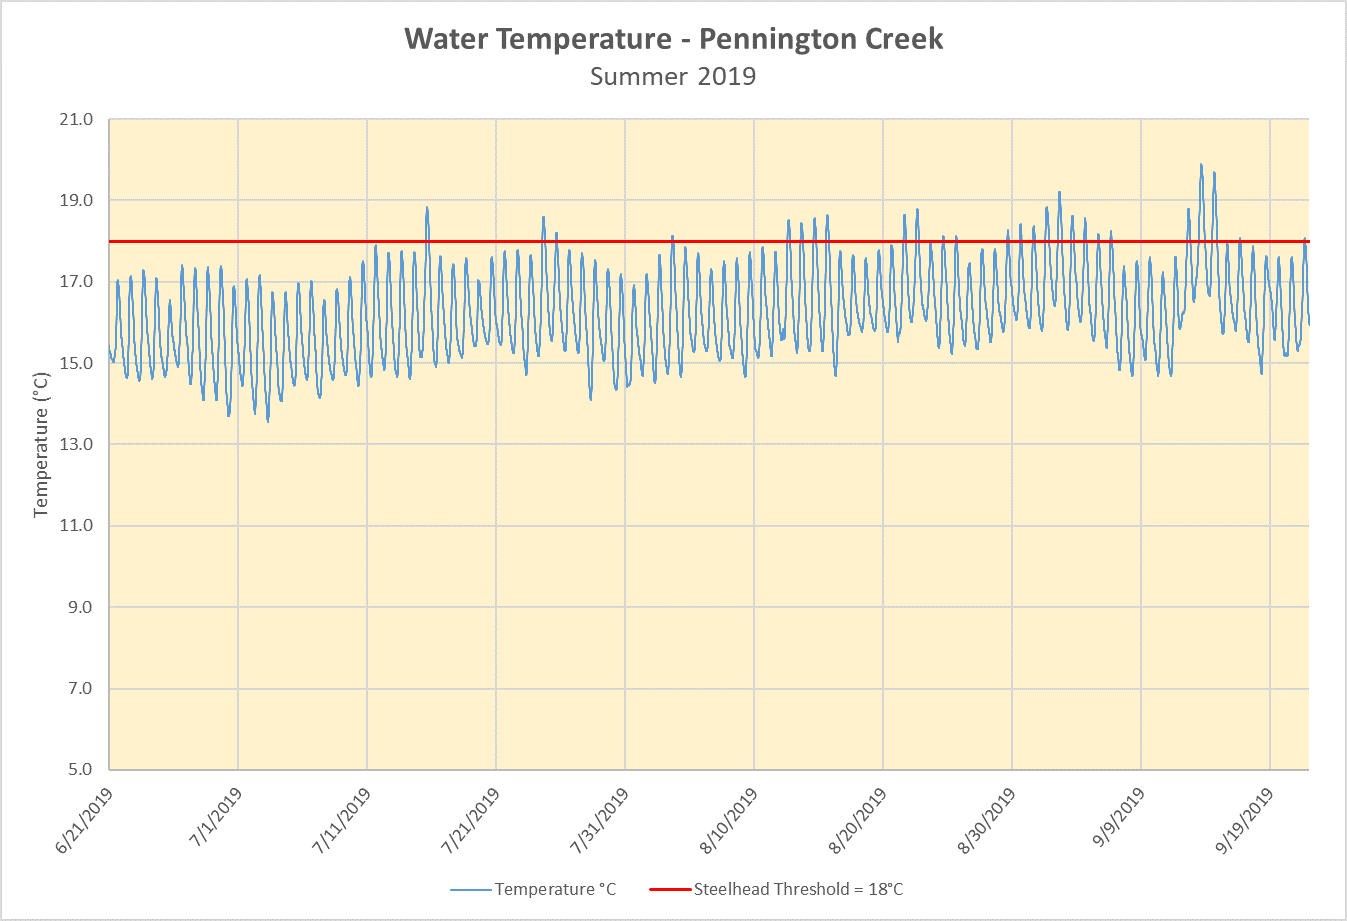
Though Pennington Creek does still experience increased temperatures, it is for a shorter duration than Chorro Creek. The water temperature at Pennington Creek exceeded the 18°C threshold for 5.9% of the summer deployment, while Chorro Creek exceeded the threshold for 66.7% of the summer.
The difference in temperature between the two creeks highlight the importance of connectivity between mainstem Chorro Creek and the tributaries such as Pennington Creek. Restoration projects such as the removal of the Pennington Creek Fish Ladder improved fish passage to Pennington Creek, opening up miles of high quality habitat while increasing the amount of water in the creek.
Additional results and analysis from on-going temperature monitoring can be found in our 2020 State of the Bay Report, as well as in our annual Creek Health Memo. You can find printable versions of both reports and other information about the Morro Bay estuary in our online library. We’ll be back with an update on the water temperatures for the 2019 water year soon!
For more questions about water temperature monitoring or water quality, please contact the Estuary Program.
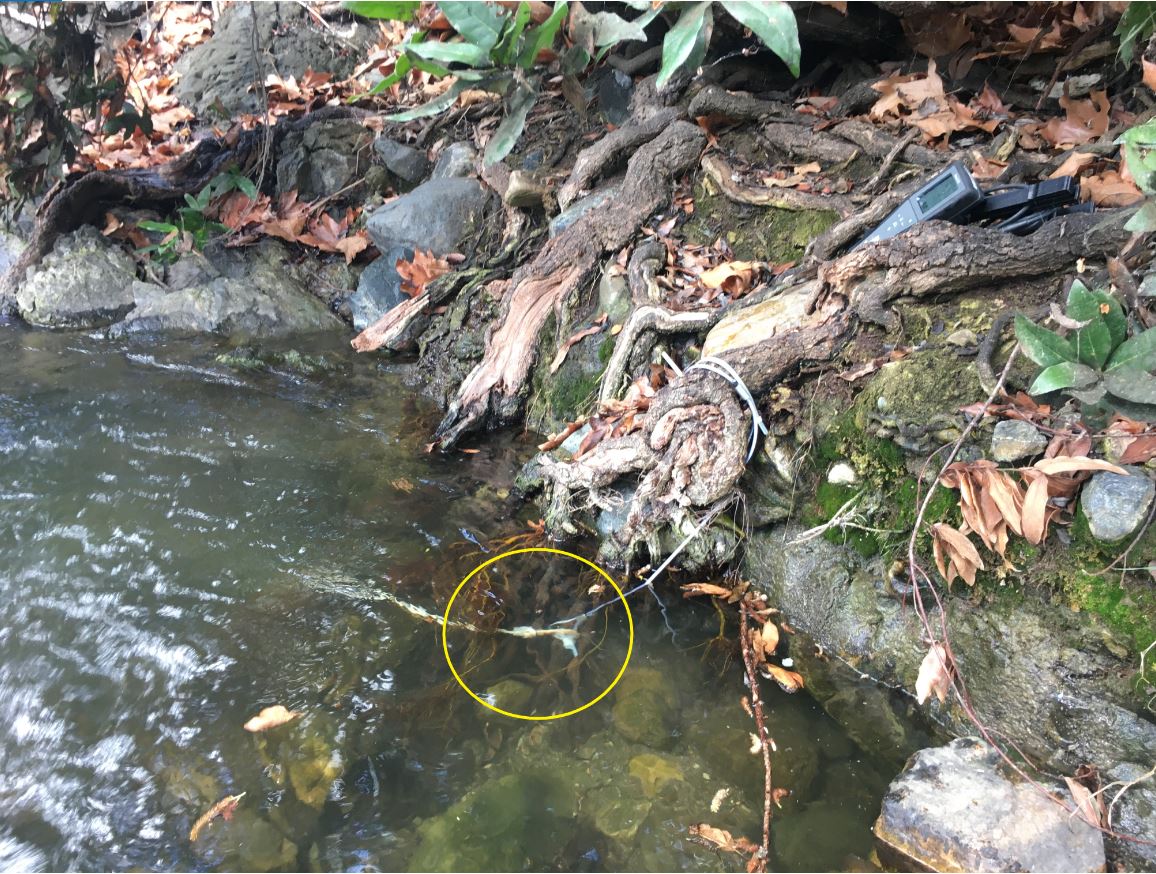
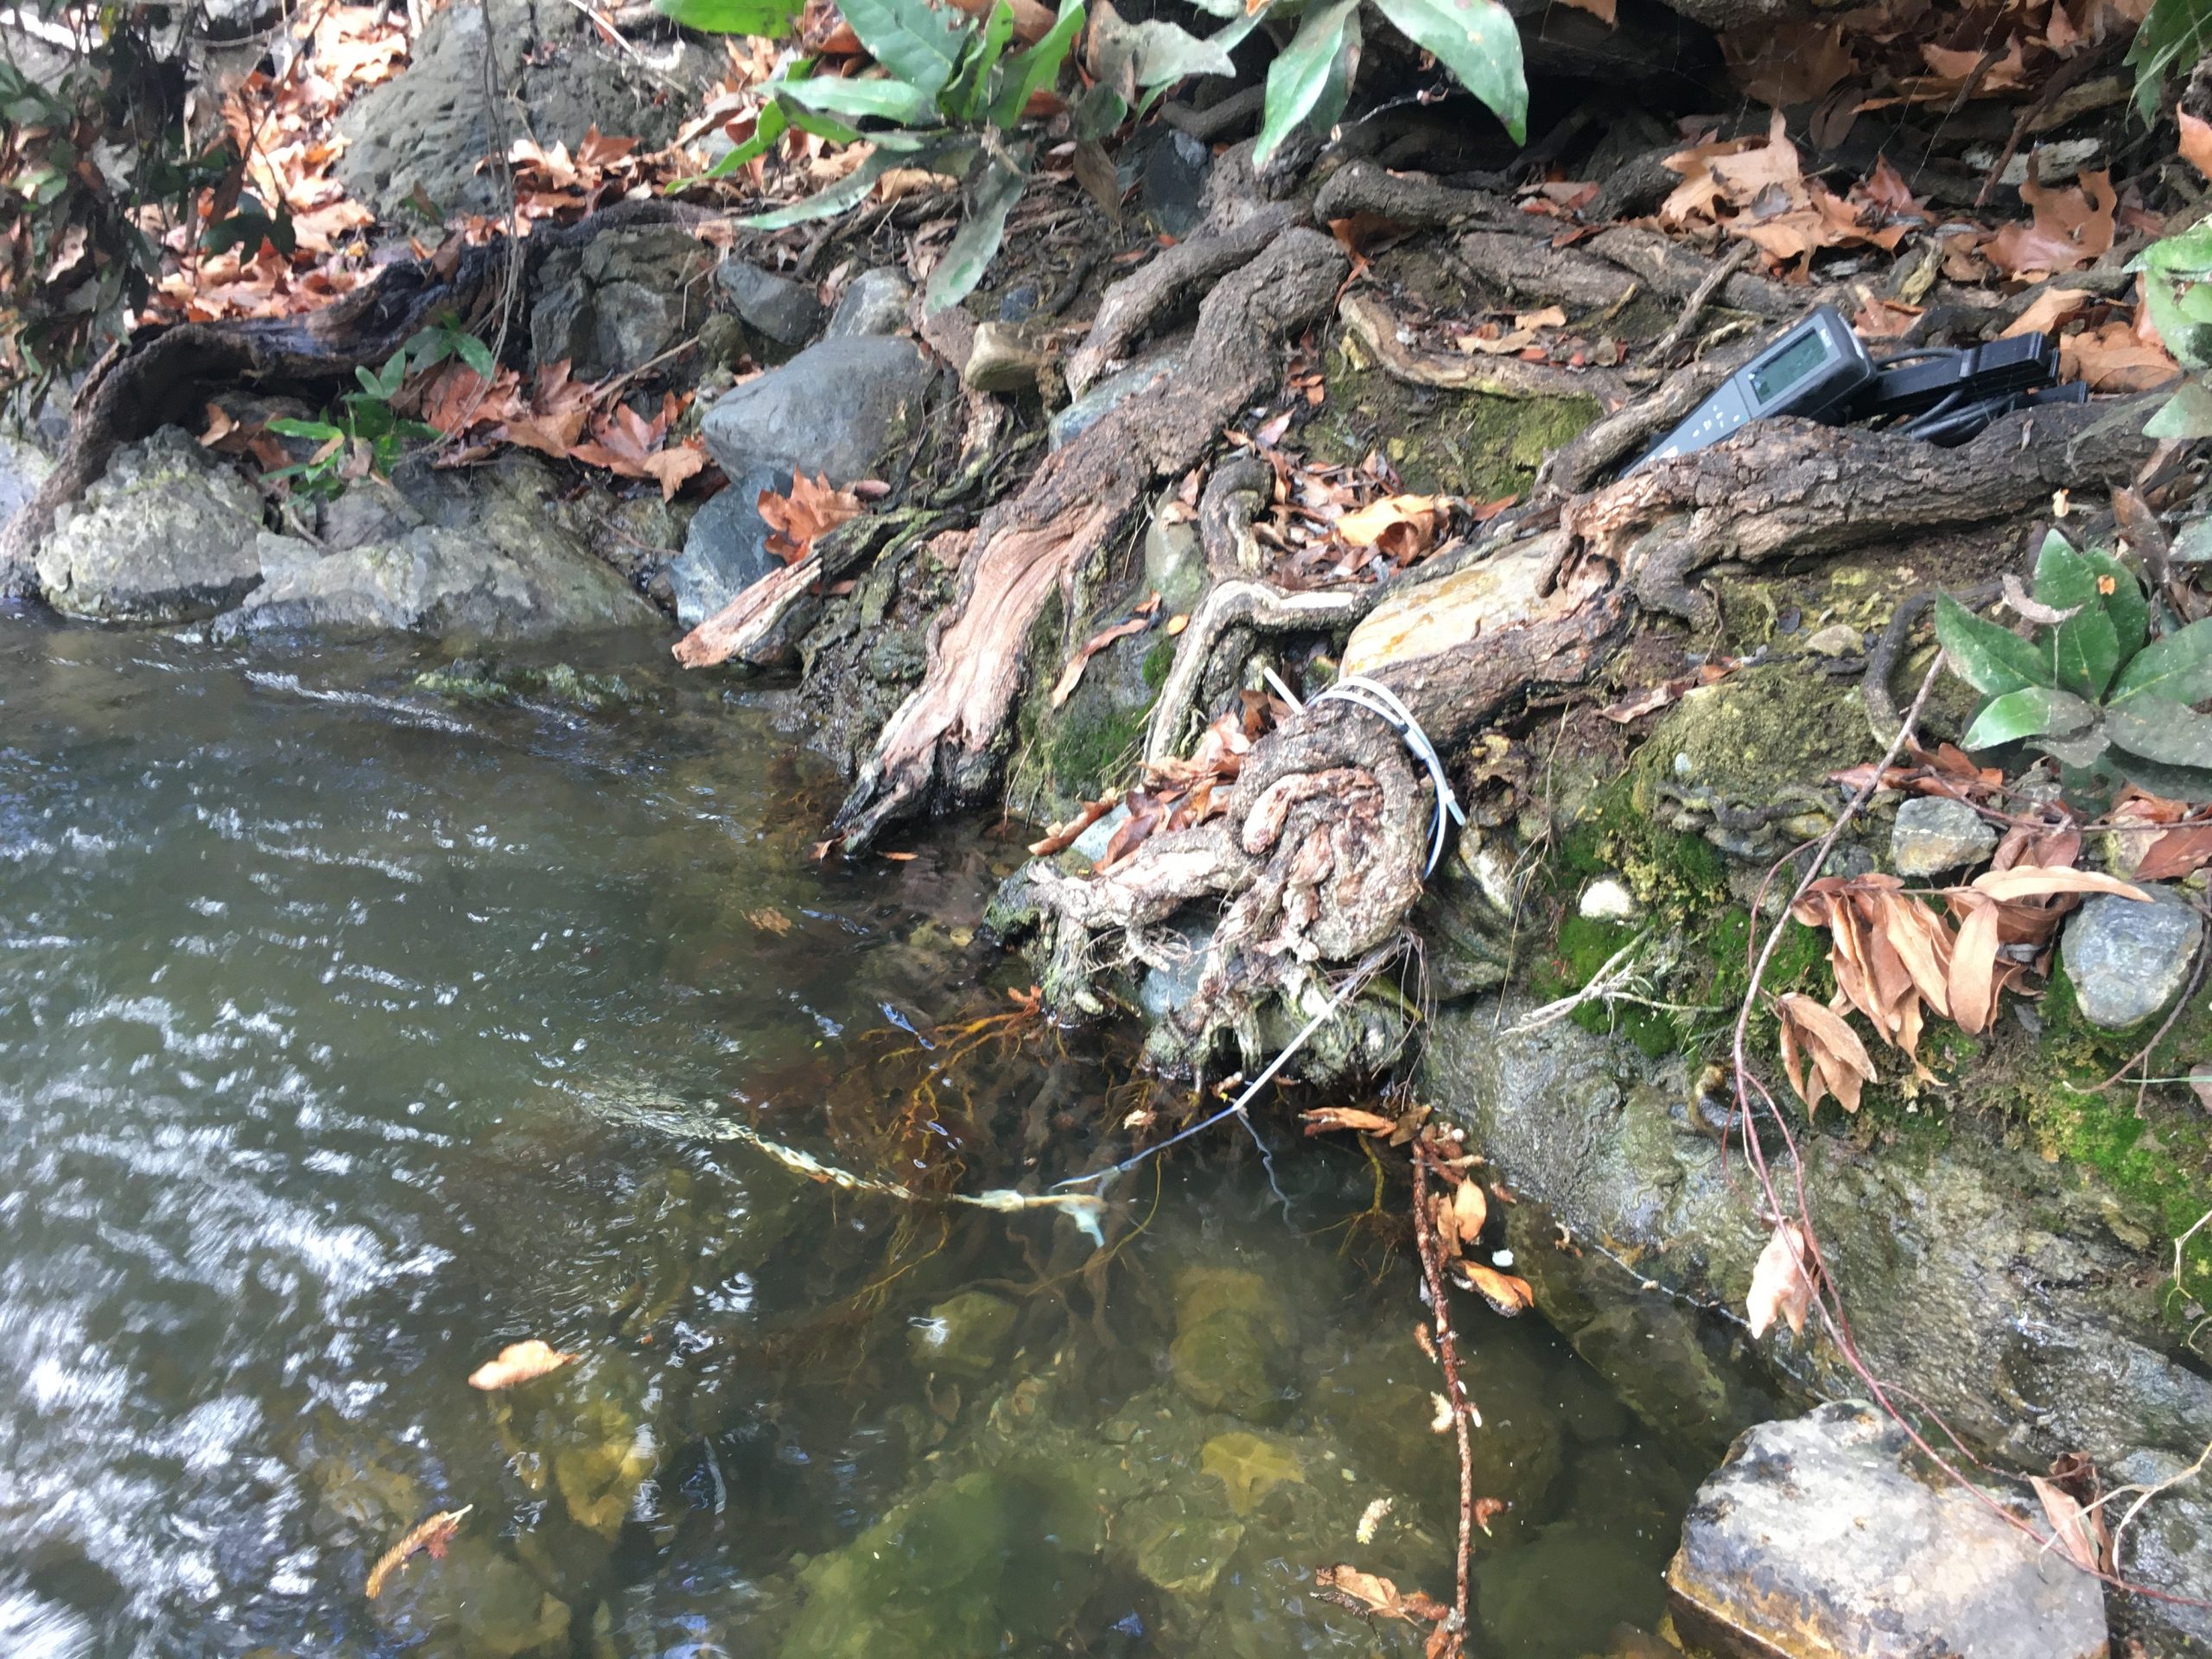
Find the continuous temperature monitor in this picture
References
- Moyle, P. B. Inland Fishes of California. Revised and expanded. Berkeley: University of California Press. 502 pp.
- Wilde, F. 2006. Temperature 6.1. In USGS Field Manual. Retrieved from http://water.usgs.gov/owq/FieldManual/Chapter6/6.1_ver2.pdf
Subscribe to our weekly blog to have posts like this delivered to your inbox each week.
Help us protect and restore the Morro Bay estuary!
- Donate to the Estuary Program today and support our work in the field, the lab, and beyond.
The Estuary Program is a 501(c)3 nonprofit. We depend on funding from grants and generous donors to continue our work. - Support us by purchasing estuary-themed gear from ESTERO. This locally owned and operated company donates 20% of proceeds from its Estuary clothing line and 100% of Estuary decal proceeds to the Estuary Program. Thank you, ESTERO!
- Purchase items from the the Estuary Program’s store on Zazzle. Zazzle prints and ships your items, and the Estuary Program receives 10% of the proceeds. Choose from mugs, hats, t-shirts, and even fanny packs (they’re back!) with our fun Estuary Octopus design, our classic Estuary Program logo, or our Mutts for the Bay logo.
Thank you for helping our beautiful, bountiful, biodiverse bay.
Where’s the continuous temperature logger?
It’s circled in the photograph below.