A series of heavy rain storms hit San Luis Obispo County during January 2023. The intense rainfall led to extremely high stream flows throughout the Morro Bay watershed. Many low-lying areas experienced overflowing channels, flooding, and erosion as a result of the storms.
Breaking Records
San Luis Obispo County received a record amount of rainfall during recent storms. A rain gauge located near the center of the Morro Bay watershed recorded 9.11 inches of rainfall between January 1st and January 24th. To put this in perspective, our area typically receives about 20 inches of rain during the entire year.
A series of rainstorms can quickly and dramatically influence stream levels. When the ground is already saturated with water, the rainfall that would normally sink into the ground instead runs quickly downstream into the nearest water body. At its highest point, water levels on Chorro Creek at Canet Road reached a height of 22.95 feet on January 9th. This is the highest water level recorded at this site since monitoring began in 1979.
How Much Water?
Stream gauges tell us how deep the water is at one stationary location. While this information is important, we are interested to know how much water is moving through the creek. To calculate how much water is in the creek, we use specialized equations called “rating curves.” Rating curves help us translate water height in feet into stream flow in cubic feet per second (or “cfs”).
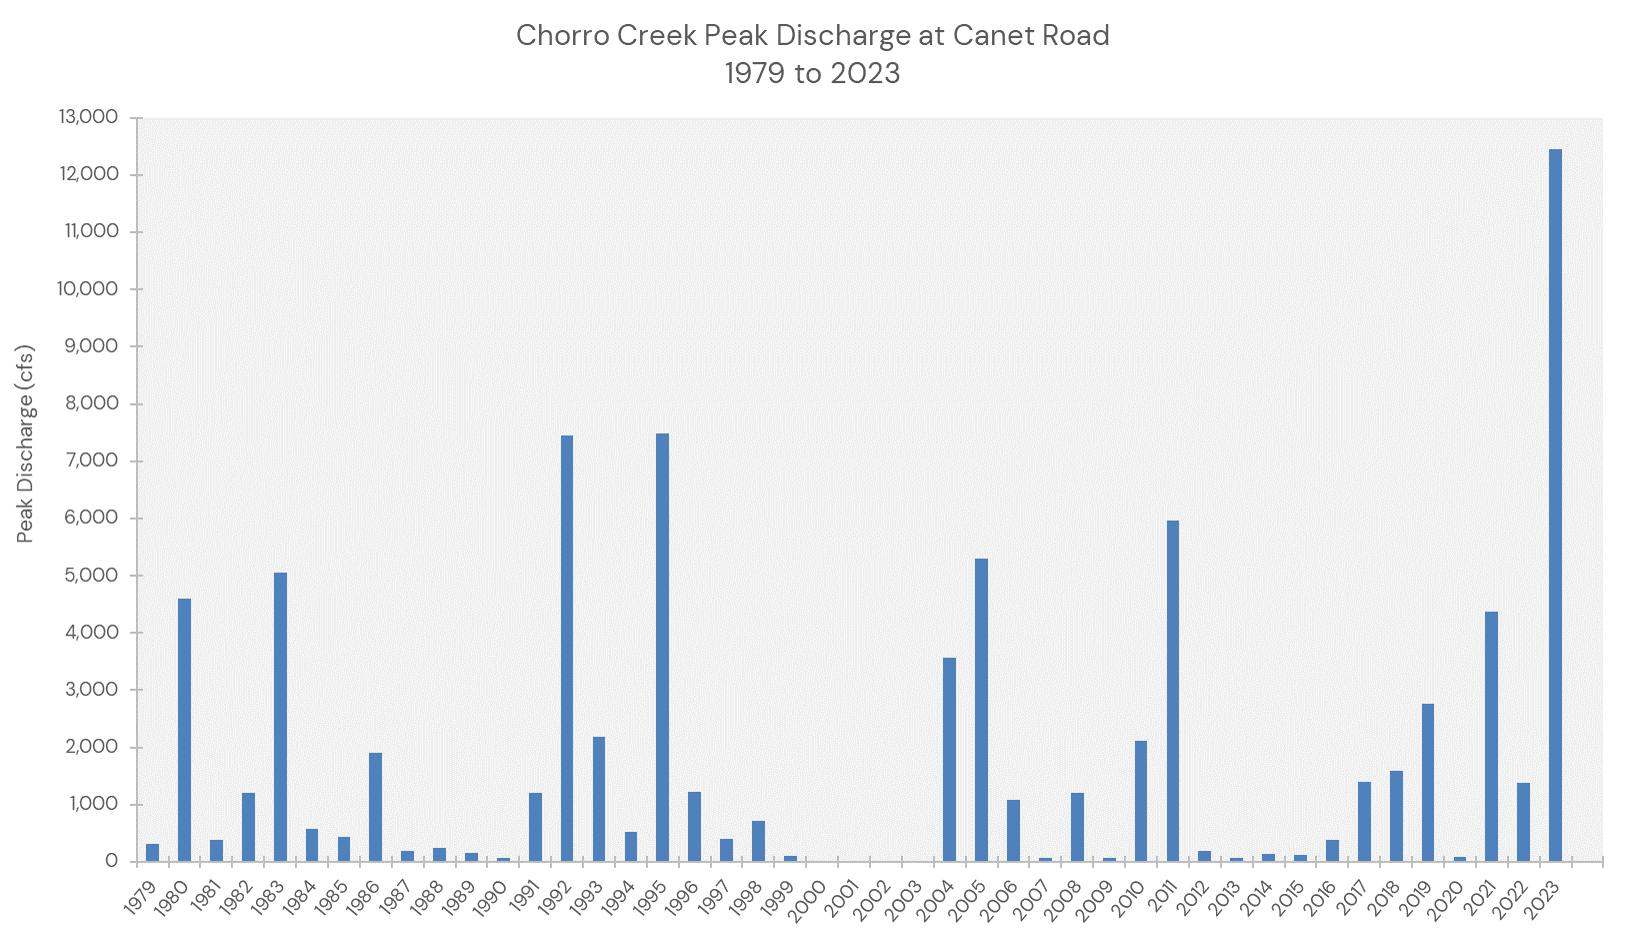
Using a rating curve specifically designed for the Canet gauge, we estimate that Chorro Creek received a maximum stream flow of 12,456 cfs during the January 9th storm. This peak discharge is more than 50% higher than previous peak flows measured at this site. To better illustrate this, the graph below shows the peak discharges at the Canet gauge between 1979 and January 2023.
Visualizing Streamflow
A standard basketball is roughly the size of one cubic foot. If the stream flow is 20 cfs, you might picture about 20 basketballs rolling downstream per second. The recent storm brought a peak flow of nearly 12,456 cfs, or 12,456 basketballs moving downstream every second.
Now, imagine that each basketball weighs 62.4 pounds, the weight of one cubic foot of water. At peak flow, those 12,456 basketballs had a force of 777,260 pounds per cubic foot every second!
Monitoring Creeks Post-Storm
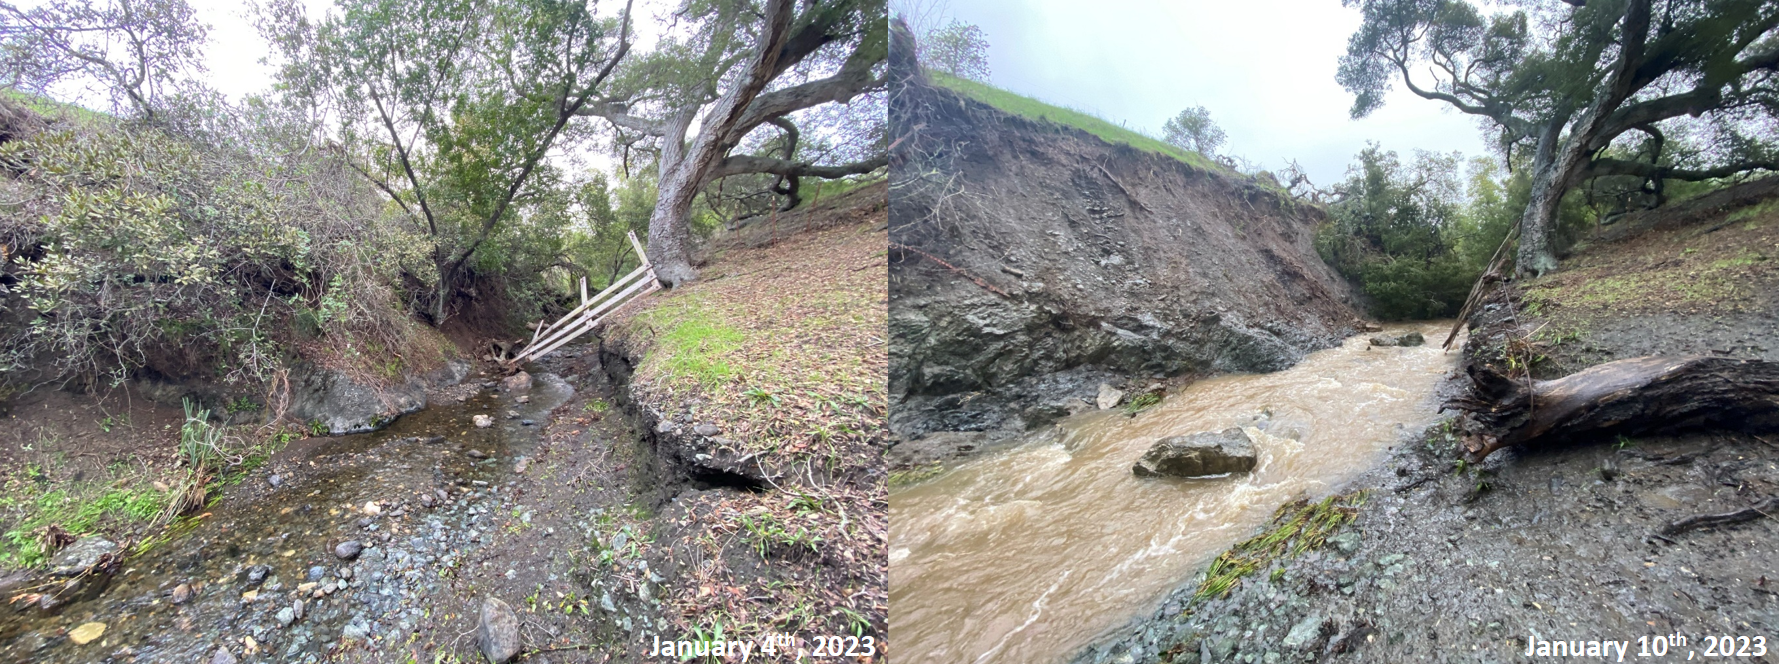
Many of our creek sites look very different following the recent storms. Sites like Pennington Creek experienced significant erosion, where the strong flows scoured stream banks and swept away vegetation.
Chorro Creek Ecological Reserve
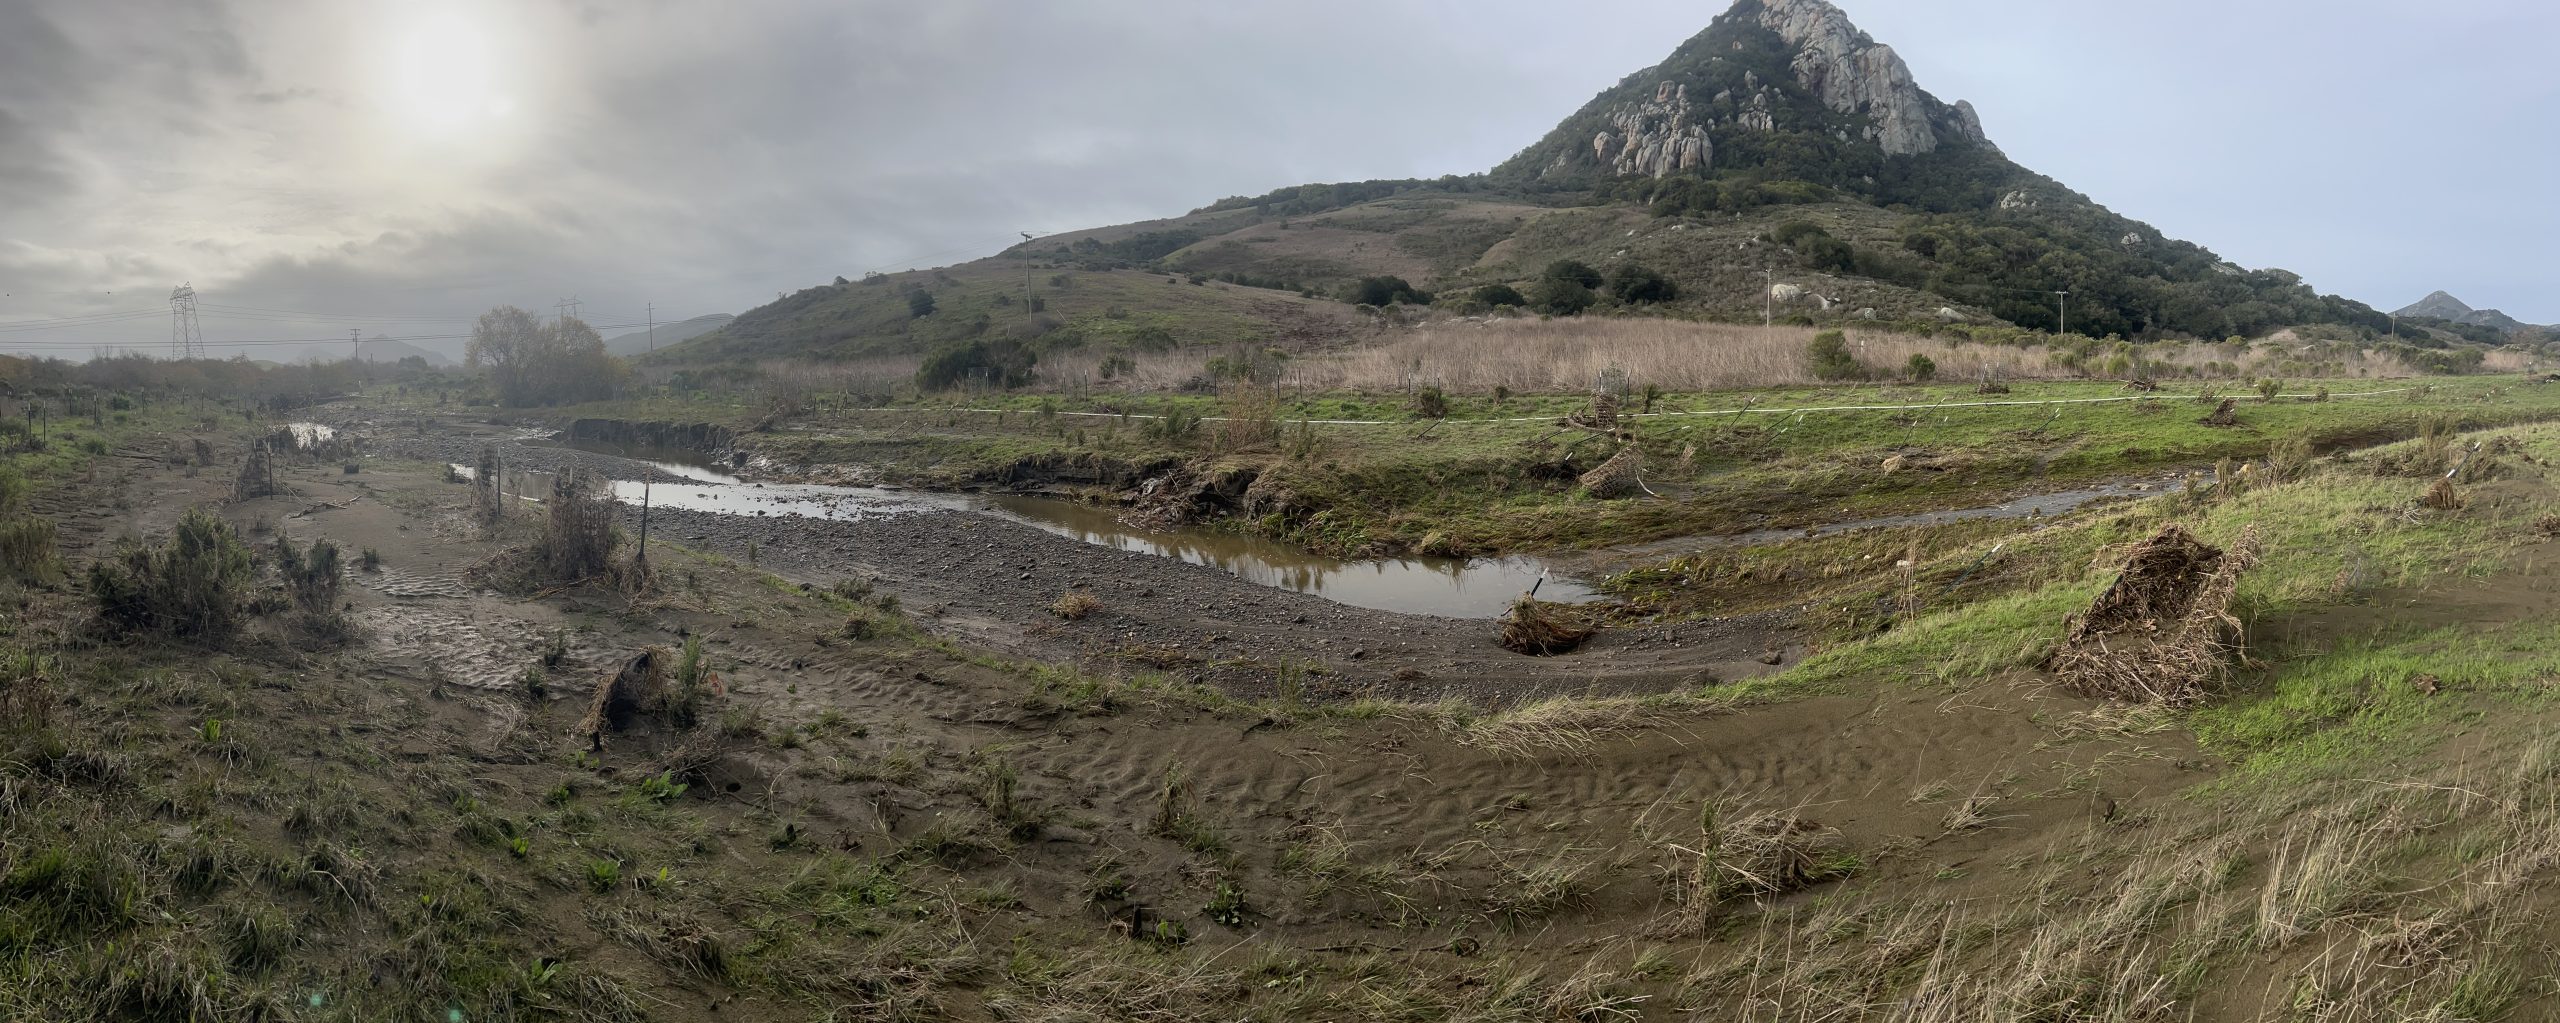
In the fall of 2019, the Estuary Program completed a 4.8-acre floodplain restoration project along Chorro Creek at the base of Hollister Peak. This project was made possible with the help of many partners including the California Conservation Corps (CCC), California Department of Fish and Wildlife (CDFW), State Coastal Conservancy, and many more. To read more about the project design and implementation, you can revisit our blog post from last year.
During late January 2021, the Chorro Creek Ecological Reserve experienced its first large storm event, which you can read more about in this blog post. In both the 2021 and 2022 storms, the project site held up well against some of the highest flows on record. The constructed floodplain allowed sediment to be deposited during high flows rather than being pushed downstream into the estuary. The floodplain also allowed for water to slow down and sink in, which recharges groundwater and provides wildlife habitat.
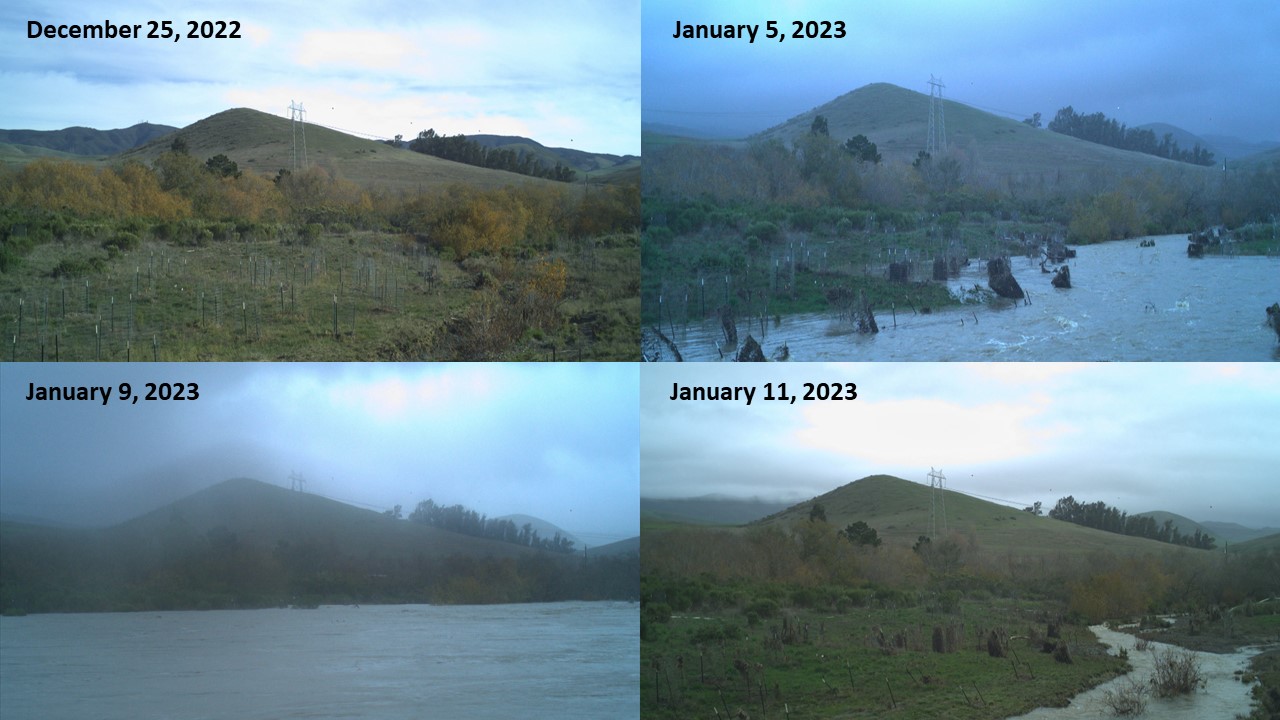
Check out the video below for a time-lapse of the project site during the high January flows!
The video above shows the Chorro Creek Ecological Reserve during the January 9th storm. This is the largest flow event that the project site has experienced since construction was completed in 2019.
Unlike the 2021 storm which had over 90% plant survival, the extremely high flows from January 2023 impacted native plantings in the lower floodplain. The Estuary Program is currently assessing plant survival with the support of the California Conservation Corps. We are also looking into areas of erosion and deposition to understand how the project has changed post-storm.
Volunteers Back in Action
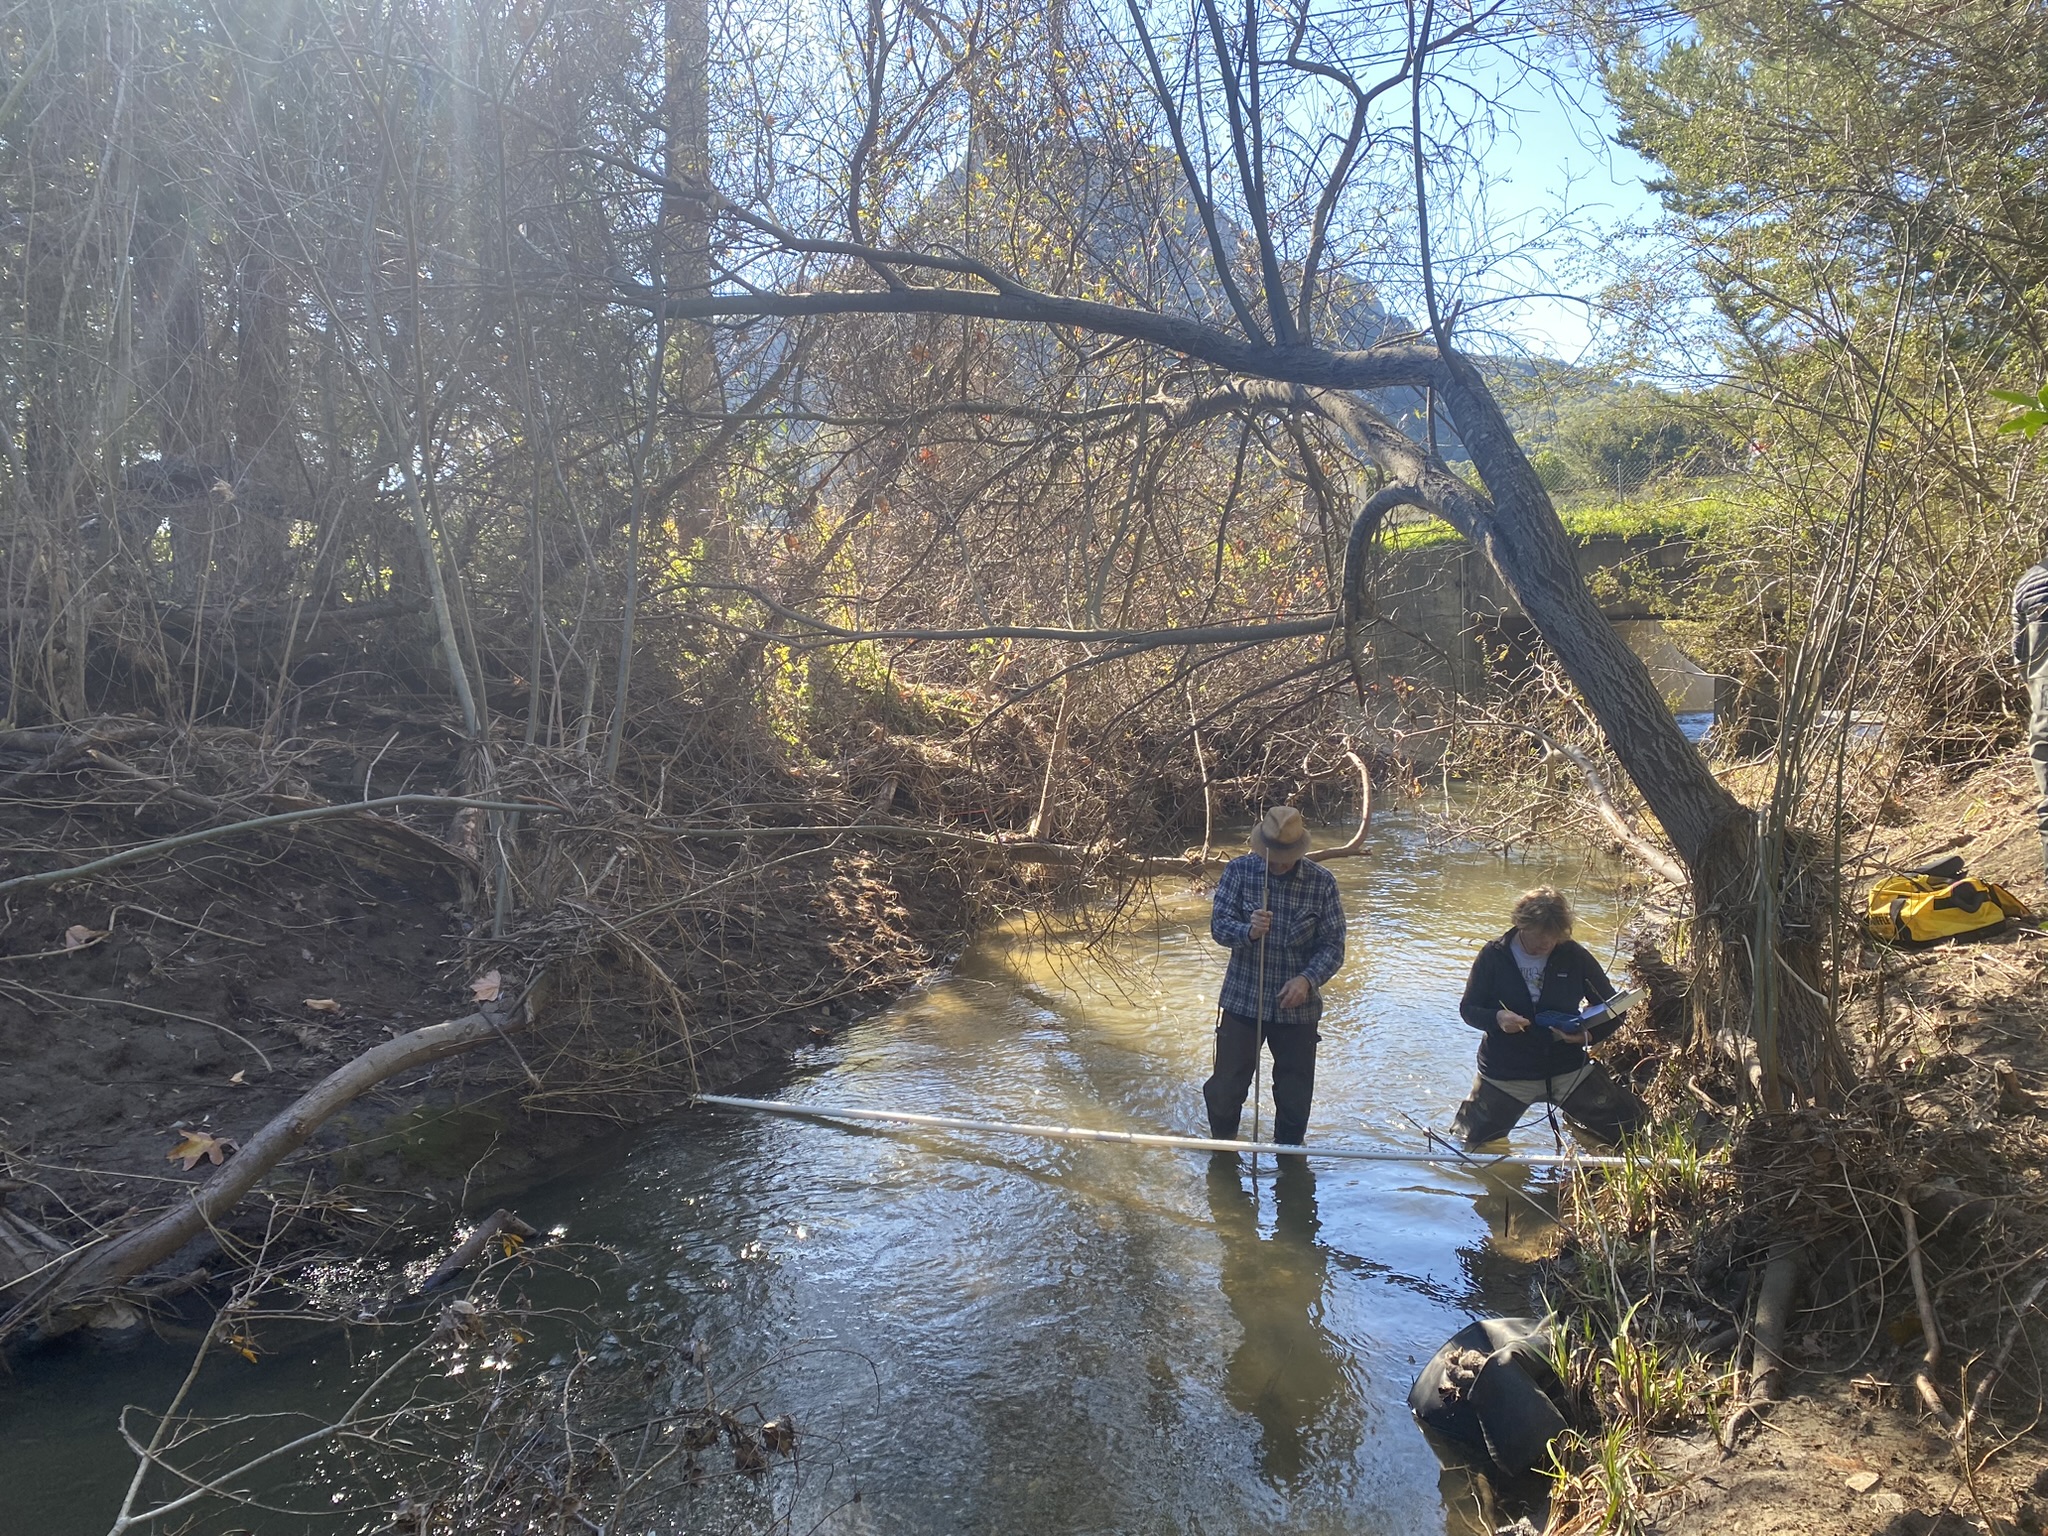
Large storms and high flows can create unsafe situations for staff and volunteers. Turbulent stream flow and unstable banks can quickly sweep even the most river-savvy off their feet. To keep our team out of harm’s way, we assess sites after large storms. When flows are low enough to safely enter, we can resume creek monitoring tasks.
Help us protect and restore the Morro Bay estuary!
- Donate to the Estuary Program today and support our work in the field, the lab, and beyond.
The Estuary Program is a 501(c)3 nonprofit. We depend on funding from grants and generous donors to continue our work. - Support us by purchasing estuary-themed gear from ESTERO. This locally owned and operated company donates 20% of proceeds from its Estuary clothing line and 100% of Estuary decal proceeds to the Estuary Program. Thank you, ESTERO!
- Purchase items from the Estuary Program’s store on Zazzle. Zazzle prints and ships your items, and the Estuary Program receives 10% of the proceeds. Choose from mugs, hats, t-shirts, and even fanny packs (they’re back!) with our fun Estuary Octopus design, our classic Estuary Program logo, or our Mutts for the Bay logo.
Thank you for helping our beautiful, bountiful, biodiverse bay!