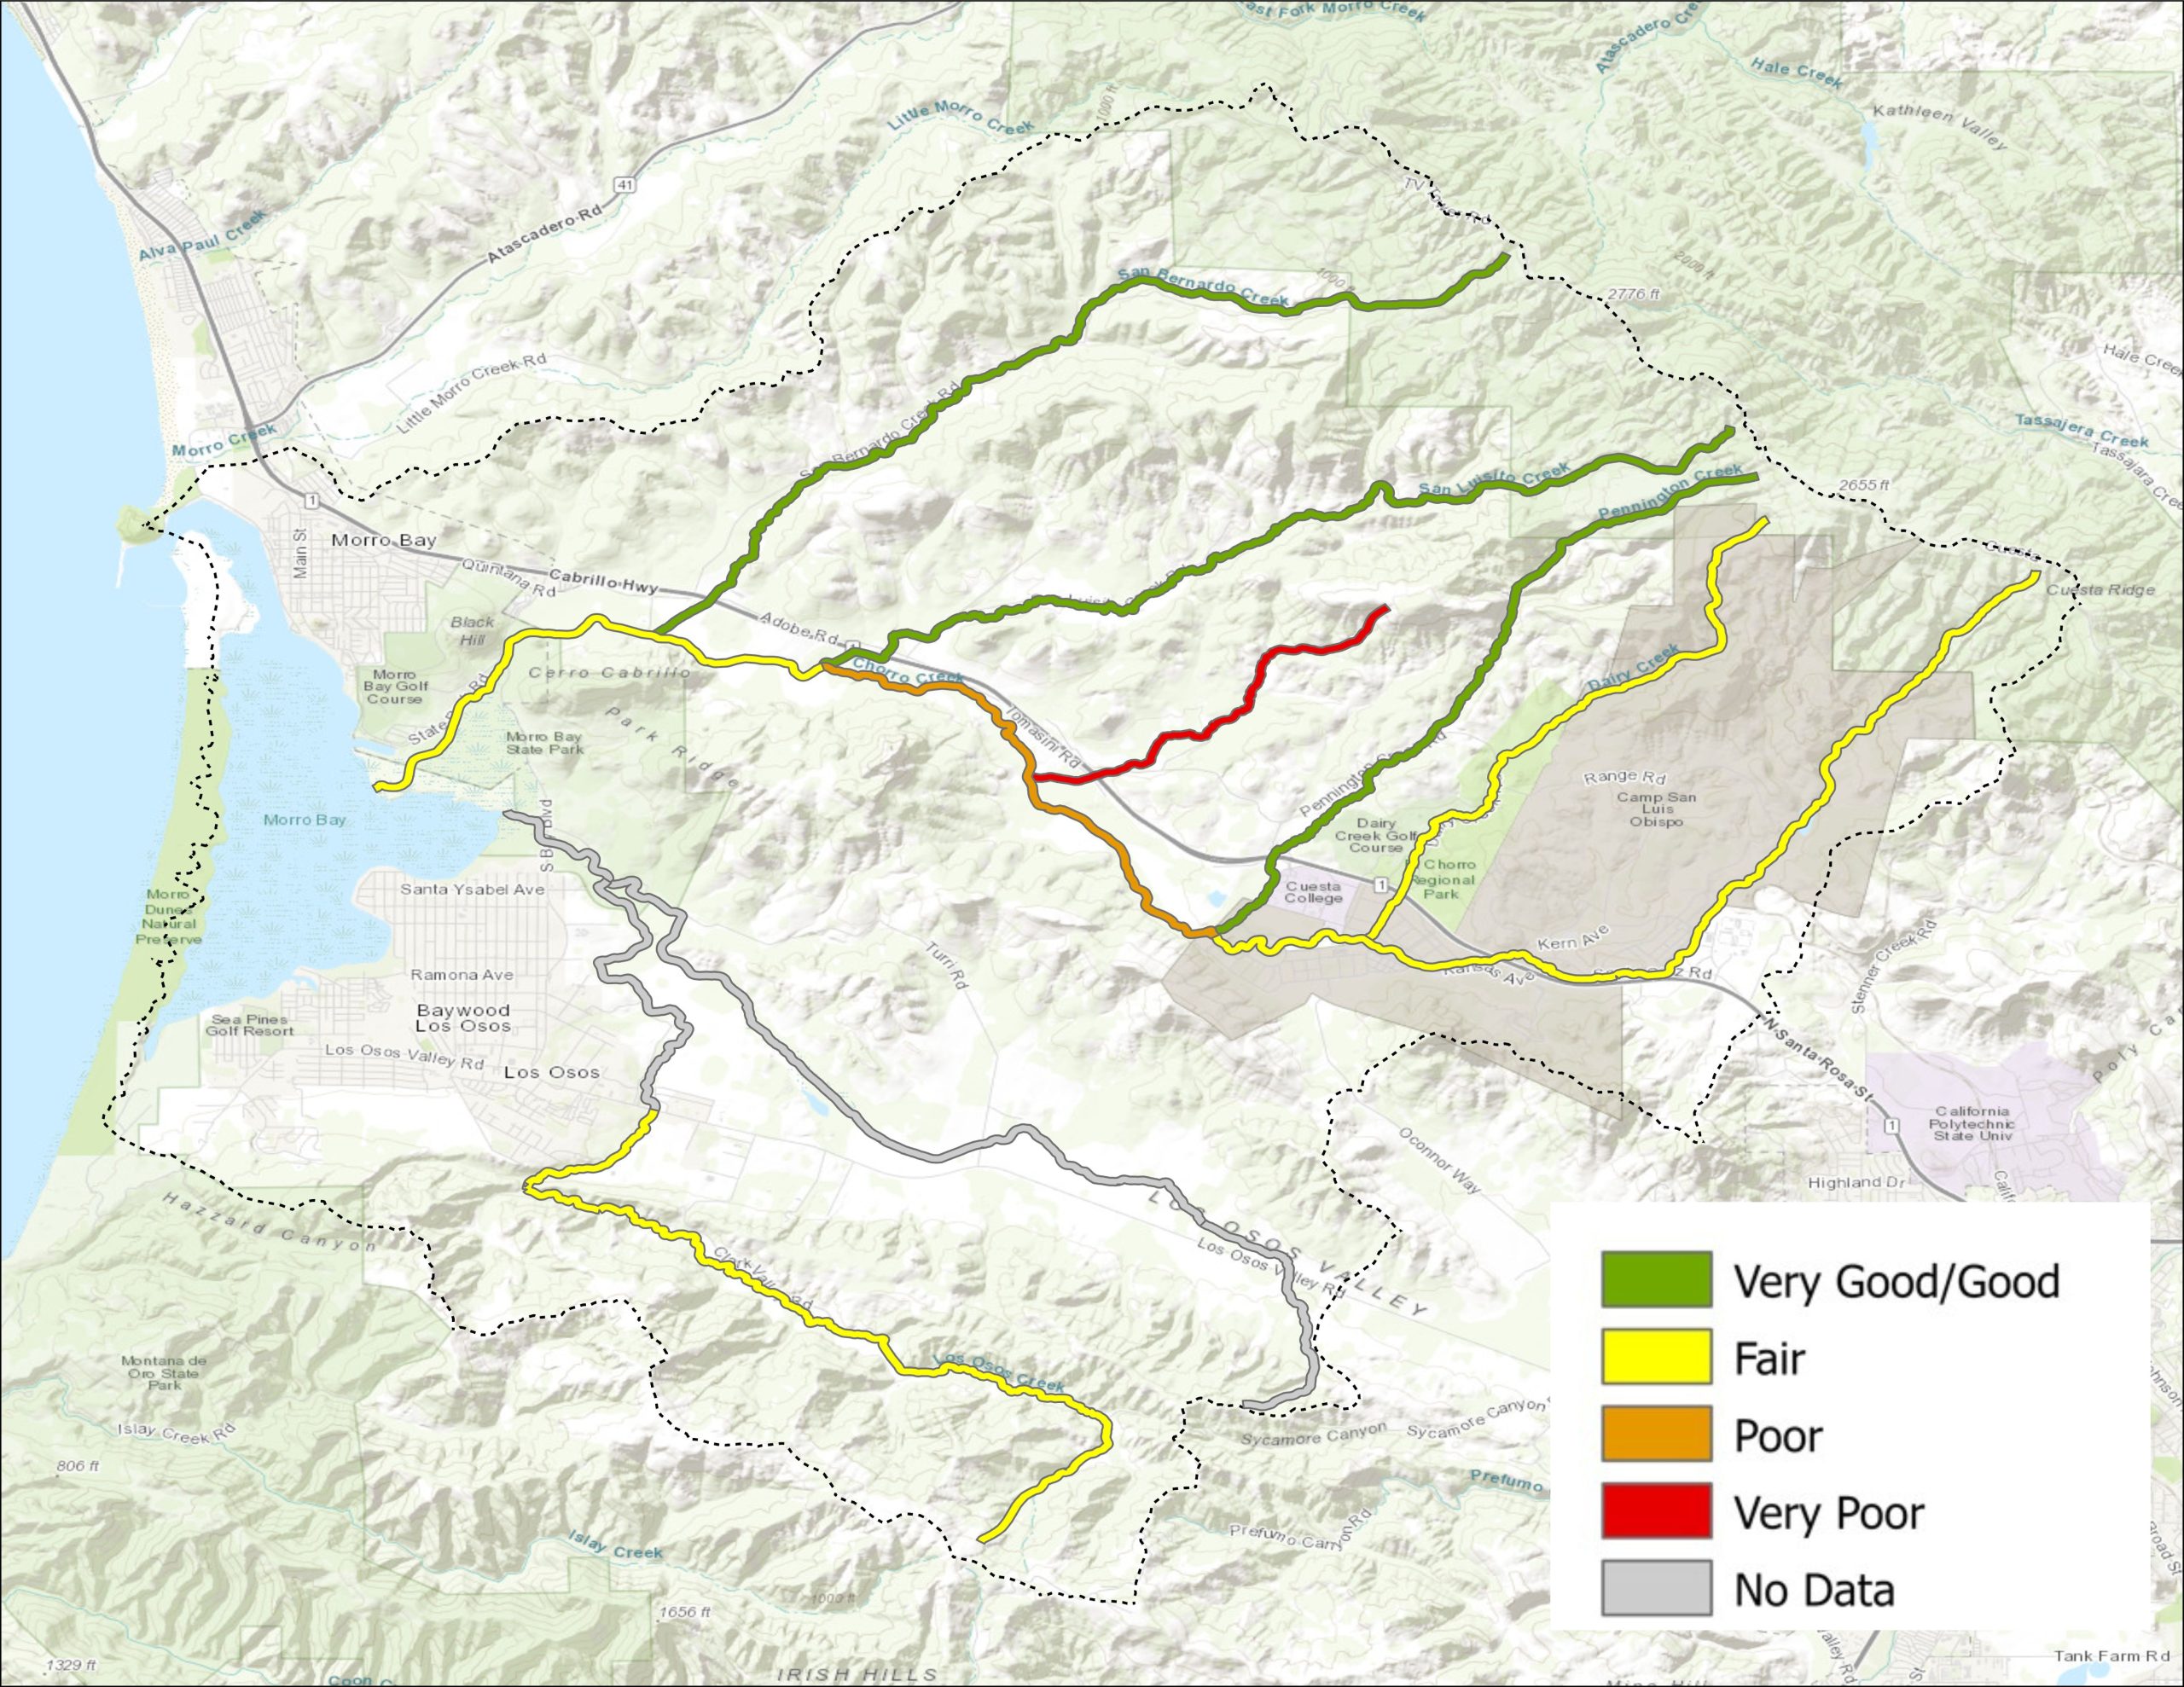
The map illustrates the average health scores for each creek or stretch of creek in the Morro Bay watershed, using data going back nearly 30 years. The creek segments colored green have ‘Good’ scores, meaning they have higher quality habitat that can support sensitive species of macroinvertebrates. Sections of creeks colored red have scored as ‘Very Poor,’ meaning that the creek may not be able to support any sensitive macroinvertebrates. Factors such as water levels, water quality, plant cover, and sediment in the creek can influence habitat quality.