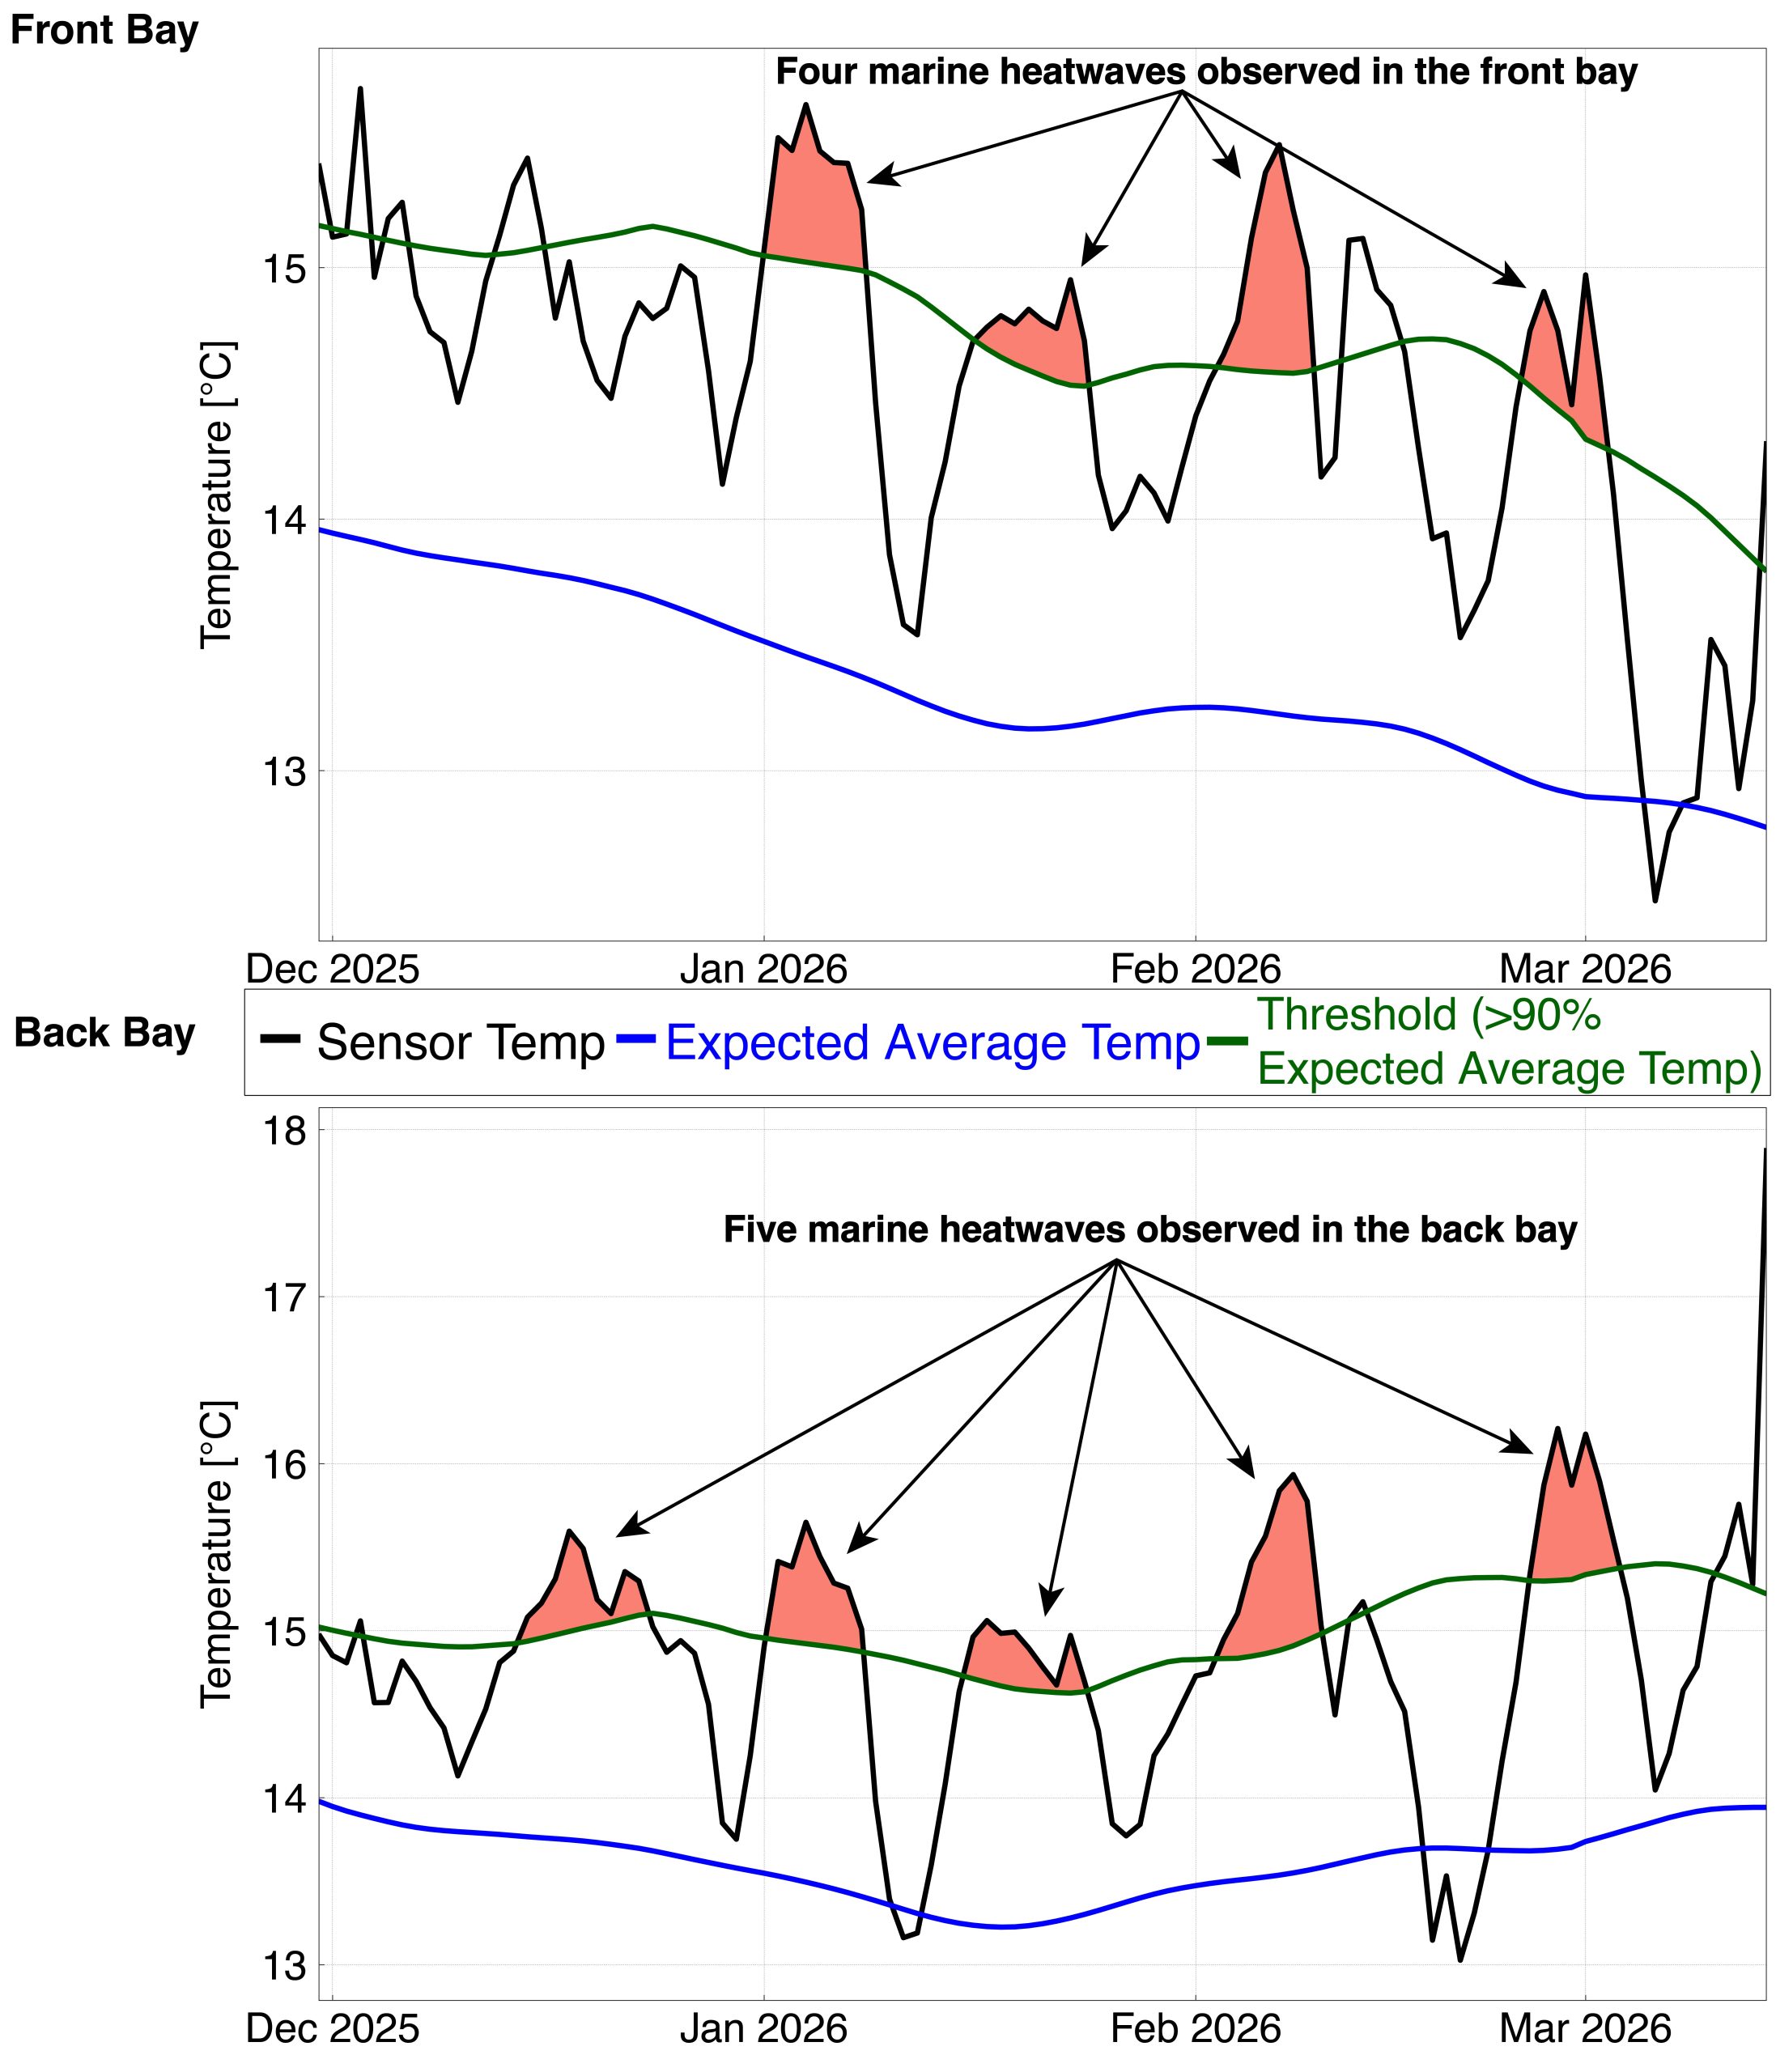
The top graph (Front Bay) and bottom graph (Back Bay) demonstrate average sensor temperature per day (°C) in black, expected seasonal average temperature in blue, and the threshold temperature for marine heatwaves (>90% of expected seasonal average) in green from December 2025 through March 23, 2026. The red-colored peaks indicate marine heatwaves, where temperatures exceed the threshold temperature for five or more days. Data was downloaded from the CeNCOOS data portals for Morro Bay Pier (Front Bay) and Back Bay sites and processed in heatwaveR (Schlegel & Smit 2018).